DOI:
10.1039/D4RA05493H
(Paper)
RSC Adv., 2024,
14, 31387-31397
Strategic electrochemical oxidation of vinblastin sulfate (an anticancer drug) via PVP-functionalized strontium oxide nanoparticles
Received
29th July 2024
, Accepted 19th September 2024
First published on 2nd October 2024
Abstract
Cancer is a primary cause of death worldwide, and considerably impacts mortality rates in low- and middle-income countries. The rise in chemotherapeutic patients and toxicity of cytotoxic agents highlight the need for reliable analytical methods to detect these compounds. The current study presents a simple and straightforward method for producing polyvinylpyrrolidone functionalized strontium oxide nanoparticles (PVP-SrO NPs). The synthesized PVP-SrO NPs were applied as a sensitive sensor to detect vinblastin sulfate (VNB) (an anticancer drug). The synthesized PVP-SrO NPs were characterized using different characterization techniques. Fourier transform infrared spectroscopy (FTIR) confirms the functionality of synthesized PVP-SrO NPs. The sharp intense peaks of X-ray diffraction spectroscopy (XRD) confirm the crystalline nature of NPs, scanning electron microscopy (SEM) confirm the nanobeads like morphology, and energy dispersive spectroscopy (EDS) reveals the presence of Sr and O at 68.3% and 23% respectively. The electrochemical impedance spectroscopy and cyclic voltammetry studies revealed that the PVP-SrO/GCE is more conductive than bare GCE with an Rct value of 960.4 Ω compared to 2440 Ω. The sensor exhibited a wide linear dynamic range for VNB (0.05 to 60 μM) with low LOD 0.005 μM, and LOD 0.017 μM. The proposed sensor was successfully used for monitoring VNB in human blood serum samples with a satisfactory percent recovery from 96% to 103%. The fabricated sensor exhibits better performance than the reported sensors in terms of processing, simplicity, cost-effectiveness, energy consumption, and enhanced efficacy in a very short time.
Introduction
Cancer is a deadly disease characterized by abnormal cell growth that has the potential to spread to different areas of the body. Cancer is a leading cause of death and a significant barrier to increasing life expectancy globally. According to World Health Organization (WHO) estimation in 2019, cancer is the major cause of death before the age of 70 in 112 out of 183 countries, and ranks third or fourth in an additional 23 countries. The growing significance of cancer as the leading cause of death relatively reflects that compared to cancer, the mortality rates of stroke and coronary heart disease decline in several states.1 Worldwide, there exist 38 types of cancer. Among them, the most dangerous cancers include lung, colorectal, liver cancer and the most common types are prostate and breast cancer. There are various types of treatments for cancer including chemotherapy, radiation therapy, and surgery. Despite substantial advancements in treatment methods, chemotherapy remains the most commonly used approach,2 particularly for the treatment of kidney cancer, lymphatic cancer, and cancer of small cells such as lung, ductal, and colorectal cancers.3 Vinblastin (VNB) is an anticancer drug also recognized as vincaleukoblastine isolated from the alkaloids of the Madagascar periwinkle (Catharanthus roseus) plant in 1960. It works by inhibiting cell division, disrupting the formation of the mitotic spindle, causing microtubule depolymerization, thereby disrupting cancer progress. When utilized in higher concentrations, it depolymerizes microtubules, forming protofilaments, spirals, and curls.4 In cancer chemotherapy, VNB is administered at a dose of l.0–6.0 mg m−2, which falls the concentration of serum activity below 10 ng mL−1 for a few hours.5 VNB is usually administered intravenously as sulfate salt, consisting of 1 mg mL−1 in a 0.9% sodium chloride solution. The pharmacokinetic study reveals that the metabolism of VNB is mainly done by hepatocytes. VNB has been mediated by cytochrome P4503A isoenzyme (CYP). It is estimated that VNB is primarily metabolized in liver, where it is converted into desacetylevinblastine which is more active compound. The desacetylevinblastin is only metabolite identified for vinblastine, with a low concentration of about 1% of the total dose in the urine and stool of patients. Additionally, minor metabolites like 3.0–6.0 epoxyvinorelbine and 11 others were also identified in urine.6,7 Along with various advantages, VNB can cause severe neurotoxicity including motor and sensory neuropathy, and a range of central nervous system disorders. Despite of various antidotes, their effectiveness in mitigating these toxicities remains limited, and significant hematological and gastrointestinal side effects have been observed.8 Thus, an accurate monitoring of VNB concentration in patients is essential for effective chemotherapy, as it ensures therapeutic efficacy and minimizes toxicity. Many conventional methods have been employed for the detection of VNB in clinical assays. The detection of VNB done by Rohanizah Abdul Rahim,9,10 H. A. Jeewantha et al.11 and M. M. Gupta et al.12 using high-performance liquid chromatography (HPLC). The limit of detection was found to be 0.023 μg mL−1, 0.05 ng mL−1 and 46.0 μg mL−1. VNB was detected in tumor tissues using high-performance liquid chromatography-high resolution mass spectrometry with a limit of detection of 23.0 ng g−1. All these methods have been widely used, but their use was limited by some drawbacks such as the need for skilled operators,13 the use of poisonous solvents,14 and the inability to convert portable kits. Moreover, these methods are not always suitable for real-time or immediate monitoring. Given these challenges, there is a need for a reliable, cost-effective, and sensitive method for detecting VNB in clinical contexts. Electroanalytical methods have proven to be effective tools for the detection of many compounds of medicinal importance.15 Electrochemical methods offer several advantages over conventional techniques, including lower costs, simpler operation, faster analysis times, and the potential for miniaturization and portability.16,17 The choice of electrode material plays a crucial role in the performance of electrochemical sensors, with factors such as conductivity, stability, and surface properties influencing detection sensitivity and selectivity.18 In the past, various nanoparticles (NPs) have been extensively employed in biosensors for the detection of VNB for highly sensitive electrochemical and optical measurements in bioassays.19,20 A portable solid-state sensor has been reported by M. M. Galal et al. The sensor exhibited LOD as 2.88 μM with linear dynamic range of 0.01–2.99 μM.21 Boron-doped diamond electrodes have also been reported by G. Önal et al., with LOD 0.3 μM and linear dynamic range of 0.011–0.99 μM (ref. 22) and a molecular imprinted electrochemical sensor was reported for the detection of VNB by Yan Zhang et al. having linear dynamic range of 0.05–5 with LOD 0.05 μM.23 However, these materials have disadvantages being more expensive and low limit of detection. In current study, strontium oxide capped with PVP has been used as sensing tool for the determination of VNB in human blood serum samples. Strontium oxide (SrO) has the highest sensing as well as catalytic activity being nontoxic and preventing environmental risk. SrO NPs possess various advantages including rapid and easy synthesis, a narrow size distribution, captivating optical and electronic features.24 The Sr+ and O2− ions in SrO help to produce binding sites and facilitate the detection of drugs.25 The key functional groups present in the structure of vinblastin sulfate include amine groups, hydroxyl groups, an indole ring, methoxy groups, and sulfate groups.26 The negatively charged sulfate group dominates the most probable interaction between SrO NPs and VNB by interacting with a positively charged strontium oxide surface. Hydroxyl and amine groups result in hydrogen bonding with the oxygen of strontium and potential coordination occurs between the oxygen of VNB and the Sr in SrO. Moreover, the SrO functionalized with PVP exhibits all the desired features with great stability. PVP being a long-chain polymer stabilizes the SrO by steric effect stabilization.27 Because of these attributes, PVP functionalized SrO nanostructure is a great choice for the detection of VNB for biological samples as well as environmental assay.
This research aims to synthesize a novel PVP-SrO/GCE sensor for the detection of antineoplastic agent VNB. PVP-SrO/GCE exhibits excellent stability and electro-catalytic efficiency, such as very low detection limit, high sensitivity, rapid response, wide linear range, and brilliant selectivity. This approach could offer a promising alternative for therapeutic monitoring of VNB, contributing to better clinical outcomes.
Material and methods
Chemicals and reagents
All the chemicals employed in this experiment were of analytical grade. Strontium nitrate hexahydrate (Sr(NO3)2·6H2O 98.0%), sodium hydroxide (NaOH 96.0%), and polyvinylpyrrolidone (PVP 100% purity) were acquired from the German company Merck. The salt of vinblastine sulfate (VNB) was acquired from Sigma Aldrich Germany. A stock solution of VNB sulfate (0.0002 M) was prepared in deionized water (DI). The BRB buffer of concentration 0.1 M was prepared in DI water. Britton–Robinson buffer (BRB) was made from 0.1 M acetic acid (100%), 0.1 M phosphoric acid (99–100%), and 0.1 M boric acid (99–100%) and used as a supporting electrolyte. The pH of the buffer was adjusted to the desired value by adding 0.1 M NaOH and 0.1 M HCl. The Nafion® solution was acquired from Sigma-Aldrich (Sweden and the UK) and diluted to 0.1% in DI water. To prepare a standard solution of VNB, a vial of Cytoblastin was utilized (vial 10 mg/10 mL). The vial has one milligram of VNB sulfate. The vial contents were homogeneously mixed and 0.0002 M stock solution of VNB has been prepared.
Synthesis procedure for PVP-SrO nanoparticles
All the chemicals used in this experiment were of analytical grade. PVP-SrO nanostructures were synthesized successfully using an easy and simple co-precipitation method. Sr(NO3)2·6H2O was utilized as a precursor salt, NaOH was used as a reducing agent and PVP as a stabilizing agent. Three different solutions of concentration 0.1 M of (Sr(NO3)2·6H2O), 0.5 M of NaOH, and 5% solution of PVP were prepared in separate 50 mL volumetric flasks.28,29 A 0.1 M solution of (Sr(NO3)2·6H2O) was added to a 200 mL beaker. The solution was stirred for 15 min until it completely homogenized. A solution of 0.5 M NaOH and a 5% solution of PVP was prepared and added dropwise into a precursor salt solution. The solution was then covered with ammonium foil and further stirred for 2 h overtime. As the process continues, precipitates of Sr(OH)2 formed. The synthesized precipitates were filtered, rinsed with deionized water, and kept inside the oven, for 2 h at 120 °C to obtain dried precipitates. Finally, Sr(OH)2 kept at 500 °C for 4 h in a muffle furnace to obtain pure crystalline polyvinylpyrrolidone capped strontium oxide nanoparticles (PVP-SrO NPs).30 The graphical layout for the synthesis of PVP-SrO NPs is demonstrated in Fig. 1.
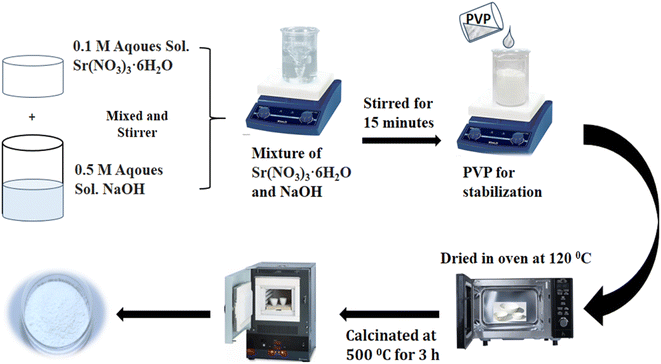 |
| | Fig. 1 Graphical layout for the synthesis of PVP-SrO NPs. | |
Instrumentation
To confirm the successful synthesis of the desired material, various characterization techniques were used. The functionalities of the resulting PVP-SrO nanostructures were assessed using a Fourier transform infrared spectrophotometer (Thermo Nicolet 5700), the phase recognition and crystalline nature of PVP-SrO nanostructures were investigated by the use of X-ray powder diffraction (XRD) using a Phillips PW 1729 powder diffractometer and elemental conformation of materials was carried out using energy dispersive spectroscopy (EDS). The shape and morphological characteristics of the material were analyzed by field emission scanning electron microscopy (FE-SEM) using a LEO 1550 Gemini operating at a voltage of 20 kV. The entire electrochemical study was conducted using a CHI 760 electrochemical workstation (USA). The three-electrode setup was constructed using GCE-modified PVP-SrO NPs as the working, conspires with a reference electrode (Ag/AgCl) and a counter electrode (platinum wire), respectively. Ag/AgCl electrode used as a reference electrode because of reproducible potential, non-polarizable nature, compatibility with the aqueous system, ease of preparation, and cost-effectiveness.31
Modification of glassy carbon electrode
The glassy carbon electrode was completely polished using an aluminum oxide suspension by rubbing at an alumina polishing pad for 2–3 min and rinsed with deionized water before modification. The electrode was then subsequently sonicated in deionized water. In a usual preparation, (2 mg/2 mL) suspension of PVP-SrO nanoparticles was prepared and sonicated for 20 min along with 0.1% Nafion® solution as a binder, until a homogeneous dispersion was obtained. The Nafion solution was used as a binder as it is a conductive binder and it facilitate H+ transfer and other cations in electrode material and improve the overall conductivity of the system. A 5.0 μL of PVP-SrO NPs solution was used for the modification of GCE using the drop deposition method and dried at room temperature.
Experimental parameters for electrochemical detection of VNB
For the electrochemical detection of VNB initially cyclic voltammetry was employed. The experiments were conducted within the potential range of 0.4–1.6 V to ensure the redox process associated with VNB. The Britten–Robinson buffer (BRB) with pH 5.0 was used as a supporting electrolyte. The pH of the electrolyte was carefully maintained using NaOH and HCl. A scan rate of 50 mV s−1 was used to ensure a balanced and accurate assessment of electrochemical behavior of VNB under specified conditions.
Results and discussion
UV-visible spectroscopy
Ultraviolet-visible spectroscopy is the foremost technique for confirming the successful synthesis of nanoparticles to obtain stable and tiny mono-dispersed nanoparticles. A colloidal dispersion of SrO NPs was synthesized by mixing the SrNO3 precursor salt, PVP as a capping agent and NaOH as a reducing agent. The UV-Vis spectrum for SrO presents an absorption peak around 296.8 nm while PVP-SrO NPs show an absorption peak around 301.2 as shown in Fig. 2 reported in the prior research.32 The increased absorption intensity and slight shift of absorption peak form 296.8 nm to 301.2 nm exhibits that PVP has successfully functionalized the SrO NPs.33
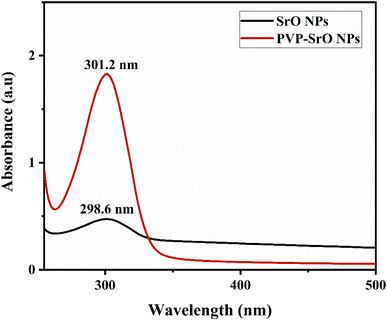 |
| | Fig. 2 UV-visible spectrum of SrO and PVP-SrO nanostructures. | |
FTIR analysis
FTIR spectroscopy was assessed to evaluate different functionalities found in the fabricated PVP-SrO NPs. FTIR spectra of PVP, SrO, and PVP-SrO NPs were obtained to verify the preparation process and changes in the nanostructures. The FTIR spectrum of pure PVP, SrO NPs, and PVP-SrO NPs shown in Fig. 3a. A characteristic band around 1646 cm−1 corresponds C![[double bond, length as m-dash]](https://www.rsc.org/images/entities/char_e001.gif) O group of pyrrolidone. Additional important bands include bands resulting from C–N stretching vibrations of PVP at 1293 cm−1, and an absorption peak at 1430 cm−1 caused by the CH band of PVP. The absorption peaks located around 2949 cm−1, 2894 cm−1, and the broad peak centered at around 3416 cm−1, are responsible for CH2 symmetric stretching, CH2 asymmetric stretching, and O–H symmetric stretching vibrational peaks respectively. PVP stretching band of the C–N
O group of pyrrolidone. Additional important bands include bands resulting from C–N stretching vibrations of PVP at 1293 cm−1, and an absorption peak at 1430 cm−1 caused by the CH band of PVP. The absorption peaks located around 2949 cm−1, 2894 cm−1, and the broad peak centered at around 3416 cm−1, are responsible for CH2 symmetric stretching, CH2 asymmetric stretching, and O–H symmetric stretching vibrational peaks respectively. PVP stretching band of the C–N![[double bond, length as m-dash]](https://www.rsc.org/images/entities/char_e001.gif) O bands is represented at 560 cm−1.34 Typical SrO NPs spectrum is shown in Fig. 3b. Bends at 848 cm−1 and 701 cm−1 indicate both symmetric and asymmetric stretching of Sr–O. The band at 1437 cm−1 indicates an O–H bend of H2O caused by the absorption of atmospheric moisture.35 The PVP-SrO FTIR spectra are shown in Fig. 3c. The peaks around 839 cm−1 and 704 cm−1 show symmetric and asymmetric stretching of Sr–O. Stretching bands at 1680 cm−1, 1434 cm−1, 1025 cm−1, 900 cm−1, 3612 cm−1 and 570 cm−1, due to C
O bands is represented at 560 cm−1.34 Typical SrO NPs spectrum is shown in Fig. 3b. Bends at 848 cm−1 and 701 cm−1 indicate both symmetric and asymmetric stretching of Sr–O. The band at 1437 cm−1 indicates an O–H bend of H2O caused by the absorption of atmospheric moisture.35 The PVP-SrO FTIR spectra are shown in Fig. 3c. The peaks around 839 cm−1 and 704 cm−1 show symmetric and asymmetric stretching of Sr–O. Stretching bands at 1680 cm−1, 1434 cm−1, 1025 cm−1, 900 cm−1, 3612 cm−1 and 570 cm−1, due to C![[double bond, length as m-dash]](https://www.rsc.org/images/entities/char_e001.gif) O, O–H, CH2 and C–C, R–NH and N–C
O, O–H, CH2 and C–C, R–NH and N–C![[double bond, length as m-dash]](https://www.rsc.org/images/entities/char_e001.gif) O corresponds to functional groups of PVP. The slight shift and decrease in intensity of peaks indicate the efficient production of PVP-functionalized SrO NPs.36
O corresponds to functional groups of PVP. The slight shift and decrease in intensity of peaks indicate the efficient production of PVP-functionalized SrO NPs.36
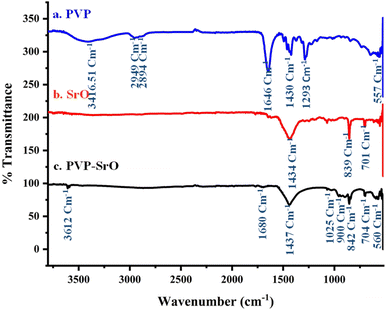 |
| | Fig. 3 FTIR spectrum of PVP-SrO nanostructures. (a) Pure PVP, (b) SrO nanostructures. (c) PVP functionalized SrO nanostructures. | |
XRD analysis
The XRD is a powerful technique to examine the crystallinity and phase transparency of the material. The crystalline nature of the material is examined through the XRD pattern appearing in Bragg's peaks. If the peaks are broadly humped, then the material is amorphous with short-range ordering. The material is crystalline, when peaks are sharp. The material exhibits both characteristics, i.e. semi-crystalline and crystalline when the peaks are a combination of both sharp and broad peaks. The structural morphology and crystalline nature of PVP functionalized SrO is determined by analysis of XRD. In Fig. 4 an XRD pattern of a SrO functionalized with PVP is presented. The XRD pattern shows distinct sharp peaks at angles of ∼19.82°, 23.4°, 28.4°, 30.9°, 36.7°, 39.4°, 46.9°, and ∼48.7°, corresponding to lattice planes (110), (110), (111), (101), (200), (102, (200) and (220) of SrO PVP.37,38 These sharp peaks in the diffractogram indicate the crystalline nature of PVP-SrO NPs. The crystalline size calculated is about 20 nm, which corresponds to PVP-SrO with a cubic structure. The particle size was calculated by applying the Debye–Scherer formula as shown in equation,| |
 | (1) |
where λ is the wavelength of the X-ray radiation utilized (1.54056 Å), β is the corrected full width at half maximum, and θ is the Bragg angle. K is a constant that is typically assumed to be unity. The diffraction pattern of X-rays displays the crystalline nature of the nanoparticles. The database (JCPDS file no. 6-520)37 coincides with the diffraction peaks, which confirms the successful synthesis of PVP functionalized SrO NPs.
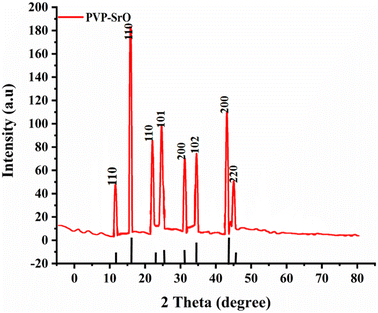 |
| | Fig. 4 XRD patterns of PVP-SrO nanostructures. | |
SEM and morphological characteristics
The SEM images of synthesized PVP-SrO NPs reveal fascinating structural features. At low and high resolution, as shown in Fig. 5a and b, the SrO nanoparticles exhibit a small nano beads-like structure. The SEM image shows slight agglomeration of the synthesized particles which is attributed to the functionalization of PVP polymer at high temperatures.34 The distinct morphology is very interesting since it indicates enhanced surface area and offers more active sites which improve electro-analytical applications, and enhance the sensing activity because the porous nature allows the greater interaction between PVP-SrO and active groups of VNB. Moreover, the slightly rough and interconnected pores in the nanobeads provide pathway for efficient diffusion of electroactive groups of VNB to the active site of PVP-SrO, and ensuring a reliable response for VNB.39 Due to these surface characteristics of the nanosensors, they interact more effectively with analytes, thereby promoting redox reactions. Generally, SEM provides valuable morphological and distinct structural characteristics of the synthesized NPs, which possess promising potential to improve redox processes and their practical uses.
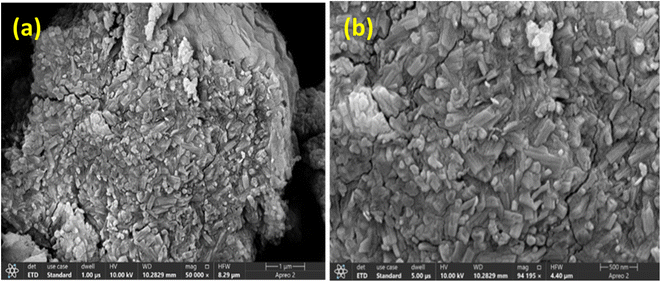 |
| | Fig. 5 FESEM PVP-SrO nanostructures at (a) low and (b) high resolution. | |
Energy dispersive spectroscopy (EDS) analysis
The EDS analysis, is an important technique to confirm the existence of specific elements in the sample. The EDS analysis was performed to know the elemental composition of PVP functionalized SrO NPs. The EDS spectrum of PVP-SrO shown in Fig. 6 indicates that the strontium (Sr), oxygen (O), and carbon (C) are present in the sample. It is determined from the EDS data that the percentages of the major elements, were found to be approximately 68.3%, 23%, and 8.1%, which is good in accord with the predicted atomic ratio. In addition to these elements, it also confirms the presence of other elements in the sample. These elements result from the functionalizing agent that was used during the synthesis of NPs, which in this instance is PVP. PVP is composed of the elements carbon (C), nitrogen (N), and oxygen (O). The presence of carbon confirms the successful capping of PVP with SrO. This inclusive EDS characterization confirms the presence of the capping agent in the sample and the successful synthesis of SrO NPs with the desired composition. These results offer a valuable understanding of the structure and composition of the synthesized NPs, which is essential for electroanalytical applications.
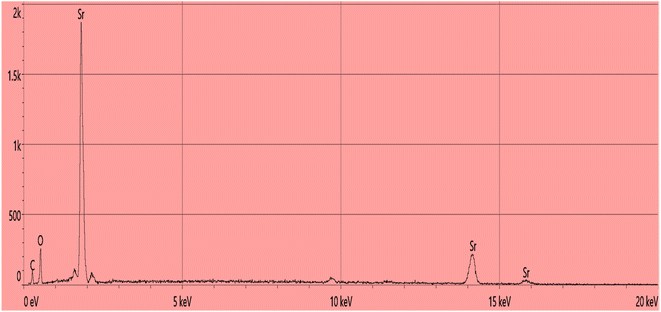 |
| | Fig. 6 EDX spectrum of PVP-SrO nanostructures. | |
Electrochemical characterization of bare and modified electrodes
The electrochemical characterization involved using electro-impedance spectroscopy (EIS) and cyclic voltammetry (CV), employing 5 mM [Fe(CN)]3−/4− and 0.1 M potassium chloride solutions as a redox probes to study the interfacial properties of both modified and bare electrodes.40 EIS is useful for analyzing the properties of various chemically modified electrodes such as conductivity and electron transfer resistance (Rct) ability.17 The Rct value of each electrode corresponds directly to the diameter of the semicircle, while the linear portion in the low-frequency region indicates the diffusion processes involved.41 The resistivity values of the bare and modified electrode are obtained by using Randles equivalent electrical diagram: Rs CPE (Rct − Zw), and the obtained Nyquist plots for the bare electrode and PVP-SrO modified GCEs are shown in Fig. 7a. The wider semicircle diameter and highest Rct value were found for bare GCE (2446 Ω), suggesting that bare GCE has low electron transfer efficacy and low conductivity. Conversely, the PVP-SrO modified electrode has the lowest Rct value (960.4 Ω) and the narrower semicircular diameter, indicating that the modified PVP-SrO has high conductivity and good electron transfer efficacy. The modified and the bare electrodes' active surface areas were calculated using Randles–Sevčík equation. “Ip (μA) = 2.69 × 10⁵ × n3/2AD1/2ν1/2C.” where, Ip is the peak current (measured in amperes, A), n is the number of electrons involved in redox reaction (dimensionless), A is the area of an electrode measured in square centimeters (cm2), D is the diffusion coefficient of electroactive species measured in square centimeters per second (cm2 s−1), C is the concentration of electroactive species measured in moles per centimeter (mol cm−3) and ν is the scan rate of potential sweep measured in (V s−1). The bare GCE's active surface area was found to be 0.0419 mm2 while the modified electrode was calculated to be 0.0471 mm2. The cyclic voltammogram indicates a greater current response for the modified electrode in comparison to the bare electrode as shown in Fig. 7b.
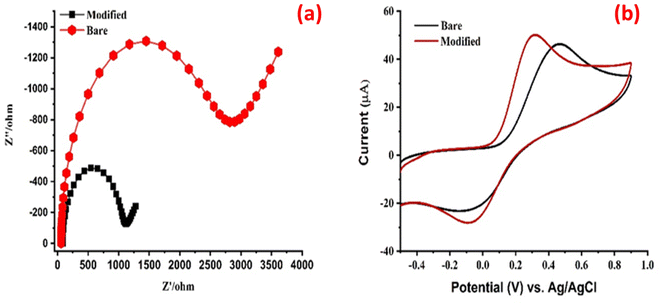 |
| | Fig. 7 (a) EIS and (b) CV response PVP-SrO modified GCEs with 5.0 mM [Fe (CN)6]3−/4− and 0.1 M KCl redox probe solution. | |
Electrochemical behavior of vinblastine on bare and modified electrodes
The CV technique was employed to verify the electrochemical response of the PVP-SrO/GCE sensor towards the oxidation of VNB. A possible oxidation reaction mechanism of VNB for bare and modified electrodes is shown in Fig. 8. The voltammograms were optimized with a 50.0 mV s−1 scan rate across the −0.4 to +1.6 V potential range. In the presence of VNB, bare GCE showed no response. The voltammogram shows a rise in current for the modified electrode as compared to the bare electrode. This observed rise in detection current indicates the significant interaction between PVP-SrO/GCE, with the active groups of VNB which facilitates rapid and easy electron flow from VNB to the surface of the electrode. The increase in oxidation peak for VNB is the result of GCE being modified with PVP-SrO NPs which provide tremendous redox properties in comparison to bare GCE. Meanwhile, a higher oxidation current response for the modified electrode shifts the potential towards more positive values, revealing more potential in excess compared to the bare electrode. Two electron and one proton exchanges were observed to occur on the surface of the PVP-SrO electrode in BRB of pH 5.0. The proposed mechanism for electrochemical oxidation of VNB consists of a series of steps. Each modified electrode was tested multiple times to confirm the strong catalytic capability and stability of the sensor for the oxidation of VNB and the synthesized sensor consistently demonstrated the best results each time. Therefore, this material was selected to optimize all the parameters.
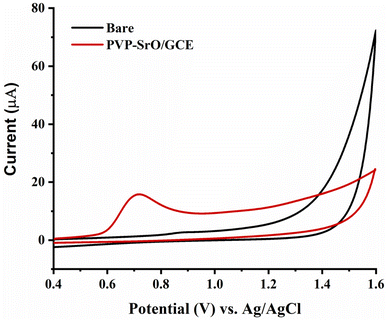 |
| | Fig. 8 CV response of PVP-SrO/GCE and Bare GCE in 20.0 μM of VNB in 0.1 M BRB of pH 5.0. | |
Effect of supporting electrolytes
The oxidation of VNB is highly dependent on the behavior of the electrolyte. The electrochemical behavior of VNB was further optimized in borate buffer (pH 8.0), phosphate buffer (pH 7.0), BR buffer (pH 5.0), and sodium hydroxide (pH 12.0). The results show the variation in peak current. The PVP-SrO/GCE in BR buffer shows the maximum peak current response for VNB as compared to borate and phosphate buffer. As shown in Fig. 9a, when the voltammograms studied in detail, the oxidation peaks found to be symmetrical and more sensitive in BRB (pH 5.0). The shift in the peak potential towards a more negative value was observed as the pH increased. The Fig. 9b demonstrates the process of VNB oxidation on the PVP-SrO/GCE electrode. The relationship between BRB pH and Ep resulted in an oxidation current of VNB around +0.75 V. This observation suggests that the electrochemical process of VNB is most likely to be involved in proton transfer. Consequently, for further study, BRB was carefully selected as a supporting electrolyte. Afterward, in the next step, the efficacy of the modified GCE was evaluated for further detection of vinblastine sulfates.
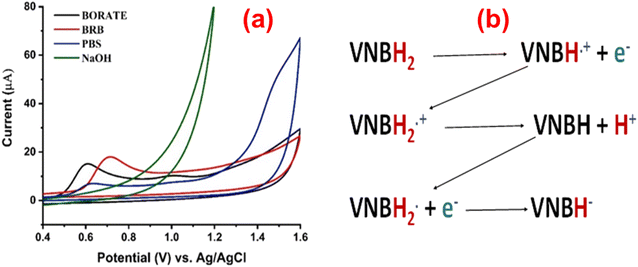 |
| | Fig. 9 (a). Impact of supporting electrolytes of varied pH values on Ipa of 20.0 μM VNB. (b) Oxidation process of VNB on the PVP-SrO/GCE electrode. | |
pH study of vinblastin sulfate
The response of cyclic voltammetry was measured in various pH solutions of the supporting electrolyte (BR buffer). The results depict that the current depends upon the pH of the electrolyte. Furthermore, the modified electrode shows irregular behavior in electrolyte solutions with different pH in the range of 2 to 8. As demonstrated in Fig. 10, as pH rises to 5, there is an increase in peak current across the pH range from 2 to 5. After pH 5 the peak current decreases. The decrease in peak current infers a variant oxidation potential of the modified GCE. This trend can be explained by the weak electrochemical oxidation of VNB sulfate at pH > 5.0, which causes poor interaction between the neutral and basic forms of VNB sulfate. VNB sulfate is a weak base and is more ionized at pH 5. BRB in the range of 2.0–5.0 allows VNB sulfate to exist in its more ionized form, which enhances its electrochemical activity. At a pH of 5, the highest current drift was observed in the solution of electrolyte. For further optimization, this pH value was chosen.
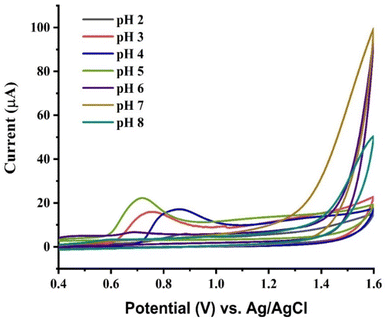 |
| | Fig. 10 CV response of PVP-SrO/GCE against 0.01 μM VNB in 0.1 M BRB of different pH ranges from 2.0–8.0. | |
Effect of scan rate
The electrochemical behavior of PVP-SrO/GCE for the detection of VNB at varied scan rates (ν) is shown in Fig. 11. CV at several scans were taken to verify whether the oxidation of VNB on the electrode surface is caused by ion adsorption or by a diffusion-controlled mechanism. The findings demonstrate that the square root of the scan rate is directly correlated with the oxidation of VNB for various scans in the range of 10 to 100 mV s−1. As shown in Fig. 11a current rises as the scan rate increases, and there is a strong linear correlation between peak current and ν1/2 (the square root of the scan rate) for the oxidation of VNB, the regression or Rendles–Sevcik equation is shown in eqn (2),| | |
ip = (2.69 × 10⁵)n3/2ACD1)/2ν1)/2
| (2) |
where ip represents the peak current, n denotes the number of electrons involved in the reaction, A is the active surface area, C stands for the concentration of [Fe(CN)6]3−/4−, D represents the diffusion coefficient of [Fe(CN)6]3−/4− (with D = 7.60 × 10⁻⁶ cm2 s−1), and ν indicates the scan rate, indicating the oxidation process of 20.0 μM vinblastine sulfate in PVP-SrO NPs/GCE. The results in Fig. 11b show that the process occurring on the surface of the electrode is diffusion-controlled with regression coefficient R2 = 0.997.
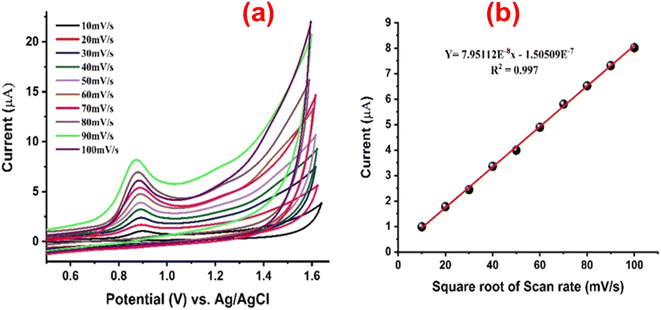 |
| | Fig. 11 (a) CV response of PVP-SrO/GCE to 20.0 μM VNB in 0.1 M BRB (pH 5.0) at different scan rates from 10.0 to 100 mV s−1. (b) A linear correlation plot of oxidation peak current against the square root of scan rate, showing an R2 value of 0.997. | |
Analytical parameters of VNB
To observe the analytical parameters of the prepared, calibration was performed. The calibration is a typical technique for finding unknown concentrations of samples by comparing the values of known concentrations of samples. It is defined by the plot of concentration vs. current. Calibration curve graphs can be utilized to define the linear detection range and determine both the limit of detection (LOD) and the limit of quantification (LOQ). The DPV response was examined to ascertain the sensitivity of PVP-SrO/GCE for calibration at various concentrations of VNB. DPV was chosen for calibration because it is more sensitive than cyclic voltammetry, square wave voltammetry, and linear swift voltammetry. Due to its relatively short pulse time and differential nature, direct analysis at the ppb (parts per billion) level is possible. The measured currents rise due to their short pulse time, while the background processes discriminate against differential measurement.42 The DPV response was taken within the potential range of 0.6–1.0 V. The optimized DPV parameters are pulse width 0.05 s, amplitude of 0.05 V, and pulse period 0.1 s. The linearity plot illustrates the well-defined oxidation behavior of VNB observed within the linear detection range of 0.05 to 60.0 μM. Fig. 12a shows the PVP-SrO/GCE DPV response to the different VNB drug concentrations. While Fig. 12b shows a plot between concentration and current. The coefficient of determination was found to be 0.997. The limits of detection (LOD) and quantification (LOQ) were determined using the signal-to-noise ratio of the modified electrode. The measured values for LOD and LOQ were 0.005 μM and 0.017 μM, respectively.
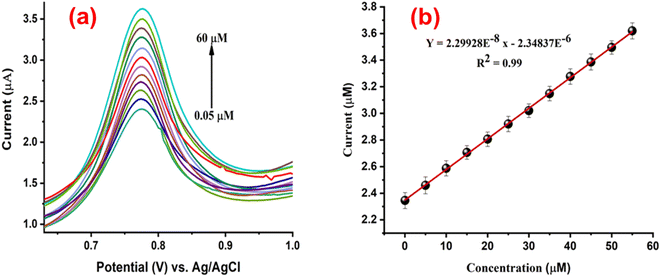 |
| | Fig. 12 (a) DPV response of PVP-SrO/GCE against various VNB concentrations in 0.1 BRB (pH 5.0), ranging between 0.05 and 60.0 μM. (b) The linear plot corresponding to oxidation peak currents to the various concentrations of VNB, with R2 = 0.99. | |
The present work on the electrochemical determination of VNB was compared with previously published research as shown in Table 1. The table indicates that our PVP-SrO-based GCE sensor demonstrates comparable or superior performance compared to other sensors in terms of the wide range of detection, low detection limit, simple synthesis procedure, economical capabilities, and simple use of a metal oxide instead of other complex materials. Therefore, we can say that PVP-SrO/GCE can be a promising candidate to detect VNB.
Table 1 Comparison of the analytical capabilities of the developed PVP-SrO/GCE sensor for vinblastine sulfate with prior research
| Modified electrode |
Linear range (μM) |
LOD (μM) |
References |
| Portable solid-state sensor |
2.99–0.01 |
2.88 |
43 |
| BDDNPs/GCE |
0.011–0.99 |
0.3 |
2 |
| PVP-SrO/GCE |
0.05–60.0 |
0.005 |
This work |
Repeatability
To examine the regeneration potential and repeatability of the modified electrode, the PVP-SrO/GCE CV response was recorded twenty times. Each subsequent scan was conducted in 20 μM VNB in pH 5 BR buffer. Extremely minute differences in the projected current response were observed. The % RSD calculated is about 2.02, less than 5% indicating the modified GCE with PVP-SrO have an excellent regeneration potential. The voltammogram generated is shown in Fig. 13.
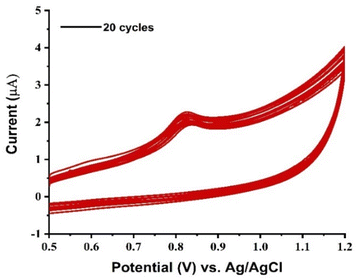 |
| | Fig. 13 Repeatability of the proposed sensor. | |
Selectivity of the modified electrode
The PVP-functionalized SrO sensor is designed to detect VNB drug at trace levels in natural resources. As the samples originate from hospital sources and encompass diverse other anti-cancer drugs that are used in combination chemotherapy, the modified electrode needs to be highly selective. To assess the selectivity of the developed sensor, various medications, and metal ions were added to the VNB solution. These medications and metal ions include zometa, methotrexate, cisplatin, fluorouracil, duticin, carboplatin, mitoxantrone, zoledronic acid, cyclophosphamide, Zn2+, Ca2+, Ni2+, and Co2+. Twice, the concentrations of these drugs and ions were introduced into the voltammetric cell which contained (20.0 μM) VNB solution diluted with 10 mL BR buffer. The PVP-SrO/GCE was exposed to an interferent that contains the solution of VNB and the study was conducted at optimum conditions. The results indicated that excess concentration of these medications and ions did not influence the response of VNB sulfate. Thus, it can be inferred that the maximum peak current is unaffected by the concentration of supposed interferences of VNB as shown in Fig. 14. The RSD value obtained for interference is 3.85 which are below ∼5%. These findings support the selective behavior of PVP-SrO/GCE for the detection of VNB and imply that the proposed sensor used for quantifying VNB was not significantly affected by the presence of interfering species.
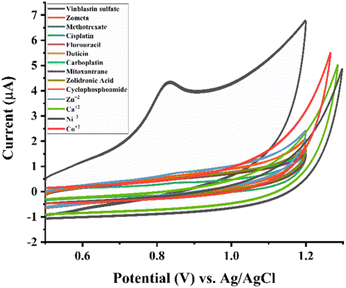 |
| | Fig. 14 Effect of interfering substances/species on the Ipa response of 20.0 μM VNB in 0.1 M BRB (pH 5.0). | |
Stability
To check the reliability and long-term use of the fabricated sensor, the PVP-SrO/GCE stability of the sensor was investigated. At seven-day intervals, the electrode was exposed to cyclic voltammetry under ambient conditions in the presence of a 20 μM VNB solution and no perceptible alteration in the Ipa response of VNB was observed. The response profile was again obtained every day consecutively for one month under similar experimental conditions. It was observed that the sensitivity of the electrode dropped to a very small extent after a month and maintained its sensitivity of approximately 97.6%. However Ipa response for VNB after a month, was seen to be reduced. As a result, the whole performance of the PVP-SrO/GCE sensor for one month was extremely good. Hence, it is concluded that the sensor can be utilized within a month with minimum current drift and is highly reusable.
Analysis of pharmaceutical samples
The practical significance or real-world application of the PVP-SrO/GCE for the detection of VNB was illustrated in viable sample preparation. An adequate volume of serum was obtained from the Nuclear Institute of Medicine and Radiotherapy (NIMRA). 2 mL of clear supernatant solution was obtained and diluted with 8 mL BR buffer solution. A 20 μM standard solution was spiked into the mixture three times. The procedure was repeated for each serum sample solution, and processed on DPV using the conventional standard addition procedure. The DPV response recorded over the potential range of 0.65 to 1.0 V.
Recovery and accuracy
To investigate the real-world applicability of the fabricated PVP-SrO/GCE sensor in practical applications, five different serum samples containing VNB were analyzed using the conventional standard addition method. The samples of serum were provided by the Nuclear Institute of Medicine and Radiotherapy (NIMRA), Jamshoro, with informed consent. Following the previously described sample preparation and appropriate dilution procedures, the calibration was used to determine VNB concentration which was calculated by averaging three repeated measurements. Table 2 represents the validation of the proposed method. The results revealed that the percent recovery ranged from 96 to 103%. The relative standard deviation of each run was calculated by taking mean and standard deviation of triplicate measurements as shown in equation.| |
 | (3) |
Table 2 Detection of VNB in blood serum using PVP-SrO/GCE sensor
| Serum |
Spiked |
Detected (μM) |
RSD |
Recovery% |
| Sample 1 |
0 |
1.78 |
1.32 |
0 |
| |
5 |
6.88 |
2.18 |
102 |
| |
10 |
16.68 |
4.50 |
98 |
| |
15 |
31.68 |
1.59 |
103 |
| Sample 2 |
0 |
1.48 |
1.47 |
0 |
| |
5 |
6.48 |
3.23 |
100 |
| |
10 |
16.48 |
1.14 |
98 |
| |
15 |
31.38 |
4.66 |
99 |
| Sample 3 |
0 |
1.69 |
3.49 |
0 |
| |
5 |
6.49 |
1.54 |
96 |
| |
10 |
16.29 |
1.32 |
98 |
| |
15 |
31.29 |
3.49 |
100 |
| Sample 4 |
0 |
2.69 |
3.72 |
0 |
| |
5 |
7.36 |
1.34 |
98 |
| |
10 |
17.16 |
1.66 |
98 |
| |
15 |
31.96 |
1.51 |
98 |
| Sample 5 |
0 |
3.26 |
3.07 |
0 |
| |
5 |
8.36 |
1.18 |
102 |
| |
10 |
18.26 |
2.6 |
99 |
| |
15 |
33.76 |
3.17 |
103 |
The RSD was found between 1.14 to 4.66%, which demonstrated the accuracy and precision of the modified electrode.
Conclusion
In this study, PVP-functionalized SrO NPs were successfully synthesized and characterized using advanced analytical techniques. Moreover, the glassy carbon electrode was modified using PVP-SrO NPs to fabricate an electrochemical sensor for detecting the anticancer drug VNB sulfate. The sensor demonstrated excellent detection performance with a low LOD up to 0.005 μM and a LOQ up to 0.017 μM, with a linear dynamic range of 0.005–60.0 μM. Additionally, the sensor manifested excellent selectivity, stability, and sensitivity under optimal conditions. The accuracy of the fabricated sensor was confirmed by testing real samples. These results confirmed the reliability and efficiency of the sensor in a real array. Overall, this research presents a novel and promising method to effectively detect VNB. The proposed sensor shows significant potential for usage and applications in environmental monitoring.
Conflicts of interest
There are no conflicts of interest.
Acknowledgements
Authors are highly thankful to NCEAC, University of Sindh, Jamshoro for supporting this research work and we also acknowledge the Nuclear Institute of Medicine and Radiotherapy, Jamshoro for providing us blood samples.
References
- H. Sung, J. Ferlay, R. L. Siegel, M. Laversanne, I. Soerjomataram, A. Jemal and F. Bray, Ca - Cancer J. Clin., 2021, 71, 209–249 CrossRef PubMed.
- G. Önal, Diam. Relat. Mater., 2023, 133, 109699 CrossRef.
- H. Chandra, P. Kumari, E. Bontempi and S. Yadav, Biocatal. Agric. Biotechnol., 2020, 24, 101518 CrossRef.
- A. Gharabeiki, Ultrasound-Microbubble Combined Treatment with Vinca Alkaloids in Prostate Cancer Cells, Doctoral dissertation, Toronto Metropolitan University, 2021 Search PubMed.
- E. Haghshenas, T. Madrakian, A. Afkhami and H. Saify Nabiabad, Anal. Bioanal. Chem., 2017, 409, 5269–5278 CrossRef CAS PubMed.
- S. Witta, K. P. Collins, D. A. Ramirez, J. D. Mannheimer, L. A. Wittenburg and D. L. Gustafson, Pharmacol. Res. Perspect., 2023, 11, e01052 CrossRef CAS PubMed.
- A. Yadav, E. R. Rene, M. Sharma, V. Kumar, M. K. Mandal and K. K. Dubey, Curr. Pollut. Rep., 2023, 9, 391–409 CrossRef CAS.
- Y. J. Li, K. Yang, X. M. Long, G. Xiao, S. J. Huang, Z. Y. Zeng and Z. L. Sun, Hum. Exp. Toxicol., 2022, 41, 09603271211062857 CAS.
- R. A. Rahim, N. H. Ahmad, K. M. Al Azzam and I. Mat, Adv. Pharmaceut. Bull., 2018, 8, 157 CrossRef PubMed.
- R. A. R. Rohanizah Abdul Rahim, N. H. A. Nor Hazwani Ahmad, K. Al-Azzam and I. M. Ishak, Adv. Pharm. Bull., 2018, 8, 157–161 CrossRef PubMed.
- H. A. Jeewantha, S. A. Ivanovich and K. P. Mihailovich, Int. J. Pharm. Pharmaceut. Sci., 2017, 9, 78–86 CAS.
- M. Gupta, D. Singh, A. Tripathi, R. Pandey, R. Verma, S. Singh, A. Shasany and S. P. S. Khanuja, J. Chromatogr. Sci., 2005, 43, 450–453 CAS.
- V. C. Kumari, S. M. Patil, R. Ramu, P. S. Shirahatti, N. Kumar, B. Sowmya, C. Egbuna, C. Z. Uche and K. C. Patrick-Iwuanyanwu, in Analytical techniques in biosciences, Elsevier, 2022, pp. 73–101 Search PubMed.
- C. F Poole, J. Chromatogr. A, 2004, 1037, 49–82 CrossRef PubMed.
- M. R. Siddiqui, Z. A. AlOthman and N. Rahman, Arab. J. Chem., 2017, 10, S1409–S1421 CrossRef CAS.
- M. R. Siddiqui, Z. A. AlOthman and N. Rahman, Arab. J. Chem., 2017, 10, S1409–S1421 CrossRef CAS.
- S. A. Balogun and O. E. Fayemi, Nanomaterials, 2022, 12, 1876 CrossRef CAS PubMed.
- C. Zhu, G. Yang, H. Li, D. Du and Y. Lin, Anal. Chem., 2015, 87, 230–249 CrossRef CAS PubMed.
- M. Pourmadadi, A. Shamsabadipour, A. Aslani, M. M. Eshaghi, A. Rahdar and S. Pandey, Inorg. Chem. Commun., 2023, 152, 110714 CrossRef CAS.
- A. Hyder, J. A. Buledi, R. Memon, A. Qureshi, J. H. Niazi, A. R. Solangi, S. Memon, A. A. Memon and K. H. Thebo, Diam. Relat. Mater., 2023, 139, 110357 CrossRef CAS.
- M. M. Galal and A. S. Saad, RSC Adv., 2020, 10, 42699–42705 RSC.
- G. Önal, Diamond Relat. Mater., 2023, 133, 109699 CrossRef.
- Y. Zhang, J. Zheng and M. Guo, Chin. J. Chem., 2016, 34, 1268–1276 CrossRef CAS.
- S. Mukherjee and M. Mishra, Nanotechnol. Environ. Eng., 2021, 6, 25 CrossRef CAS.
- K. Kusuma, M. Manju, C. Ravikumar, N. Raghavendra, T. N. Kumar, M. Anilkumar, H. Nagaswarupa, T. S. Shekhar, H. A. Murthy and K. Aravind, Sensors Int., 2023, 4, 100231 CrossRef.
- P. Dhyani, C. Quispe, E. Sharma, A. Bahukhandi, P. Sati, D. C. Attri, A. Szopa, J. Sharifi-Rad, A. O. Docea, I. Mardare, D. Calina and W. C. Cho, Cancer Cell Int., 2022, 22, 206 CrossRef CAS PubMed.
- K. M. Koczkur, S. Mourdikoudis, L. Polavarapu and S. E Skrabalak, Dalton Trans., 2015, 44, 17883–17905 RSC.
- H. Tahir, M. Saad, M. Latif, S. T. Hyder and R. Ahmed, Nanochem. Res., 2024, 9, 19–27 CAS.
- R. Zein, I. Alghoraibi, C. Soukkarieh, M. T. Ismail and A. Alahmad, Micromachines, 2022, 13, 777 CrossRef PubMed.
- G. Anandhakumari, P. Jayabal, A. Balasankar, S. Ramasundaram, T. H. Oh, K. Aruchamy, P. Kallem and V. Polisetti, Heliyon, 2023, 9(10), e20824 CrossRef CAS PubMed.
- Y. Tian, P. Zhang, K. Zhao, Z. Du and T. Zhao, Sensors, 2020, 20, 1394 CrossRef CAS PubMed.
- A. A. Gungor, H. Nadaroglu and D. D. Gultekin, Chem. Sci. Int. J., 2019, 26, 1–7 CrossRef.
- R. Ortega-Córdova, K. Sánchez-Carillo, S. Carrasco-Saavedra, G. Ramírez-García, M. G. Pérez-García, J. F. A. Soltero-Martínez and J. D. Mota-Morales, RSC Appl. Interfaces, 2024, 1, 600–611 RSC.
- M. Rafeeq, Orient. J. Chem., 2021, 37(1), 177–180 Search PubMed.
- F. Kocan and U. Hicsonmez, J. Dispersion Sci. Technol., 2020, 41, 1–10 CrossRef.
- V. Adimule, S. S. Nandi, B. Yallur, D. Bhowmik and A. H. Jagadeesha, J. Fluoresc., 2021, 31, 487–499 CrossRef CAS PubMed.
- R. Sowmiyanarayan and J. Santhanalakshmi, Nano Vision, 2012, 2, 9–17 Search PubMed.
- N. Shahraini and M. H. Entezari, Mater. Sci. Eng. B, 2022, 286, 116060 CrossRef CAS.
- Z. Fallah, E. N. Zare, M. Ghomi, F. Ahmadijokani, M. Amini, M. Tajbakhsh, M. Arjmand, G. Sharma, H. Ali and A. Ahmad, Chemosphere, 2021, 275, 130055 CrossRef CAS PubMed.
- M. M. Foroughi, S. Jahani, S. Rashidi, O. Tayari and M. Moradalizadeh, Mater. Chem. Phys., 2024, 315, 128893 CrossRef CAS.
- V. Vinothkumar, A. Sangili, S.-M. Chen, P. Veerakumar and K.-C. Lin, New J. Chem., 2020, 44, 2821–2832 RSC.
- N. A. Bohari, S. Siddiquee, S. Saallah, M. Misson and S. E. Arshad, Cosmetics, 2021, 8, 17 CrossRef CAS.
- M.
M. Galal and A. S. Saad, RSC Adv., 2020, 10, 42699–42705 RSC.
|
| This journal is © The Royal Society of Chemistry 2024 |
Click here to see how this site uses Cookies. View our privacy policy here.  Open Access Article
 *a,
Nahjul Batoolb,
Nadir H. Khanda,
Manaza Kamboha,
Arfana Malahb,
Jamil A. Buledia and
Mir Mehran Khana
![[double bond, length as m-dash]](https://www.rsc.org/images/entities/char_e001.gif) O group of pyrrolidone. Additional important bands include bands resulting from C–N stretching vibrations of PVP at 1293 cm−1, and an absorption peak at 1430 cm−1 caused by the CH band of PVP. The absorption peaks located around 2949 cm−1, 2894 cm−1, and the broad peak centered at around 3416 cm−1, are responsible for CH2 symmetric stretching, CH2 asymmetric stretching, and O–H symmetric stretching vibrational peaks respectively. PVP stretching band of the C–N
O group of pyrrolidone. Additional important bands include bands resulting from C–N stretching vibrations of PVP at 1293 cm−1, and an absorption peak at 1430 cm−1 caused by the CH band of PVP. The absorption peaks located around 2949 cm−1, 2894 cm−1, and the broad peak centered at around 3416 cm−1, are responsible for CH2 symmetric stretching, CH2 asymmetric stretching, and O–H symmetric stretching vibrational peaks respectively. PVP stretching band of the C–N![[double bond, length as m-dash]](https://www.rsc.org/images/entities/char_e001.gif) O bands is represented at 560 cm−1.34 Typical SrO NPs spectrum is shown in Fig. 3b. Bends at 848 cm−1 and 701 cm−1 indicate both symmetric and asymmetric stretching of Sr–O. The band at 1437 cm−1 indicates an O–H bend of H2O caused by the absorption of atmospheric moisture.35 The PVP-SrO FTIR spectra are shown in Fig. 3c. The peaks around 839 cm−1 and 704 cm−1 show symmetric and asymmetric stretching of Sr–O. Stretching bands at 1680 cm−1, 1434 cm−1, 1025 cm−1, 900 cm−1, 3612 cm−1 and 570 cm−1, due to C
O bands is represented at 560 cm−1.34 Typical SrO NPs spectrum is shown in Fig. 3b. Bends at 848 cm−1 and 701 cm−1 indicate both symmetric and asymmetric stretching of Sr–O. The band at 1437 cm−1 indicates an O–H bend of H2O caused by the absorption of atmospheric moisture.35 The PVP-SrO FTIR spectra are shown in Fig. 3c. The peaks around 839 cm−1 and 704 cm−1 show symmetric and asymmetric stretching of Sr–O. Stretching bands at 1680 cm−1, 1434 cm−1, 1025 cm−1, 900 cm−1, 3612 cm−1 and 570 cm−1, due to C![[double bond, length as m-dash]](https://www.rsc.org/images/entities/char_e001.gif) O, O–H, CH2 and C–C, R–NH and N–C
O, O–H, CH2 and C–C, R–NH and N–C![[double bond, length as m-dash]](https://www.rsc.org/images/entities/char_e001.gif) O corresponds to functional groups of PVP. The slight shift and decrease in intensity of peaks indicate the efficient production of PVP-functionalized SrO NPs.36
O corresponds to functional groups of PVP. The slight shift and decrease in intensity of peaks indicate the efficient production of PVP-functionalized SrO NPs.36


