DOI:
10.1039/D4RA06205A
(Paper)
RSC Adv., 2024,
14, 31398-31408
Luminescence properties of Bi3+/Sm3+ co-doped K3Gd5(PO4)6 phosphors for self-referencing optical thermometry†
Received
28th August 2024
, Accepted 27th September 2024
First published on 3rd October 2024
Abstract
Potassium gadolinium phosphates [K3Gd5(PO4)6] co-doped with Bi3+/Sm3+ phosphors were prepared by traditional solid-state method. Their structure, morphology, luminescence properties, energy transfer, temperature sensing performance and thermal stability have been systematically investigated. The emission and excitation spectra, as well as decay curves were recorded to study the luminescence mechanism. By co-doping Bi3+/Sm3+, white emission color can be obtained. In addition, the emission intensity ratios of Bi3+ and Sm3+ ions present excellent temperature sensing performance in a wide temperature range. The maximum relative sensitivities of K3Gd5(PO4)6 doped with Bi3+/Sm3+ can reach to 3.13% K−1. In addition, K3Gd5(PO4)6:Bi3+,Sm3+ phosphors exhibit high thermal stability of about 55.3% at 423 K compared to room temperature.
1. Introduction
White light-emitting diodes (WLEDs) have been regarded as a promising next generation lighting source due to their advantages of long operation lifetime, low power consumption, small size, good chemical stability, and environmental friendliness.1–6 The widely used method for fabricating w-LEDs is to combine a blue LED chip with a yellow YAG:Ce3+ phosphor. The major drawback of this method is the lack of red components, resulting in a poor color rendering index and a high correlated color temperature. Recently, another method based on the combination of UV LED chips with blue, green, and red phosphors has been developed. However, this method also suffers from some drawbacks, such as low efficiency (reabsorption between phosphor particles) and high expenses. Therefore, the method by coating single-phased tunable emission phosphors on the UV LED chips has been exploited, which has been an active research area for w-LEDs. In a single-phased phosphor, the tunable emission color, including white, can be obtained by energy transfer from the sensitizer to the activator, and a number of energy transfer systems have been reported, such as Ce3+–Eu2+,1 Eu2+–Mn2+,7 Bi3+–Eu3+,8 Ce3+–Tb3+,9 Eu2+–Mn2+–Tb3+,10 and Tm3+–Dy3+,11 etc.12–14 The rare earth ions are extensively investigated for the modification of luminescence color based on the energy transfer from host or sensitizers. Tunable emission color can be obtained by controlling the dopants of rare earth ions. As is well known, Sm3+ can be used as an orange-red emission dopant due to its intense 4G5/2 → 6HJ transitions. Bi3+ can be used as a sensitizer as well as an activator, which has strong absorption in the UV region. Taking into account of 3P1 → 1S0 emission of Bi3+ in the blue-green region, it is possible to achieve white emission by combining Bi3+ emission with Sm3+ emission in a single-phased phosphor.
As one of the basic physical quantities, temperature has an important influence on human daily life and industrial production. In recent years, optical thermometers have attracted wide attention due to their unique advantages of non-contact, fast response, high spatial resolution, and non-invasive operation. Various techniques have been used for the temperature sensing, such as emission intensity, fluorescence intensity ratio (FIR), lifetime, as well as bandwidth. In particularly, FIR technique is widely used because of its high accuracy and high resolution. Moreover, it can get rid of the influence of measurement conditions and high equipment and operational requirements. At present, most FIR techniques are based on the detection of two emissions which are from two thermal coupled levels (TCL) of single ions, such as Er3+(2H11/2/4S3/2),15 and Dy3+(4I5/2/4F9/2).16 Whereas, the narrow energy gap between TCL suffers from the drawbacks of low relative sensitivities and large overlap of two emissions. To overcome these drawbacks, the strategies based on the energy transfer or diversity in the thermal quenching behaviors of two luminescence centers have been proposed, such as Pr3+–Tb3+,17 Eu3+–Tb3+,18,19 Bi3+–Eu3+,20–22 and Eu3+–Dy3+.23 It is known that the emission bands of Bi3+ and Sm3+ are basically separated, and signal discrimination can be easily performed.24,25 Thus, Bi3+/Sm3+ co-doped materials have great potential application for temperature sensing.
In the present work, the luminescence properties of Bi3+/Sm3+ co-doped K3Gd5(PO4)6 (host abbreviated as KGP) phosphor is investigated. Tunable emission color can be realized by co-doping Bi3+ and Sm3+ ions. Meanwhile, Bi3+/Sm3+ co-doped KGP phosphors can be used for optical temperature sensor in a wide temperature range (44–182 K and 295–523 K) with maximum relative sensitivities of 3.13% K−1.
2. Experimental section
2.1 Synthesis of samples
A series of K3Gd5−x(PO4)6:xBi3+ (x = 0.05, 0.1, 0.15, 0.5, 1, 1.5, 2, where KGP:Bi3+ represents x = 0.05), K3Gd4.99(PO4)6:0.01Sm3+ (KGP:Sm3+), and K3Gd4.96(PO4)6:0.05Bi3+,0.01Sm3+ (KGP:Bi3+,Sm3+) phosphors were prepared by solid state method. Stoichiometric amount of K2CO3 (99.9%, Sigma), Gd2O3 (99.99%, Sigma), NH4H2PO4 (99.9%, Sigma), Bi2O3 (99.9%, Sigma), and Sm2O3 (99.99%, Sigma) were carefully weighed and ground thoroughly in an agate mortar with ethanol. The mixture was firstly heated at 873 K for 2 h. The obtained powder was thoroughly mixed in a second time and then heated at 1123 K for 5 h. After cooling down to the room temperature, the white powder was collected for the next investigation.
2.2 Characterization
The XRD patterns were recorded by Rigaku SmartLab X-ray diffractometer in the 2θ range from 10 to 70°. The diffuse reflectance spectra (DRS) were measured by a V-670 UV-Vis/NIR spectrophotometer and BaSO4 as a background reference. The morphology was studied by JSM-6700F field emission scanning electron microscopy. The emission spectra and decay curves were measured by 266 nm Nd:YAG laser. The excitation spectra were recorded by Quanta Master 300 fluorescence spectrometer equipped with high power Xenon flash lamp. The temperature was controlled by a closed cycle helium cryostat in the range of 11–295 K. The high temperature from 295 to 523 K was done by a home-made temperature control system.
3. Results and discussion
3.1 Crystal structure
Fig. 1(a) shows the XRD patterns of Bi3+ single doped and Bi3+/Sm3+ co-doped KGP phosphors. Fig. 1(b) and (c) shows the crystal structure of the KGP host, which forms monoclinic phase with space group C2/c. A three-dimensional Gd5(PO4)63− anionic framework is formed by Gd polyhedral and P tetrahedral, while K atoms occupy the tunnel along c axis. And there are three crystallographic Gd3+ sites, of which Gd1 and Gd3 are coordinated by eight O atoms and Gd2 is surrounded by nine O atoms. In Fig. 1(a), all the peaks match well with the ICSD standard card (No. 172528), and no trace of impurity phase can be observed, revealing the formation of the pure monoclinic C2/c phase. With the incorporation of Bi3+ and Sm3+ ions into host lattice, the crystal structure is not affected. This can be ascribed to the low doping concentration and similar radius of Bi3+ (1.17 Å for C.N. = 8), Sm3+ (1.079 Å for C.N. = 8, and 1.132 Å for C.N. = 9) with Gd3+ (1.053 Å for C.N. = 8, and 1.107 Å for C.N. = 9). The SEM image of Bi3+/Sm3+ co-doped KGP phosphor is shown in Fig. 2. The particles are in the size range of one to a few micrometers with smooth surface. EDS mapping of KGP:Bi3+,Sm3+ phosphor is shown in Fig. S1.† Due to the low doping concentration, Bi and Sm elements cannot be detected.
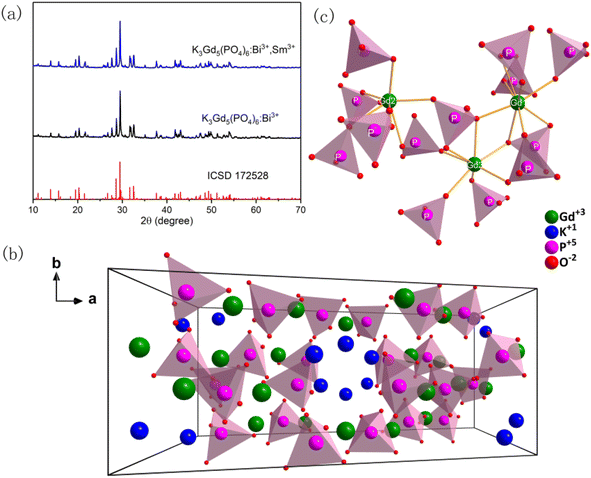 |
| | Fig. 1 (a) XRD patterns of KGP:Bi3+ and KGP:Bi3+,Eu3+ phosphors; (b) and (c) crystal structure of KGP host.26 | |
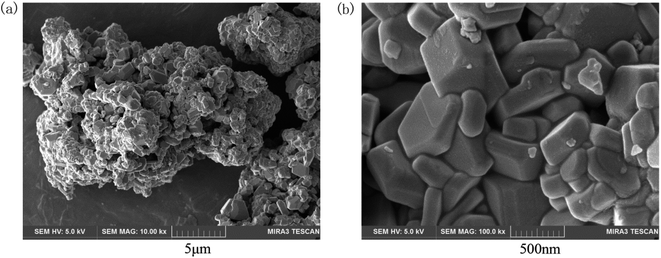 |
| | Fig. 2 SEM images of KGP:Bi3+,Sm3+ phosphor. | |
3.2 Luminescence properties
3.2.1 Photoluminescence characteristics KGP:Bi3+ phosphor. Fig. 3(a) shows the DRS of KGP host and KGP:Bi3+ phosphor in the range from 200 to 1300 nm. In the spectrum of KGP host, a broad absorption band from 200 to 320 nm can be observed, which can be ascribed to the band to band transition of host lattice.27,28 An absorption peak at 312 nm can also be found, owing to the 8S7/2 → 6P7/2 transition of Gd3+ ions.29 When the doping of Bi3+, a new absorption band centered at 255 nm appears, which can be attributed to the 1S0 → 1P1 transition of Bi3+ ions.30
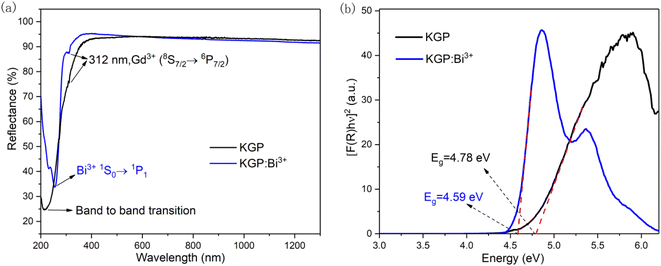 |
| | Fig. 3 (a) DRS of un-doped KGP and KGP:Bi3+ phosphors; and (b) calculated band gaps of un-doped KGP and KGP:Bi3+ phosphors by DRS data. | |
The band gaps of the un-doped KGP and KGP:Bi3+ phosphors were calculated according to the Kubelka–Munk theory31 by using DRS data. The DRS can be transformed into absorption spectra by the following equation:
| |
 | (1) |
where
R is the diffuse reflectance of the sample,
K is the absorption coefficient, and
S is the scattering coefficient.
On the basis of Tauc relation, the relation between band gap (Eg) and linear absorption coefficient (α) for direct band gap can be expressed as:
where,
hv is the photon energy and
C is the proportionality constant. Considering that the scattering coefficient
S as a constant with respect to wavelength, and combining
eqn (1) and
(2), it can be derived that:
| | |
[F(R)hν]2 = C(hν − Eg)
| (3) |
From the plot of [F(R)hv]2 versus hv, the value of Eg was acquired by extrapolating the linear fitted regions to [F(R)hv]2 = 0, as shown in Fig. 3(b). The band gaps were calculated to be 4.78 and 4.59 eV for KGP and KGP:Bi3+. The values are close to K3Gd(PO4)2 (4.8 eV) which has similar structure.32 According to the literature, the doping of luminescent centers can change the band gap energy more or less.27 In this work, the doping of Bi3+ can decrease the band gap energy.
The emission spectrum of KGP:Bi3+ sample under excitation at 266 nm is shown in Fig. 4(a). The sharp emission peaks at 312 and 624 nm are due to the 6P7/2 → 8S7/2 transition of Gd3+ ions and its second harmonics, respectively. The broad band from 350 to 600 nm is attributed to the 3P1 → 1S0 transition of Bi3+ ions. Fig. 4(b) shows the normalized excitation spectra of KGP:Bi3+ by monitoring the emissions at 410, 445, and 500 nm. Only one excitation band centered at 252 nm ranging from 220 to 280 nm can be found, which is due to the 1S0 → 1P1 transition of Bi3+ ion, and consistent with the absorption band in DRS.33 Fig. 4(c) shows the emission spectra of KGP:xBi3+ (x = 0.05–2) phosphors. With increasing Bi3+ concentration, the emission intensity increases firstly and then decreases, reaching the maximum at x = 0.1. The integral emission intensities of Bi3+ ions are shown in Fig. 4(d). It is known that energy transfer between Bi3+ ions leads to the concentration quenching. To confirm the energy transfer mechanism, the critical distance Rc was calculated by following equation34
| |
 | (4) |
where
V is the cell volume of host and is 1998.48 Å
3 for K
3Gd
5(PO
4)
6.
Xc is the critical concentration of dopant (Bi
3+) at which the maximum emission intensity is obtained and is 0.1.
N is the number of sites available for activators in unit cell and is 4 for K
3Gd
5(PO
4)
6. In this case, the
Rc is determined to be 21.21 Å. This value is greater than the shortest distance between the Gd
3+ ions of 4.10 Å and larger than 5–8 Å, indicating that exchange interaction is not the main mechanism of concentration quenching. Therefore, the electric multipolar interactions dominate the non-radiative concentration quenching between Bi
3+ ions. Based on the Dexter theory,
35 the type of multipolar interaction can be determined by
| |
 | (5) |
where
I is emission intensity,
x is doping concentration (Bi
3+) beyond the optimal value,
β is constant, and
θ represents the type of multipolar interaction (where
θ = 6, 8, and 10 corresponding to the dipole–dipole, dipole–quadrupole, and quadrupole–quadrupole interactions, respectively). By plotting the relationship between
x and
I/
x in the log–log version, the slope value (−
θ/3) of −1.67 can be obtained, as shown in the inset of
Fig. 4(d). As a consequence, the value of
θ is determined to be 5.01, demonstrating that the dipole–dipole interaction is responsible for the concentration quenching between Bi
3+ ions.
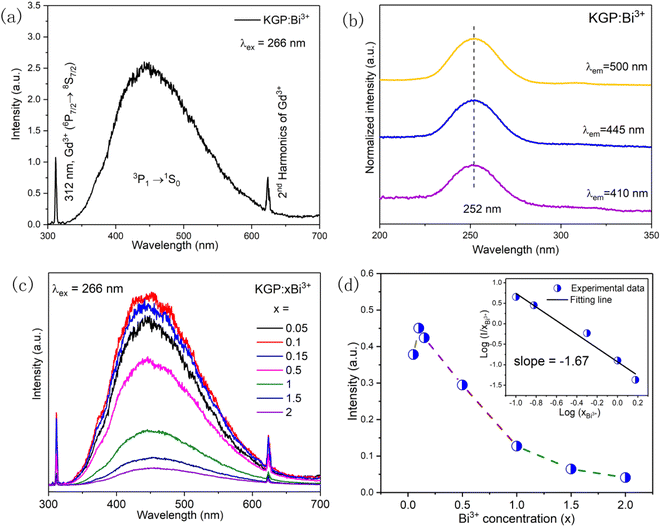 |
| | Fig. 4 (a) Emission spectrum of KGP:Bi3+ sample under 266 nm excitation; (b) excitation spectra of KGP:Bi3+ sample by monitoring at 410, 445, and 500 nm; (c) emission spectra of KGP:xBi3+ (x = 0.05, 0.1, 0.15, 0.5, 1, 1.5, 2) samples under 266 nm excitation; and (d) integral emission intensity of Bi3+ ions at different doping concentration. Inset shows the correlation between log(I/x) and log(x). | |
The decay curves of Bi3+ ions were recorded by monitoring at 445 nm upon the excitation at 266 nm, as shown in Fig. 5. At low doping concentration, the decay curves are single exponential. With increasing Bi3+ concentration, the decay curve deviates from the single exponential characteristic. In this case, the decay times were calculated by the following equation:36
| |
 | (6) |
where
I(
t) represents the emission intensity at time
t. As shown in
Fig. 5, the calculated decay time was reduced from 0.446 to 0.034 μs with increasing Bi
3+ concentration from
x = 0.05 to
x = 2.
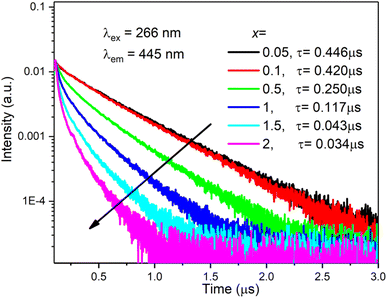 |
| | Fig. 5 Decay curves of Bi3+ ions by monitoring at 445 nm with 266 nm excitation. | |
Fig. 6(a) shows the temperature dependent emission spectra of KGP:Bi3+ phosphor in the range of 12 to 294 K. At 12 K, strong Gd3+ emission and relatively weak Bi3+ emission can be observed, indicating that both host lattice and Bi3+ ions can be excited at 266 nm. With the increase of temperature, Bi3+ emission intensity shows temperature dependency, as shown in Fig. 6(b). In the 53–204 K temperature range, the enhancement in Bi3+ emission intensity at the expense of the Gd3+ emission is a result of the competition between two emitting centers.37 The quenching of the Bi3+ emission above 204 K is presumably related to the thermal quenching process. Fig. 6(c) displays the decay curves of Bi3+ ions. At low temperature, decay kinetics of the Bi3+ emission is more complicated than room temperature. Therefore, the lifetime values are calculated based on eqn (6) and displayed in Fig. 6(d). With the increase of temperature, the decay lifetime decrease, which can be fitted by the equation:
| |
 | (7) |
herein,
τT and
τ0 are the lifetimes at temperature of
T and initial lifetime, respectively.
A is the constant and
k stands for Boltzmann constant, and Δ
Ea represents the activation energy. As shown in Fig. S2,
† the activation energy is determined to be 0.049 eV at low temperature range.
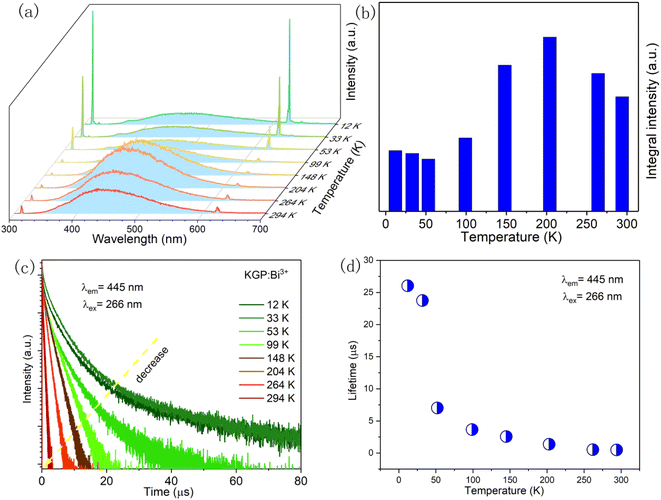 |
| | Fig. 6 (a) Temperature dependent emission spectra, (b) integral emission intensity, (c) temperature dependent decay curves, and (d) calculated lifetime of KGP:Bi3+ sample under 266 nm excitation. | |
3.2.2 Photoluminescence characteristics KGP:Bi3+,Sm3+ phosphor. Fig. 7(a) exhibits the emission spectra of KGP:Bi3+, KGP:Sm3+, and KGP:Bi3+,Sm3+ phosphors under 266 nm excitation, while Fig. 7(b) presents their CIE diagram. Accordingly, the emission color can be manipulated by controlling the dopants, and white emission color can also be achieved. In emission spectrum of KGP:Sm3+, typical Sm3+ emissions at 562, 596, and 642 nm can be observed, which correspond to characteristic 4G5/2 → 6H5/2, 4G5/2 → 6H7/2, and 4G5/2 → 6H9/2 transitions of Sm3+ ions respectively. When Bi3+ is co-doped into host lattice, the band emission of Bi3+ ions from 330 to 650 nm appears, and the emission intensity of Sm3+ is enhanced. Compared with the spectrum of KGP:Bi3+, the co-doping of Sm3+ leads to the decrease of emission intensities of Bi3+. There might be energy transfer from Bi3+ ions to Sm3+ ions.
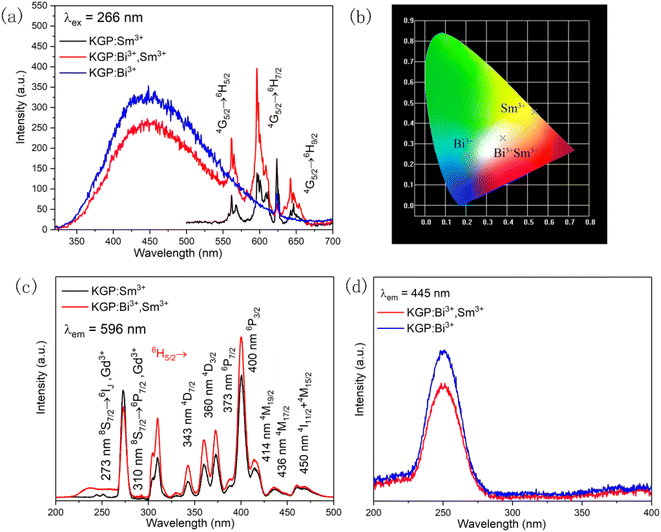 |
| | Fig. 7 (a) Emission spectra and (b) CIE diagram of KGP:Bi3+, KGP:Sm3+, and KGP:Bi3+,Sm3+ phosphors with 266 nm excitation; (c) excitation spectra of Sm3+ ions in KGP:Sm3+ and KGP:Bi3+,Sm3+ phosphors by monitoring at 596 nm; and (d) excitation spectra of Bi3+ ions in KGP:Bi3+ and KGP:Bi3+,Sm3+ phosphors by monitoring at 445 nm. | |
In order to explore the energy transfer process, the excitation spectra and decay curves were measured. Fig. 7(c) displays the excitation spectra of Sm3+ ions in KGP:Sm3+ and KGP:Bi3+,Sm3+ phosphors by monitoring at the dominant emission at 596 nm. In the spectrum of KGP:Sm3+, excitation peaks located at 245, 273, and 310 nm are due to the Gd3+ absorptions.38 Meanwhile, several excitation peaks corresponding to the characteristic Sm3+ absorptions can also be observed, which are located at 343 nm (6H5/2 → 4D7/2), 360 nm (6H5/2 → 4D3/2), 373 nm (6H5/2 → 6P7/2), 400 nm (6H5/2 → 6P3/2), 414 nm (6H5/2 → 4M19/2), 436 nm (6H5/2 → 4M17/2), and 450 nm (6H5/2 → 4I11/2 + 4M15/2).39,40 After co-doping with Bi3+, a new excitation band from 220 to 270 nm appears, which matches the excitation spectrum of Bi3+ ions in Fig. 4(b). Besides, the intensity of Sm3+ excitation peaks increases, which might due to the overlap of the emission spectrum of Bi3+ and excitation spectrum of Sm3+. In other words, co-doping with Bi3+ will enhance the excitation intensity of Sm3+. Fig. 7(d) exhibits the excitation spectra of Bi3+ in KGP:Bi3+ and KGP:Bi3+,Sm3+ phosphors by monitoring at 445 nm. Only one excitation band centered at 252 nm can be observed, and the co-doping of Sm3+ ions leads to the decrease of excitation intensity of Bi3+. Thus, we can speculate that there is energy transfer from Bi3+ to Sm3+ in KGP:Bi3+,Sm3+ phosphor. To further confirm the energy transfer process, the decay curves of Sm3+ and Bi3+ were studied. Fig. 8(a) exhibits the decay curves of Sm3+ (596 nm) in KGP:Sm3+ and KGP:Bi3+,Sm3+ samples. A rise time can be observed in the curve of KGP:Sm3+, and the decay lifetime is calculated to be 3.94 ms by using the mono-exponential fitting equation:
| |
I(t) = I0![[thin space (1/6-em)]](https://www.rsc.org/images/entities/char_2009.gif) exp(−t/τ) exp(−t/τ)
| (8) |
where
I(
t) is the total intensity at time
t,
I0 is intensity at
t = 0 and
τ is lifetime. After co-doping with Bi
3+, the rise time disappears and the lifetime decreases to 2.93 ms, illustrating that Bi
3+ ions accelerate the population of Sm
3+ in the excited state.
Fig. 8(b) exhibits the decay curves of Bi
3+ (445 nm) in KGP:Bi
3+ and KGP:Bi
3+,Sm
3+ phosphors. After co-doping with Sm
3+, the lifetime values of Bi
3+ decreased from 0.412 μs to 0.394 μs. As aforementioned, there is an energy transfer process from Bi
3+ to Sm
3+. The corresponding energy level diagram of KGP:Bi
3+,Sm
3+ sample is displayed in
Fig. 9.
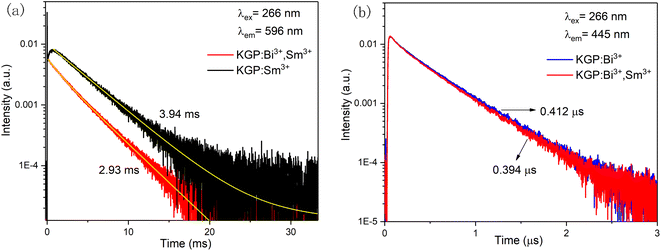 |
| | Fig. 8 (a) Decay curves of Sm3+ ions in KGP:Sm3+ and KGP:Bi3+,Sm3+ phosphors by monitoring at 596 nm; and (b) decay curves of Bi3+ ions in KGP:Bi3+ and KGP:Bi3+,Sm3+ phosphors by monitoring at 445 nm. | |
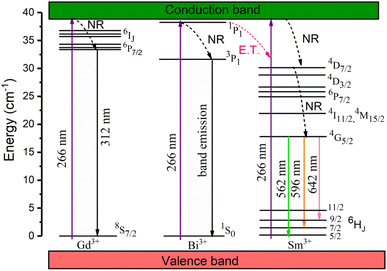 |
| | Fig. 9 Energy level diagram of KGP:Bi3+,Sm3+ phosphors (NR stands for non-radiative transition, E.T. stands for energy transfer). | |
3.3 Temperature sensing performance
Fig. 10(a) shows the temperature dependent emission spectra of KGP:Bi3+,Sm3+ phosphor in the range of 11 to 295 K with excitation at 266 nm. The integral emission intensities of Bi3+ and Sm3+ ions are shown in the inset. As the temperature increases, the emission intensity of Bi3+ increases firstly and then decreases, similar to the variation in KGP:Bi3+ phosphor. However, the emission intensity of Sm3+ decreases gradually with raising temperature. Fig. 10(b) shows the temperature dependent CIE diagram of KGP:Bi3+,Sm3+ phosphor. The emission colors travel through yellow to with the temperature increases from 11 to 295 K, and the corresponding CIE coordinates are listed in Table S2.† Furthermore, the emission intensity ratio (R) of Bi3+ to Sm3+ was found to be temperature dependent and can be used for the temperature sensing. Fig. 10(c) shows the experimental data of R and the fitting curve. In the temperature range from 44 to 182 K, the data can be linearly fitted. The equation can be expressed as:where A is the slope of fitting curve, B is a constant. The parameters of A and B were determined to be 0.0157 and −0.19, respectively. The absolute sensitivity (Sa) and relative sensitivity (Sr) can be calculated by following equations:| |
 | (10) |
| |
 | (11) |
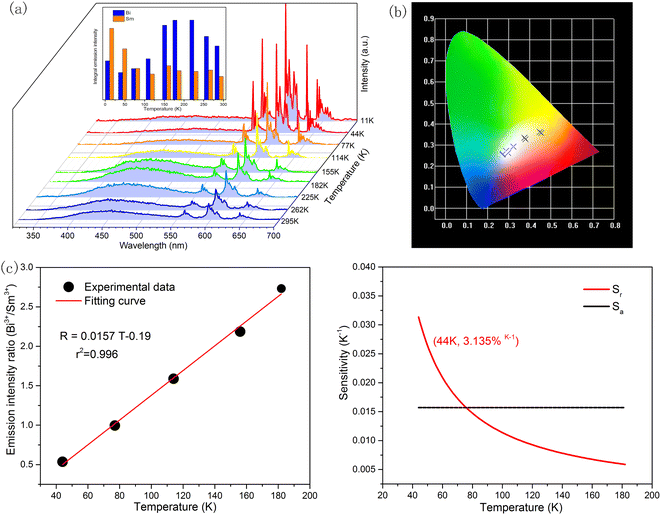 |
| | Fig. 10 (a) Temperature dependent emission spectra of KGP:Bi3+,Sm3+ phosphor from 11 to 295 K under 266 nm excitation. Inset: Integral emission intensity of Bi3+ and Sm3+. (b) Temperature dependent CIE diagram; (c) emission intensity ratio of Bi3+ to Sm3+ in the range of 44 to 182 K and the liner fitting curve; and (d) calculated relative sensitivity (Sr) and absolute sensitivity (Sa). | |
For this sample, the absolute sensitivity is 1.57% K−1, and the maximum relative sensitivity is 3.135% K−1 at 44 K, as shown in Fig. 10(d).
To further explore the temperature sensing performance above room temperature of KGP:Bi3+,Sm3+ phosphor, the emission spectra in the temperature range from 295 to 523 K were studied with excitation at 266 nm. In Fig. 11(a), the emission intensity of Bi3+ decreases with increasing temperature due to thermal quenching effect, while the emission intensity of Sm3+ increases firstly and then decreases. The increase of Sm3+ intensity may be due to the accelerated energy transfer caused by heating. Fig. 11(b) and Table S3† displays the CIE diagram of KGP:Bi3+,Sm3+ phosphor, in which the emission color can be turned from white to yellow with the increase of temperature.
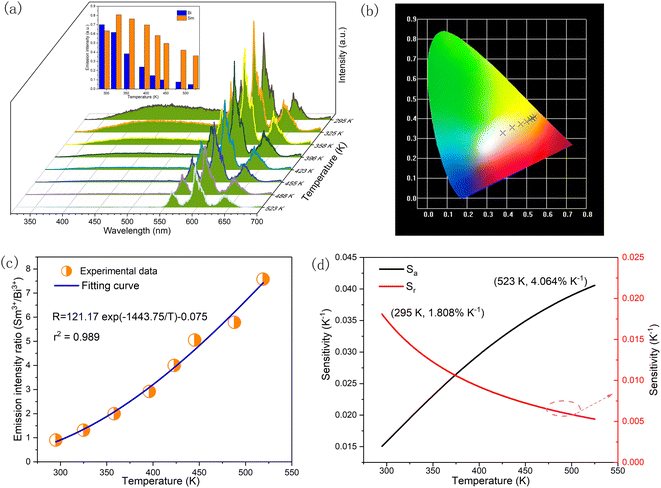 |
| | Fig. 11 (a) Temperature dependent emission spectra of KGP:Bi3+,Sm3+ phosphor from 295 to 523 K under 266 nm excitation. Inset: Integral emission intensity of Bi3+ and Sm3+. (b) Temperature dependent CIE diagram; (c) emission intensity ratio of Sm3+ to Bi3+ and the fitting curve; and (d) calculated relative sensitivity (Sr) and absolute sensitivity (Sa). | |
For the application of temperature sensing, the emission intensity of Sm3+ can be regarded as a constant (IC) and can be used as a self-reference. Based on the Struck and Fonger theory,41 the relationship between emission intensity and temperature can be expressed by following equation:
| |
 | (12) |
where
I(
T) and
I0 represents the emission intensity at
T and low temperature;
A is a constant; Δ
Ea represents the activation energy related to thermal quenching;
k is the Boltzmann constant.
Based on eqn (12), the emission intensity ratio (R) of Sm3+ to Bi3+ can be expressed as:
| |
 | (13) |
where
B,
C, and Δ
E are parameters related to Bi
3+ and Eu
3+. The corresponding absolute sensitivity
Sa and relative sensitivity
Sr can be expressed as:
| |
 | (14) |
| |
 | (15) |
As shown in Fig. 11(c), the emission intensity ratio of Sm3+ to Bi3+ can be adopted for the temperature sensing. By using eqn (13), the plot can be well fitted and corresponding parameters of B, C, and ΔE/k were determined to be −0.075, 121.17, and 1443.75 cm−1 respectively. Fig. 11(d) shows the calculated sensitivities by eqn (14) and (15). The absolute sensitivity increases with temperature and reaches maximum of 4.064% K−1 at 523 K. By contrast, the relative sensitivity decreases with temperature and reaches the maximum of 1.808% K−1 at 295 K, indicating that it is a good candidate for application of optical thermometer. The sensitivities of this phosphor are comparable to the reported phosphors, as shown in Table 1.
Table 1 Comparison of the Sensitivities with the reported phosphors
| Material |
Temperature range (K) |
Max Sa (% K−1) |
Max Sr (% K−1) |
Ref. |
| Ca2YZr2Al3O12:Bi3+,Sm3+ |
298–473 |
0.099 |
0.356 |
42 |
| La3Ta0.8Sb0.2O7:Bi3+,Sm3+ |
303–523 |
5.9 |
1.32 |
43 |
| Sr3Y2Ge3O12: Bi3+,Sm3+ |
298–498 |
0.17 |
0.57 |
44 |
| KGP:Bi3+,Sm3+ |
44–182 |
1.57 |
3.135 |
This work |
| KGP:Bi3+,Sm3+ |
295–523 |
4.064 |
1.808 |
This work |
3.4 Thermal stability
Thermal stability is an important parameter which affects the application of optical materials in LEDs. Fig. 12(a) displays the thermal stability of KGP:Bi3+,Sm3+ phosphor. At 423 K, the emission intensities of Bi3+, Sm3+, and total emission quench to 20.8%, 91.8%, and 55.3% of its initial intensity at 295 K. Fig. 12(b) exhibits the plot of ln(I0/IT − 1) against (1/kT), and the calculated slope correspond to the activation energy in the thermal quenching process of KGP:Bi3+,Sm3+ phosphor, which is determined to be 0.276 eV.
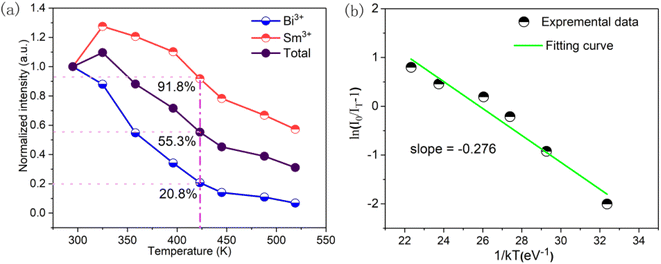 |
| | Fig. 12 (a) Normalized emission intensity of Bi3+, Sm3+, and total emission intensity as a relation with temperature; (b) plot of ln(I0/IT − 1) versus (1/kT) for the calculation for the Ea of KGP:Bi3+,Sm3+ phosphor. | |
4. Conclusion
In summary, a series Bi3+, Sm3+ single doped and co-doped KGP samples were successfully synthesized by high temperature solid state method. Based on the emission spectrum, excitation spectra, as well as decay curves, the energy transfer process from Gd3+ and Bi3+ to Sm3+ can be demonstrated. Furthermore, the tunable emission color can be obtained by co-doping Sm3+ with Bi3+. The emission intensity ratio of Bi3+ and Sm3+ was found to be temperature dependent and can be used for the optical temperature sensing in a wide temperature range. The maximum relative sensitivity of KGP:Bi3+,Sm3+ phosphor reaches 3.13% K−1. Meanwhile, a high thermal stability of 55.3% at 423 K can be obtained for KGP:Bi3+,Sm3+ phosphors.
Data availability
Data available within the article or its ESI.†
Conflicts of interest
There are no conflicts to declare.
Acknowledgements
This research was supported by Weifang Science and Technology Development Funds (2023GX011), the Natural Science Foundation of Jiangsu Province (Grant No. BK20241002).
References
- C.-K. Chang and T.-M. Chen, Appl. Phys. Lett., 2007, 91, 081902 CrossRef.
- X. Huang, S. Wang, B. Li, Q. Sun and H. Guo, Opt. Lett., 2018, 43, 1307–1310 CrossRef CAS PubMed.
- M. Xia, X. Wu, Y. Zhong, H. T. Hintzen, Z. Zhou and J. Wang, J. Mater. Chem. C, 2019, 7, 2927–2935 RSC.
- M. Song, J. Wang, Z. Xie, L. Liu, W. Zhao and W. Zhou, J. Rare Earths, 2023 Search PubMed , in press.
- X. Wang, W. Zeng, M. Song, F. Wang, X.-d. Hu, Q. Guo and Y. Liu, Chem. Eng. J., 2019, 475–484 CrossRef.
- M. Song, N. Zhang, Q. Meng, L. Wang, X.-y. Li and G. f. Wang, J. Rare Earths, 2017, 35, 368–373 CrossRef CAS.
- N. Guo, Y. Huang, H. You, M. Yang, Y. Song, K. Liu and Y. Zheng, Inorg. Chem., 2010, 49, 10907–10913 CrossRef CAS PubMed.
- P. Dang, S. Liang, G. Li, Y. Wei, Z. Cheng, H. Lian, M. Shang, A. A. Al Kheraif and J. Lin, Inorg. Chem., 2018, 57, 9251–9259 CrossRef CAS PubMed.
- G. Zhu, Y. Wang, Z. Ci, B. Liu, Y. Shi and S. Xin, J. Lumin., 2012, 132, 531–536 CrossRef CAS.
- G. Zhu, S. Xin, Y. Wen, Q. Wang, M. Que and Y. Wang, RSC Adv., 2013, 3, 9311–9318 RSC.
- P. Yang, X. Yu, X. Xu, T. Jiang, H. Yu, D. Zhou, Z. Yang, Z. Song and J. Qiu, J. Solid State Chem., 2013, 202, 143–148 CrossRef CAS.
- Z. Zhang, J. Yan, Q. Zhang, G. Tian, W. Jiang, J. Huo, H. Ni, L. Li and J. Li, Inorg. Chem., 2022, 61, 16484–16492 CrossRef CAS PubMed.
- D. Wen, H. Liu, Z. Ma, L. Zhou, J. Li, Y. Guo, Q. Zeng, P. A. Tanner and M. Wu, Angew. Chem., Int. Ed., 2023, 62, e202307868 CrossRef CAS.
- J. Feng, L. Chen, J. Xie, Q. Zhang, Y. Yu, L. Luo, Q. Tang, J. Zhou and J. Li, Mater. Today Chem., 2024, 36, 101979 CrossRef CAS.
- K. Zhou, H. Zhang, Y. Liu, Y. Bu, X. Wang and X. Yan, J. Am. Ceram. Soc., 2019, 102, 6564–6574 CrossRef CAS.
- X. Wang, Q. Liu, Y. Bu, C.-S. Liu, T. Liu and X. Yan, RSC Adv., 2015, 5, 86219–86236 RSC.
- Y. Gao, F. Huang, H. Lin, J. Zhou, J. Xu and Y. Wang, Adv. Funct. Mater., 2016, 26, 3139–3145 CrossRef CAS.
- C. D. Brites, P. P. Lima, N. J. Silva, A. Millán, V. S. Amaral, F. Palacio and L. D. Carlos, Adv. Mater., 2010, 22, 4499–4504 CrossRef CAS.
- S. Zheng, W. Chen, D. Tan, J. Zhou, Q. Guo, W. Jiang, C. Xu, X. Liu and J. Qiu, Nanoscale, 2014, 6, 5675–5679 RSC.
- J. Xue, H. M. Noh, B. C. Choi, S. H. Park, J. H. Kim, J. H. Jeong and P. Du, Chem. Eng. J., 2020, 382, 122861 CrossRef CAS.
- K. Li and R. Van Deun, J. Alloys Compd., 2019, 787, 86–95 CrossRef CAS.
- R. Wei, J. Guo, K. Li, L. Yang, X. Tian, X. Li, F. Hu and H. Guo, J. Lumin., 2019, 216, 116737 CrossRef CAS.
- J. Wang, Y. Bu, X. Wang and H. J. Seo, Sci. Rep., 2017, 7, 6023 CrossRef.
- R.-R. Wang, G.-H. Li and G.-M. Cai, J. Mater. Chem. C, 2023, 11, 3616–3625 RSC.
- B. V. Ratnam, M. Jayasimhadri and K. Jang, Spectrochim. Acta, Part A, 2014, 132, 563–567 CrossRef CAS PubMed.
- S. Bevara, S. N. Achary, K. K. Mishra, T. R. Ravindran, A. K. Sinha, P. U. Sastry and A. K. Tyagi, Phys. Chem. Chem. Phys., 2017, 19, 6030–6041 RSC.
- L. Yang, Z. Mu, S. Zhang, Q. Wang, D. Zhu, Y. Zhao, D. Luo, Q. Zhang and F. Wu, J. Mater. Sci.: Mater. Electron., 2018, 29, 6548–6555 CrossRef CAS.
- P. Gupta, A. K. Bedyal, V. Kumar, Y. Khajuria, S. P. Lochab, S. S. Pitale, O. M. Ntwaeaborwa and H. C. Swart, Mater. Res. Bull., 2014, 60, 401–411 CrossRef CAS.
- D. D. Ramteke and R. S. Gedam, J. Rare Earths, 2014, 32, 389–393 CrossRef CAS.
- B. Shen, B. Chen, Y. Zhang and J. Hu, J. Lumin., 2020, 218, 116821 CrossRef CAS.
- A. E. Morales, E. S. Mora and U. Pal, Rev. Mex. Fis., 2007, 53, 18–22 CAS.
- P. Gupta, A. K. Bedyal, V. Kumar, Y. Khajuria, V. Sharma, O. M. Ntwaeaborwa and H. C. Swart, Mater. Res. Express, 2015, 2, 076202 CrossRef.
- L. Wang, J. Qiao, Y. Liu, P. Huang, Q. Shi, Y. Tian, C. e. Cui and Z. Luo, Opt. Mater., 2017, 67, 78–83 CrossRef CAS.
- G. Blasse, Philips Res. Rep, 1969, 24, 131 CAS.
- D. L. Dexter, J. Chem. Phys., 1953, 21, 836–850 CrossRef CAS.
- D. Chen, Y. Wang, Y. Yu, P. Huang and F. Weng, Opt. Lett., 2008, 33, 1884–1886 CrossRef CAS PubMed.
- A. M. Srivastava and W. Beers, J. Lumin., 1999, 81, 293–300 CrossRef CAS.
- U. Vetter, J. Zenneck and H. Hofsäss, Appl. Phys. Lett., 2003, 83, 2145–2147 CrossRef CAS.
- P. Gupta, A. K. Bedyal, V. Kumar, Y. Khajuria, V. Sharma, O. M. Ntwaeaborwa and H. C. Swart, Mater. Res. Express, 2015, 2, 076202 CrossRef.
- J. Chen, W. Zhao, J. Wang, N. Wang, Y. Meng, J. He and X. Zhang, Ceram. Int., 2015, 41, 11945–11952 CrossRef CAS.
- C. Struck and W. Fonger, J. Appl. Phys., 1971, 42, 4515–4516 CrossRef CAS.
- C. Han, J. Tan, A. Xiong and T. Yuan, Opt. Mater., 2021, 118, 111232 CrossRef CAS.
- Y. Xue, Y. Chen, Q. Mao, Y. Ding, G. Bai, L. Chu, M. Liu and J. Zhong, Mater. Des., 2023, 234, 112375 CrossRef CAS.
- R. Sun, X. Wei, H. Yu, P. Chen, H. Ni, J. Li, J. Zhou and Q. Zhang, Dalton Trans., 2023, 52, 2825–2832 RSC.
|
| This journal is © The Royal Society of Chemistry 2024 |
Click here to see how this site uses Cookies. View our privacy policy here.  Open Access Article
 a,
Mingjun Song*a,
Junpeng Xue*b,
Shala Bic and
Hyo Jin Seo
 *d
*d


![[thin space (1/6-em)]](https://www.rsc.org/images/entities/char_2009.gif) exp(−t/τ)
exp(−t/τ)


