 Open Access Article
Creative Commons Attribution 3.0 Unported Licence
Development, cross-validation and greenness assessment of capillary electrophoresis method for determination of ALP in pharmaceutical dosage forms – an alternative to liquid chromatography†
Zvonimir Mlinarić a,
Lu Turkovića,
Ivor Babića,
Tajana Silovskibc,
Nina Kočevar Glavačd and
Miranda Sertić
 *a
*a
aUniversity of Zagreb Faculty of Pharmacy and Biochemistry, Department of Pharmaceutical Analysis, Ante Kovačića 1, 10000 Zagreb, Croatia. E-mail: miranda.sertic@pharma.unizg.hr
bUniversity Hospital Centre Zagreb, Department of Oncology Kišpatićeva 12, 10000 Zagreb, Croatia
cUniversity of Zagreb School of Medicine, Šalata 2, 10000 Zagreb, Croatia
dUniversity of Ljubljana, Faculty of Pharmacy, Department of Pharmaceutical Biology, Aškerčeva cesta 7, 1000, Ljubljana, Slovenia
First published on 18th October 2024
Abstract
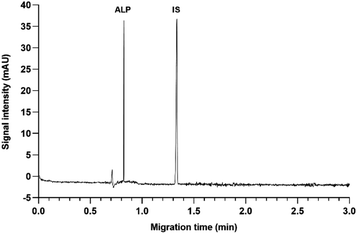
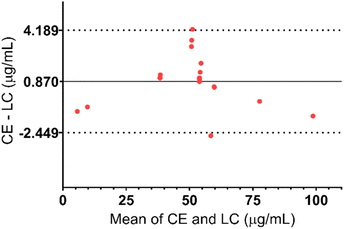
Breast cancer treatment has made tremendous progress in recent years and new therapies are emerging continuously. Alpelisib (ALP) is a novel phosphoinositide-3-kinase (PI3K) inhibitor recently approved for human receptor-positive, human epidermal growth factor receptor 2-negative, PIK3CA-mutated metastatic breast cancer in combination with fulvestrant. ALP has been the subject of only a limited number of preclinical in vitro and in vivo studies using different chromatographic techniques. However, no research has been published on analyzing ALP using capillary electrophoresis (CE). The absence of pharmacopoeial monographs for ALP in both the European and United States Pharmacopoeias highlights the urgent need to develop a reliable analytical method for its quality control in both industry and regulatory authorities. In this work, we have developed a first-ever CE method for the determination of ALP in pharmaceutical dosage forms in just 1.4 minutes. This was achieved with a 25 mM borate buffer at pH 9.3, 30 kV separation voltage and 30 °C capillary temperature. The proposed method was validated according to the ICH guidelines regarding selectivity, linearity (r = 0.9988), precision (RSD < 5.9%), accuracy (bias < 3.0%) and robustness (RSD < 3.2%). It was applied to the pharmaceutical dosage form of ALP and was shown to be suitable for the reliable determination of ALP. Furthermore, to demonstrate the applicability of the CE as an alternative technique to more commonly used HPLC in the analysis of drugs, cross-validation of CE and HPLC methods was performed. Bland–Altman analysis showed that the average difference in determined concentrations between CE and HPLC over a range of 10–100 μg mL−1 was 0.87 μg mL−1 (p = 0.6390, N = 19) meaning that there is no difference in the performance of CE and HPLC in the determination of ALP in pharmaceutical dosage forms. The environmental impact of both methods was assessed using AGREE software and scores for CE and HPLC were calculated to be 0.74 and 0.51, respectively. Because of equally reliable analytical performance and greener analysis, CE should be considered as an alternative technique to HPLC in the analysis of ALP pharmaceutical dosage forms.
Introduction
According to the World Health Organization (WHO), around 2.3 million cases of breast cancer are diagnosed each year, and around 685 thousand patients die from it worldwide.1 This makes breast cancer the leading cause of cancer deaths in women in the world. The expected global burden of cancer by 2040 is 28.4 million cases which represents a 47% rise from 2020.1 Typical breast cancer treatment combines surgery, radiation, and systemic treatment; the latter encompasses endocrine therapy, chemotherapy, and targeted therapy including immunotherapy.2 Breast cancer medication has made tremendous progress in recent decades, and new medicines continue to enter the market. Alpelisib (ALP) is a novel targeted breast cancer drug which inhibits phosphoinositide 3-kinase (PI3K). It was first approved by the FDA in 2019, in combination with fulvestrant, for the treatment of hormone receptor-positive (HR+), human epidermal growth factor receptor 2-negative (HER2−), PIK3CA-mutated, advanced or metastatic breast cancer, and has been available in the EU since EMA's marketing authorization in 2020.3The development of new drugs is intrinsically linked to the development of analytical methods for the determination of pharmacokinetic properties and quality control. ALP has been the subject of only a limited number of preclinical in vitro and in vivo studies using different chromatographic techniques; high-performance liquid chromatography with fluorescence detection (HPLC-FLD) for the study of ALP metabolism and pharmacokinetics in rats,4 and ultra-performance liquid chromatography coupled with tandem mass spectrometry (UPLC-MS/MS) for the determination of ALP in mice and human plasma.5,6 There is one stability-indicating method employing liquid chromatography-quadrupole-time-of-flight mass spectrometry (LC-QTOF-MS/MS) for structural characterization of the forced degradation products of ALP.7 Few electrochemical methods for the analysis of ALP in biological fluids and tablets were reported, but it was not specified which exact formulation was analysed.8–10 However, no research has been published on the analysis of ALP by capillary electrophoresis (CE). The fact that no pharmacopoeial monographs for ALP are available in either the European or the United States Pharmacopoeia,11,12 shows the urgent need for the development of a reliable analytical method for the quality control of ALP.
CE has been recognized as an alternative or complementary analytical tool with specific advantages over chromatographic techniques.13 Of these, a considerable advantage is the suitability of the application to a wide range of analytes, from organic and inorganic, charged and neutral, water-soluble and insoluble, polar and nonpolar, small-sized and polymeric, to aromatic and aliphatic molecules. In addition, CE requires small sample and solvent volumes and enables faster analysis times.14,15
Along with a need to develop reliable, efficient, and cost-effective methods, sustainability is gaining increased attention as a growing element in green analytical chemistry. Indeed, CE has been proven to meet the criteria of a sustainable and eco-friendly analytical solution due to its significant advantages, both at a level of environmental compatibility and analytical performance.16,17
Based on the background mentioned above, ALP as an active pharmaceutical ingredient is an attractive candidate for the development of a CE analytical method for use in pharmacological research and pharmaceutical quality control. As this area has not been investigated so far, our work aimed to develop and validate a new CE method that will allow the quantitative determination of ALP in finished pharmaceutical products, as well as compare the proposed method to an HPLC method – a complementary analytical technique and a golden standard in the pharmaceutical industry. Additional focus will be given to the evaluation of method greenness according to selected guidelines.
The ultimate goal of our work is to support the development of the analytical determination of ALP by industry and regulatory authorities, by providing a reliable and sustainable CE method that enables the quantitative determination of ALP in finished pharmaceutical products.
Experimental
Instrumentation
CE experiments were carried out on High-Performance Capillary Electrophoresis G1600A (Agilent Technologies, Santa Clara, CA, USA) with diode array detection. Data were collected and analyzed using 3DCE/MSD ChemStation (Agilent Technologies, Santa Clara, CA, USA). An uncoated fused-silica capillary with a 50 μm internal diameter, total length of 37 cm, and effective length of 28.5 cm was used (Agilent Technologies, Santa Clara, CA, USA).For the HPLC analysis, an Agilent 1100 system equipped with a diode array detector was used (Agilent Technologies, Santa Clara, CA, USA). Data were collected and analyzed using ChemStation for LC 3D systems (Agilent Technologies, Santa Clara, CA, USA). Microsoft Office 365 Excel (Redmond, WA, USA) and GraphPad Prism 8 (Boston, MA, USA) were used for data analysis and visualisation.
Chemicals
HPLC-grade methanol (MeOH) was purchased from Carlo Erba (Milan, Italy). Sodium dodecyl sulfate (SDS) was obtained from MilliporeSigma (Burlington, MA, USA), 1 M sodium hydroxide solution and 50 mM sodium tetraborate buffer solution pH 9.3 for CE were purchased from Agilent Technologies (Santa Clara, CA, USA). Ultrapure water, used throughout this work, was purified using a Merck Millipore Milli-Q IQ 7015 system (Burlington, MA, USA). The standard of ALP (purity > 98%) was obtained from MedChemExpress (Princeton, NJ, USA). The chemical structure of ALP is shown in Fig. S1.† 4-Aminobenzoic acid (internal standard, IS) was from Fluka (Buchs, Switzerland). Piqray 50 and 200 mg film-coated tablets were obtained from Novartis (Basel, Switzerland).Experimental conditions
![[thin space (1/6-em)]](https://www.rsc.org/images/entities/char_2009.gif) 000 rpm. The obtained supernatants were diluted five-fold into 50% MeOH for the analysis.
000 rpm. The obtained supernatants were diluted five-fold into 50% MeOH for the analysis.| Time (min) | Mobile phase B% |
|---|---|
| 0 | 30 |
| 7 | 100 |
| 10 | 100 |
| 10.5 | 30 |
| 16 | 30 |
Results and discussion
CE method development
The first step of every CE method development is the choice of the CE mode, and the pH of the running buffer. Since ALP is a basic molecule, capillary zone electrophoresis (CZE) in basic pH was the technique of choice to ensure high electrophoretic mobility of ALP. This would also secure strong electroosmotic flow due to highly deprotonated silanol groups on the inner capillary wall. The preliminary results demonstrated that the routinely used borate buffer of pH 9.3 enabled fast analysis of ALP in CZE mode.Borate buffer concentration was investigated in the range of 15 to 50 mM. This is a pivotal step in developing the CZE method since the buffer concentration directly influences the electroosmotic flow (EOF) and the reproducibility of the separation system. Higher buffer concentration decreases EOF and prolongs the analysis. It may also generate a high electric current within the capillary causing Joule heating. On the other hand, if the buffer concentration is too low, the sample might adsorb to the capillary surface. Finally, if the buffer and the sample conductivity differ, the analyte peak shape distorts. At all tested buffer concentrations, the peak shape and symmetry were adequate, and as seen in Fig. 3 the migration time did not change much until the concentration of 45 mM was investigated. To avoid the aforementioned analyte adsorption and Joule heating, the 25 mM borate buffer was chosen for the subsequent experiments.
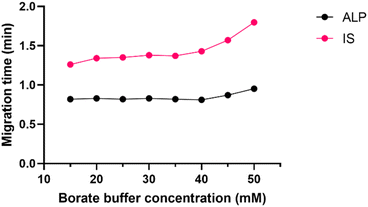 | ||
| Fig. 3 Effect of borate buffer concentration (15–50 mM) on ALP and IS migration times, pH 9.3, 30 °C, 30 kV. | ||
Although ALP analysis is already possible using CZE, since this is the first report of a capillary electrophoretic determination of this drug, the influence of background electrolyte (BGE) additions was also investigated. The addition of SDS, as the most commonly used surfactant, was tested in the concentrations 20–30 mM. Since this changes the CE mode to micellar electrokinetic chromatography (MEKC), the observed increase in the ALP migration times and total analysis time is not surprising. However, the total analysis time was not too long (Fig. S2†), and such BGE could also be used for the analysis of ALP in the presence of other neutral analytes. It is worth mentioning that the migration order of ALP and the IS is reversed in MEKC.
A similar effect of the increase of migration times was observed with the addition of the organic solvent to the borate buffer. Namely, the addition of the organic solvent changes the electrolyte viscosity of the BGE. Its effects to the EOF are complex, they may alter the selectivity of the method and have to be determined experimentally. The addition of 10% methanol did not result in an improved peak shape, had no influence on the selectivity of the method, and had little influence on the resolution between ALP and IS (Fig. S3†). Moreover, it slightly prolonged the analysis time. Since the aim was to keep the method as eco-friendly as possible and no improvements were noticed by the addition of surfactants or organic solvent to the BGE, only 25 mM borate buffer pH 9.3 was used as optimal BGE composition.
Finally, for fine-tuning, the influences of capillary temperature and separation voltage on the analysis time, peak shape, and resolution were investigated. The separation voltage was tested in the range of 15 to 30 kV. This parameter, directly influencing the strength of the electric field, showed the strongest effect on the migration times (Fig. 4A). As expected, the fastest analysis was obtained at 30 kV. Before it was chosen as optimal, the influence on the peak area, resolution, and current was also investigated. Although the increase of separation voltage decreases peak area, the method's sensitivity remained satisfactory in the entire range. The resolution between ALP and the IS remained extremely high due to very narrow peaks and short migration times. Finally, the applied 30 kV voltage resulted in a current of around 110 μA, posing little risk of Joule heating.
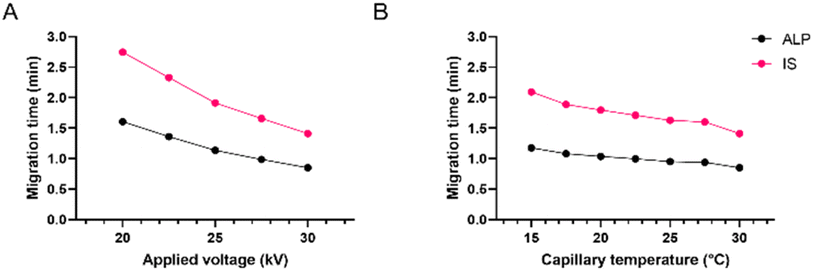 | ||
| Fig. 4 Effect of (A) applied voltage and (B) capillary temperature on ALP and IS migration times; 25 mM borate at pH 9.3. | ||
Capillary temperature was investigated in the range of 15 to 30 °C. In Fig. 4B it can be observed that the migration times increased by decreasing the capillary temperature. This is in accordance with the known influence of temperature on the viscosity of the BGE, which affects both the EOF and the electrophoretic mobility of the analyte. Since the peak shape and the resolution were satisfactory in the entire tested range, the preference was given to 30 °C since the analysis time was the shortest, the peaks were narrow and symmetrical, and the resolution was excellent. Due to low buffer concentration in the BGE, even at higher voltages, the current within the capillary was not high with little risk of Joule heating.
CE method validation
The newly developed CE method was validated according to the ICH Q2(R2) guidelines in terms of selectivity, linearity, limits of detection and quantification, precision and accuracy, and robustness.18 The peak area of ALP was corrected with the IS.The linearity of the proposed method was evaluated in the range 10–100 μg mL−1 with the obtained correlation coefficient of 0.9988.
Selectivity was assessed as peak purity from 200 to 400 nm. The obtained scores ranged from 998.9 to 1000.0, demonstrating that ALP and IS were not co-migrating mutually nor with any other compounds.
The precision of the method was expressed as repeatability and intermediate precision. Repeatability was assessed by 6 measurements on 3 concentration levels within a single day, while intermediate precision was evaluated by 3 measurements on 3 concentration levels for 3 days, totalling 9 measurements per concentration level. The accuracy of the method was expressed as the bias of measured concentrations from the nominal values at 3 concentration levels. Results are shown in Table 2.
| ALP concentration (μg mL−1) | Accuracy | Repeatability | Intermediate precision | ||
|---|---|---|---|---|---|
| Bias (%) | Migration time RSD (%) | IS-corrected peak area RSD (%) | Migration time RSD (%) | IS-corrected peak area RSD (%) | |
| 40 | 3.0 | 0.08 | 1.25 | 1.73 | 4.96 |
| 50 | 0.9 | 0.17 | 0.67 | 1.00 | 3.93 |
| 60 | 2.3 | 0.29 | 1.10 | 0.31 | 5.87 |
Traditionally, the robustness is a weak point of the CE technique since it is usually less robust than the HPLC technique. Therefore, robustness of the developed CE method was assessed by slightly varying the BGE concentrations, capillary temperature and separation voltage and it was expressed as the bias of the IS-corrected peak area and the RSD of the migration times (Table 3).
| Parameter | Migration time RSD (%) | IS-corrected peak area RSD (%) |
|---|---|---|
| BGE concentration (25 ± 1 mM) | 0.70 | 1.53 |
| Capillary temperature (30 ± 1 °C) | 1.11 | 1.51 |
| Applied voltage (30–1 kV) | 4.26 | 3.19 |
Since all validation parameters were in acceptable ranges, the developed method is successfully validated for the intended use.
Analysis of ALP tablets
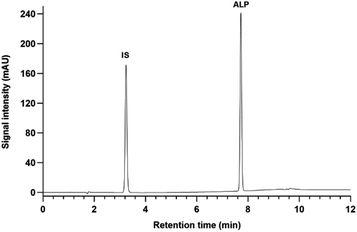
The developed and validated CE method was applied to the pharmaceutical dosage form of ALP (Piqray 50 mg film-coated tablets) to determine its content. Found concentrations of ALP were in agreement with the labelled content, and the mean recovery of ALP was 98.7 ± 1.2%.Next, both CE and HPLC methods were applied to another pharmaceutical dosage form of ALP (Piqray 200 mg film-coated tablets) to test whether there were any differences in their applicability to the analysis of ALP in real samples (Fig. S4–S5†). No interferences of excipients with the analyte's peak were observed. Both methods detected similar concentrations of ALP in the same sample with relative concentrations (CE to HPLC) ranging from 99.7 to 102.1%.
HPLC method validation, cross-validation
To further demonstrate the applicability of the proposed method in the pharmaceutical industry or regulatory setting, cross-validation between the CE and HPLC as a golden standard was conducted in terms of precision, accuracy, and linearity. The results are presented in Tables 4 and 5. The precision and accuracy of both methods were acceptable due to low RSD and bias values, respectively. Furthermore, the validation parameters of CE and HPLC were comparable meaning that both methods could be applied for the intended purpose.| ALP concentration (μg mL−1) | CE | HPLC | ||
|---|---|---|---|---|
| RSD (%) | Bias (%) | RSD (%) | Bias (%) | |
| 40 | 0.4 | −2.6 | 0.2 | −4.6 |
| 50 | 0.9 | 5.5 | 0.3 | −0.1 |
| 60 | 2.9 | −1.6 | 0.4 | 1.4 |
| Validation parameter | CE | HPLC |
|---|---|---|
a Calculated as the concentration of the analyte at which the signal-to-noise ratio is 3![[thin space (1/6-em)]](https://www.rsc.org/images/entities/char_2009.gif) : :![[thin space (1/6-em)]](https://www.rsc.org/images/entities/char_2009.gif) 1.b Calculated as the concentration of the analyte at which the signal-to-noise ratio is 10 1.b Calculated as the concentration of the analyte at which the signal-to-noise ratio is 10![[thin space (1/6-em)]](https://www.rsc.org/images/entities/char_2009.gif) : :![[thin space (1/6-em)]](https://www.rsc.org/images/entities/char_2009.gif) 1. 1. |
||
| Linear range | 10–100 μg mL−1 | 10–100 μg mL−1 |
| Weighting factor | 1/x2 | 1/x2 |
| Slope | 0.00414 | 0.0253 |
| Intercept | 0.0001096 | −0.0281 |
| Correlation coefficient | 0.9988 | 0.9988 |
| Detection limita (μg mL−1) | 1.67 | 0.06 |
| Quantitation limitb (μg mL−1) | 5.00 | 0.20 |
The same samples including calibration standards (N = 7), quality controls (N = 6), and ALP dosage form extracts (N = 6) were analysed simultaneously using both methods and the results were compared using a Bland–Altman plot, as shown in Fig. 5. Differences between the results for all the samples were less than variation during the validation of the methods. Additionally, the 95% confidence interval is narrow which further emphasizes small differences in CE and HPLC methods. Therefore, it can be concluded that both methods are valid for the determination of ALP in its dosage form.
Greenness assessment
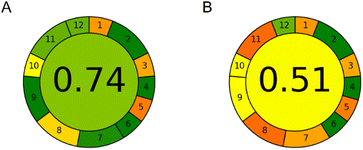
The environmental impact of both methods was assessed using AGREE software.19 Custom weights were attributed to sample preparation-related parameters (weight 1 – equal conditions in both cases) and technique-related parameters (weight 2). Exact inputs for CE and HPLC methods for all AGREE criteria are given in ESI Table S1.† Detailed calculation of AGREE scores is given in ESI Table S2.† The calculated AGREE scores are presented in Fig. 6.It can be seen that the CE method achieved an AGREE score of 0.74 compared to an AGREE score of 0.51 in the HPLC method. Thus, the CE method is significantly more environmentally friendly. The main observed advantages of the CE method over the HPLC method were in the amount of waste per analysis (0.15 mL of the background electrolyte as opposed to 16 mL of the mobile phase), sample throughput (7 samples per hour instead of 3), energy consumption (0.015 kW h at most), and reduced use of toxic reagents (0.01 mL of MeOH present in the sample, instead of 9.5 mL in the HPLC mobile phase for the duration of each analytical run). Both methods require an equally small sample amount – only 20 μL. However, CE injects only a few nanolitres of the sample and can therefore inject the same sample many times if needed. As it can be seen, CE has weak points in criteria 1, 3 and 5. This is due to the external sampling and sample preparation which is not miniaturized as well as the at-line position of the instrument. Besides this, the HPLC method has additional weak points in criteria 8, 9 and 11 due to the relatively higher amounts of waste generated and toxic chemicals utilized while also having lower sample throughput.
Conclusion
In this work, novel CE and HPLC methods for the determination of ALP in pharmaceutical dosage forms were developed, validated according to ICH guidelines and applied to real pharmaceutical samples. In addition, methods were cross-validated, and it was shown that there is no significant difference in the analytical performances of both methods. The greenness assessment was done on both methods showing that the CE method is significantly greener concerning waste production, sample throughput and energy consumption. It is worth noting that this is the first-ever CE method for the analysis of ALP in any sample matrix and as such is a valuable contribution to the analysis of ALP in general. In the end, due to equally reliable analytical performance and greener analysis, CE should be considered as an alternative technique to HPLC in the analysis of ALP pharmaceutical dosage forms.Data availability
The data supporting this article have been included as part of the ESI.†Author contributions
Zvonimir Mlinarić: conceptualization, methodology, investigation, formal analysis, data curation, validation, visualization, writing – original draft. Lu Turković: conceptualization, methodology, investigation, formal analysis, data curation, validation, visualization, writing – reviewing and editing. Ivor Babić: methodology, investigation, data curation. Tajana Silovski: validation, writing – reviewing and editing, resources. Nina Kočevar Glavač: validation, writing – reviewing and editing. Miranda Sertić: conceptualization, methodology, validation, writing – reviewing and editing, resources, supervision, project administration, funding acquisition.Conflicts of interest
T. S. received speaker honoraria from Eli Lilly, Pfizer and Novartis and conference reimbursement from Novartis and Pfizer; is a consultant of Novartis and Pfizer and is a co-investigator in Novartis clinical study. Other authors declare no conflict of interest related to this study. The funders had no role in the design of the study; in the collection, analyses or interpretation of data; in the writing of the manuscript, or in the decision to publish the results.Acknowledgements
This work has been funded by the Croatian Science Foundation through projects UIP-2019-04-8461 and DOK-2021-02-4595, and the European Regional Development Fund through project Farminova, KK.01.1.1.02.0021.References
- H. Sung, J. Ferlay, R. L. Siegel, M. Laversanne, I. Soerjomataram, A. Jemal and F. Bray, Ca-Cancer J. Clin., 2021, 71, 209–249 CrossRef.
- A. G. Waks and E. P. Winer, JAMA, 2019, 321, 288–300 CrossRef CAS.
- A. Markham, Drugs, 2019, 79, 1249–1253 CrossRef CAS PubMed.
- S. W. Seo, J. M. Kim, D. G. Han, D. Geum, H. Yun and I. S. Yoon, J. Chromatogr. B, 2021, 1163, 122508 CrossRef CAS.
- Q. Wang, X. Lan, Z. Zhao, X. Su, Y. Zhang, X. Y. Zhou and R. A. Xu, Front. Pharmacol, 2021, 12, 743411 CrossRef CAS PubMed.
- S. Lee, M. S. Kim, J. W. Jeong, J. woo Chae, T. S. Koo, H. J. Maeng, S. J. Chung, K. R. Lee and Y. J. Chae, J. Anal. Sci. Technol., 2022, 13, 1–13 CrossRef.
- V. Ghanghav, A. Chawathe, S. K. Chauthe and N. Sharma, Biomed. Chromatogr., 2024, 38, e5813 CrossRef CAS.
- W. Bouali, N. Erk, A. A. Genc, H. E. H. Ahmed and M. Soylak, Microchem. J., 2023, 195, 109478 CrossRef CAS.
- W. Bouali, G. Kurtay, A. Ayşe Genç and N. Erk, Microchem. J., 2024, 204, 111014 CrossRef CAS.
- W. Bouali, N. Erk, B. Sert and E. Harputlu, Talanta, 2024, 278, 126486 CrossRef CAS.
- United States Pharmacopoeia, USP-NF Issue 1, Rockville, MD, USA, 2024 Search PubMed.
- European Pharmacopoeia 11th Edition, Council of Europe, Strasbourg, France, 2024 Search PubMed.
- A. Wuethrich and J. P. Quirino, in The Application of Green Solvents in Separation Processes, Elsevier, 2017, pp. 517–532 Search PubMed.
- J. Sastre Toraño, R. Ramautar and G. de Jong, J. Chromatogr. B, 2019, 1118–1119, 116–136 CrossRef.
- S. El Deeb, H. Wätzig, D. A. El-Hady, H. M. Albishri, C. S. van de Griend and G. K. E. Scriba, Electrophoresis, 2014, 35, 170–189 CrossRef PubMed.
- M. Ranasinghe and J. P. Quirino, Curr. Opin. Green Sustainable Chem., 2021, 31, 100515 CrossRef CAS.
- Z. Mlinarić, L. Turković, I. Begović, B. Nigović and M. Sertić, Molecules, 2022, 27, 7603 CrossRef PubMed.
- ICH Q2(R2), Validation of Analytical Procedures, ICH Secretariat, Geneva, Switzerland, 2023 Search PubMed.
- F. Pena-Pereira, W. Wojnowski and M. Tobiszewski, Anal. Chem., 2020, 92, 10076–10082 CrossRef CAS.
Footnote |
| † Electronic supplementary information (ESI) available. See DOI: https://doi.org/10.1039/d4ra05715e |
| This journal is © The Royal Society of Chemistry 2024 |

