 Open Access Article
Selenenylsulfide covalent-directed chemistry for the detection of sulfhydryl groups using a diselenide fluorescent probe†
Chunqiu Ma,
Jichao Xu,
Xiaolu Wang,
Xuewen Wang,
Lei Zhang and
Su Jing *
*
School of Chemistry and Molecular Engineering, Nanjing Tech University, 30 South Puzhu Road, Nanjing 211816, Jiangsu, China. E-mail: sjing@njtech.edu.cn
First published on 18th November 2024
Abstract
We report the development of a diglycosyldiselenide-based fluorescent probe for the rapid detection of sulfhydryl-containing biomolecules. The probe facilitates a chemoselective coupling reaction with sulfhydryl groups in aqueous buffer under ambient conditions, resulting in the formation of homogeneous Se–S conjugates within one hour. Using glutathione, a sulfhydryl-containing biomolecule, as a proof of concept, the probe achieved a detection limit of 0.75 μM based on the 3σ criterion. The method was further extended to the fluorescent labeling of cysteine-containing peptides, proteins, and living bacterial cells, showcasing the utility of Se–S covalent-directed chemistry as an analytical tool. This approach underscores the considerable potential of diglycosyldiselenide-based fluorescent probes for broader applications in biochemical research.
1. Introduction
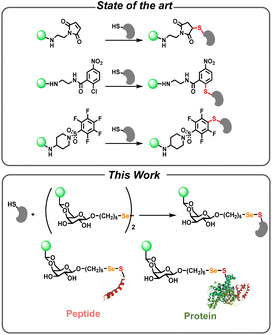
Sulfhydryl-containing biomolecules serve as essential components in various biological and physiological processes.1,2 In the reducing intracellular environment, it is estimated that over 90% of cysteine residues are maintained in the sulfhydryl form.3 This high prevalence is due to the sulfhydryl nucleophilic properties and their sensitivity to redox reactions.4 These properties enable sulfhydryl-containing biomolecules to participate in enzymatic catalysis, signal transduction, and structural stabilization within cellular environments. 5–9 Given the importance of sulfhydryl groups, their detection has become a critical focus for understanding their functions.10,11Various analytical techniques have been developed for the detection of sulfhydryl-containing biomolecules. The primary methods include high-performance liquid chromatography,12 mass spectrometry,13 electrochemical analysis,14 capillary electrophoresis,15 and fluorescence analysis.16–19 To track the functions of sulfhydryl-containing molecules in biological processes, fluorescent probe has become a powerful technique.18,20,21 These probes typically operate through mechanisms such as nucleophilic substitution, Michael addition, or cleavage reactions specific to sulfhydryl groups, which result in the production of a measurable fluorescent signal. Despite the development of several S-arylation-type bioconjugation chemistry, such as phenyloxadiazole,22,23 p-chloronitrobenzene,24–27 and fluorobenzene linkages,28,29 most of these probes lack good solubility (Scheme 1, top). Consequently, the most widely-used method for detecting of sulfhydryl-containing biomolecules still relies heavily on maleimide-functionalized fluorophores (Scheme 1, top). Maleimide chemistry offers high specificity and efficiency for sulfhydryl conjugation, as well as compatibility with a wide range of experimental conditions. 30–32 However, there are certain limitations and challenges associated with this approach. One primary issue is the reversible nature of the reaction between maleimide and sulfhydryl groups,33 leading to the detachment of the fluorophore from the conjugates.34 Additionally, the reaction process typically requires overnight incubation for the probe conjugation with the biomolecules.35
To address these challenges, there has been a growing interest in utilizing more robust hydrophilic conjugation chemistry as the backbone to modify conventional fluorescent probes.36–39 Galactose selenenylsulfide-linked (Se–S) chemistry, initially introduced by the Davis group,40 represents a groundbreaking approach for the modification of sulfhydryl-containing molecules.41–44 Bachrach et al. conducted a computational analysis of reaction mechanisms in selenium redox-active systems.45 In an experimental study, Sarma et al. provided a detailed investigation of the kinetics and mechanistic aspects of selenium-catalyzed reactions.46 Mugesh and co-authors explored the role of selenium-based compounds in catalyzing redox reactions.47 Despite the promising nature of this interaction, there are currently no reports detailing the application of Se–S covalent chemistry for the fluorescent detection of sulfhydryl-containing biomolecules.
In this study, we developed a diglycosyl diselenide fluorescent probe specifically tailored for Se–S directed conjugation for sulfhydryl group detection (Scheme 1, bottom). The probe was constructed from galactose diselenide with an anthracene fluorophore attached to each galactose moiety. We conducted extensive investigations into its spectroscopic properties and subsequently applied it to detect sulfhydryl-containing small molecules, peptides and proteins, as well as living bacterial cells, all within a rapid timeframe of just one hour. The development of Se–S directed glycosylation of sulfhydryl-containing biomolecules holds significant potential as a versatile linker in biocompatible materials.
2. Experimental section
2.1 Reagents
1,2,3,4,6-Penta-O-acetyl-α-D-galactose, selenium powder and 9-anthraldehyde was procured from Bidepharm, Shanghai. Bovine serum albumin was sourced from Sigma-Aldrich, Merck, USA. The peptides CAWSNAG, GAWSANG and CSWSANG utilized in this study were acquired from Sangon Biotech. 1,4-Dithiothreitol (DTT), papain, thioredoxin protein (TXN), oxidized glutathione (GSSG), glutathione (GSH), GSH inhibitor and β-nicotinamide-adenine dinucleotide phosphate (NADPH) were acquired from Sangon Biotech. Caspase-3 was acquired from MedChemExpress LLC. Escherichia coli (BL21) was employed as the bacterial strain.2.2 Characterizations
The 1H, 13C, and 77Se NMR spectra of the products were recorded using a Bruker DRX 400 MHz NMR spectrometer (Bruker, Germany). The fluorescence properties of compound 5 were analyzed using a fluorescence spectrometer (FS5, Edinburgh Instruments, UK) and fluorescence microplate reader (SpectraMax Gemini EM, Molecular Devices). The labeling of compounds with CAWSNAG, GAWSANG, and CSWSANG was monitored using LC-MS (MSQ PLUS/U3000). The molecular weight of compound 5 labeled with the peptide was detected using matrix-assisted laser desorption/ionization time-of-flight (MALDI-TOF) mass spectrometry on an UltrafleXtreme mass spectrometer (Bruker). The fluorescence imaging of Escherichia coli was characterized using a confocal fluorescence microscope (Zeiss LSM880NLO, Carl Zeiss, Germany).2.3 Preparation of compound 2
Compound 2 was synthesized following a procedure similar to those described in the literature.48,49 Briefly, 1,2,3,4,6-penta-O-acetyl-α-D-galactose (5.0 g, 12.8 mmol) was added to anhydrous toluene (10 mL) along with 5-bromo-1-pentanol (2.84 g, 17.0 mmol) and dried ZnCl2 (2.34 g, 17.1 mmol). The suspension was stirred at 60 °C for 8 hours. The dark brown reaction mixture was then quenched with 40 mL of ethyl acetate (EtOAc) and 20 mL of saturated sodium bicarbonate (NaHCO3) aqueous solution. The organic phase was separated and dried over anhydrous magnesium sulfate (MgSO4), followed by solvent removal. The resulting residue was purified by silica gel column chromatography, using a mixture of hexane and EtOAc (10![[thin space (1/6-em)]](https://www.rsc.org/images/entities/char_2009.gif) :
:![[thin space (1/6-em)]](https://www.rsc.org/images/entities/char_2009.gif) 1 to 8
1 to 8![[thin space (1/6-em)]](https://www.rsc.org/images/entities/char_2009.gif) :
:![[thin space (1/6-em)]](https://www.rsc.org/images/entities/char_2009.gif) 1 by volume), to afford the target product, compound 2 as a yellow sticky liquid (1.38 g, yield 21.6%).
1 by volume), to afford the target product, compound 2 as a yellow sticky liquid (1.38 g, yield 21.6%).
1H NMR (CDCl3, 400 MHz): δ 5.40 (dd, J = 3.4, 1.3 Hz, 1H), 5.34–5.24 (m, 1H), 5.08–5.04 (m, 2H), 4.17 (ddd, J = 7.4, 6.1, 1.4 Hz, 1H), 4.11–3.98 (m, 2H), 3.67 (dt, J = 9.9, 6.2 Hz, 1H), 3.45–3.32 (m, 3H), 2.10 (s, 3H), 2.03 (s, 3H), 2.00 (s, 3H), 1.94 (s, 3H), 1.87–1.83 (m, 2H), 1.64–1.54 (m, 2H), 1.48 (ddd, J = 11.5, 8.1, 5.1 Hz, 2H) ppm.
13C NMR (CDCl3, 101 MHz): δ 170.49, 170.31, 170.12, 96.15, 68.27, 68.21, 68.09, 67.64, 66.20, 33.65, 31.94, 28.48, 20.86, 20.77, 20.72, 20.70 ppm.
HR-MS [M(2 + Na)]+ calculated for C19H29BrO10Na 519.0944 u, found 519.0936 u.
2.4 Preparation of compound 3
Compound 3 was obtained through the deacetylation of its acetylated precursor using sodium methoxide in methanol. Sodium methoxide (0.04 g, 0.70 mmol) was added to a methanol solution (5.0 mL) containing 0.82 g (1.00 mmol) of the acetylated precursor (compound 2). The reaction mixture was stirred at room temperature for 2 hours. The pH was then adjusted to 7.0 using 1 M aqueous hydrochloric acid. The reaction solution was vacuum dried, yielding a colourless, transparent, sticky liquid product (0.26 g, 80.3% yield).1H NMR (D2O, 400 MHz): δ 4.86–4.82 (d, J = 3.6 Hz, 1H), 3.92–3.81 (d, J = 13.8 Hz, 2H), 3.77–3.68 (d, J = 12.9 Hz, 2H), 3.68–3.59 (d, J = 6.2 Hz, 3H), 3.48–3.40 (t, J = 6.7 Hz, 3H), 1.85–1.76 (d, J = 14.5 Hz, 2H), 1.61–1.51 (d, J = 6.5 Hz, 2H), 1.48–1.37 (d, J = 7.6 Hz, 2H) ppm.
13C NMR (CDCl3, 101 MHz): δ 98.76, 70.36, 69.83, 69.78, 68.87, 61.52, 33.91, 32.42, 28.55, 24.68 ppm.
HR-MS [M(3 + Na)]+ calculated for C11H21BrO6Na 351.0522 u, found 351.0510 u.
2.5 Preparation of compound 4
The synthesis was adapted from the reported literature.50,51 A mixture of 5-bromopentanyl-2,3,4,6-tetra-OH-α-D-galactoside (compound 3) (0.65 g, 2.00 mmol), anthracene dimethyl acetal (0.748 g, 2.97 mmol), and p-toluenesulfonic acid (38 mg) was stirred in 5 mL of acetonitrile (CH3CN) at room temperature for 16 hours. After this period, the reaction mixture was adjusted to pH 7.0 using triethylamine. The mixture was then extracted with 20 mL of dichloromethane (DCM). The organic phase was dried over anhydrous magnesium sulfate (MgSO4), filtered, and evaporated under reduced pressure to obtain the crude product. The crude product was purified by thin-layer chromatography using a solvent system of DCM/MeOH (10![[thin space (1/6-em)]](https://www.rsc.org/images/entities/char_2009.gif) :
:![[thin space (1/6-em)]](https://www.rsc.org/images/entities/char_2009.gif) 1) to afford the title compound as a yellow solid (compound 4, 0.57 g, 56% yield).
1) to afford the title compound as a yellow solid (compound 4, 0.57 g, 56% yield).
1H NMR (400 MHz, CDCl3): δ 8.73 (d, J = 8.5 Hz, 2H), 8.49 (s, 1H), 7.99 (d, J = 8.4 Hz, 2H), 7.55–7.41 (m, 4H), 6.91 (s, 1H), 5.21 (d, J = 3.6 Hz, 1H), 4.50–4.27 (m, 2H), 4.21 (dd, J = 12.6, 1.7 Hz, 1H), 4.02–3.76 (m, 4H), 3.65–3.37 (m, 3H), 2.53–2.14 (m, 2H), 1.97–1.85 (m, 2H), 1.75–1.61 (m, 2H), 1.61–1.50 (m, 2H) ppm.
13C NMR (101 MHz, CDCl3): δ 131.47, 129.80, 129.74, 128.92, 127.61, 126.16, 124.96, 99.32, 99.28, 69.98, 69.87, 69.80, 68.23, 63.20, 33.84, 32.40, 28.59, 24.74 ppm.
LC-MS [M(4 + H)]+ calculated for C26H30O6Br 519.1205 u, found 519.99 u.
2.6 Preparation of compound 5
Compound 5 was synthesized following a procedure analogous to those reported in the literature.52–54 In a nitrogen environment, selenium powder (0.21 g, 2.6 mmol) and 5.0 mL Milli-Q water were added. Under 0 °C conditions, sodium borohydride (0.2 g, 5.2 mmol) was added and stirred for 15 minutes. Another portion of selenium powder (0.21 g, 2.6 mmol) was then added, and the mixture was heated to 50 °C and stirred for 40 minutes to obtain a wine-red Na2Se2 solution. Subsequently, compound 4 was dissolved in 30 mL of anhydrous tetrahydrofuran and added to the Na2Se2 solution, followed by stirring at room temperature for 8 hours. After the reaction, the solid residue was removed by filtration. Ethyl acetate was added to dissolve the reaction mixture, followed by multiple washes with saturated sodium chloride solution. The organic phase was dried over anhydrous magnesium sulfate, filtered under reduced pressure, and the filtrate was collected. Ethyl acetate was removed by rotary evaporation to yield the crude product. The crude product was purified by column chromatography using an eluent of n-hexane and ethyl acetate in a volume ratio of 5![[thin space (1/6-em)]](https://www.rsc.org/images/entities/char_2009.gif) :
:![[thin space (1/6-em)]](https://www.rsc.org/images/entities/char_2009.gif) 1 to 2
1 to 2![[thin space (1/6-em)]](https://www.rsc.org/images/entities/char_2009.gif) :
:![[thin space (1/6-em)]](https://www.rsc.org/images/entities/char_2009.gif) 1, yielding a bright yellow powder (compound 5, 0.94 g, 29.1% yield).
1, yielding a bright yellow powder (compound 5, 0.94 g, 29.1% yield).
1H NMR (CDCl3, 400 MHz): δ 8.72 (d, J = 8.4 Hz, 2H), 8.50 (s, 1H), 8.00 (dd, J = 8.4, 1.5 Hz, 2H), 7.59–7.38 (m, 4H), 6.81 (s, 1H), 5.17 (d, J = 3.6 Hz, 1H), 4.34 (dd, J = 12.5, 1.7 Hz, 1H), 4.14–4.03 (m, 2H), 3.95 (dd, J = 10.0, 3.7 Hz, 1H), 3.89–3.74 (m, 2H), 3.62–3.51 (m, 2H), 2.98 (t, J = 7.3 Hz, 2H), 2.88–2.78 (m, 2H), 1.82 (q, J = 7.2 Hz, 2H), 1.70 (p, J = 6.9 Hz, 2H), 1.59–1.48 (m, 2H) ppm.
13C NMR (CDCl3, 101 MHz): δ 131.46, 129.73, 128.87, 127.70, 126.11, 124.97, 99.26, 69.94, 69.69, 68.18, 63.17, 30.71, 29.92, 28.91, 25.95 ppm.
77Se NMR (CDCl3, 76 MHz): δ 309.33 ppm.
MALDI-TOF-MS [M(5 + Na)]+ calculated for C52H58O12Se2Na 1057.2162 u, found 1057.2151 u.
2.7 Staining of natural proteins
Bovine serum albumin (BSA, 2.0 mg mL−1) was prepared in phosphate-buffered saline (pH 8.0). The protein was treated with tris(2-carboxyethyl)phosphine (TCEP) at a molar ratio of 10![[thin space (1/6-em)]](https://www.rsc.org/images/entities/char_2009.gif) :
:![[thin space (1/6-em)]](https://www.rsc.org/images/entities/char_2009.gif) 1 (TCEP to protein) to reduce disulfide bonds to free sulfhydryl groups. Following this treatment, the proteins were filtered using Zeba™ columns (Thermo Scientific™) to remove excess TCEP. The diluted proteins were subsequently incubated with compound 5 (0.5 mM) at 25 °C for 1 hour. The stained protein was further purified using Zeba™ columns and then subjected to SDS-PAGE. Visualization was performed by fluorescence using the UV channel. Caspase-3, papain, and thioredoxin protein were analyzed using the same protocol.
1 (TCEP to protein) to reduce disulfide bonds to free sulfhydryl groups. Following this treatment, the proteins were filtered using Zeba™ columns (Thermo Scientific™) to remove excess TCEP. The diluted proteins were subsequently incubated with compound 5 (0.5 mM) at 25 °C for 1 hour. The stained protein was further purified using Zeba™ columns and then subjected to SDS-PAGE. Visualization was performed by fluorescence using the UV channel. Caspase-3, papain, and thioredoxin protein were analyzed using the same protocol.
2.8 Imaging of Escherichia coli
E. coli cells were grown overnight in LB medium and subsequently diluted 1![[thin space (1/6-em)]](https://www.rsc.org/images/entities/char_2009.gif) :
:![[thin space (1/6-em)]](https://www.rsc.org/images/entities/char_2009.gif) 1000 in fresh LB medium. The cells were cultured until the optical density at 600 nm (OD600) reached 0.6. The culture was then centrifuged at 3000 rcf for 5 minutes, and the cell pellet was resuspended in phosphate-buffered saline (pH 8.0). Compound 5 was added to a final concentration of 1.0 mM, and the mixture was incubated at room temperature for 1 hour, protected from light. Following incubation, the cells were centrifuged at 2000 rcf for 10 minutes, and the cell pellet was resuspended in PBS. A 5.0 μL aliquot of the labeled cell suspension (OD600 = 0.6) was transferred onto a microscope cover slide and covered with an agarose gel pad. Bright-field images of the cells were captured using a Zeiss Axio Observer Z1 microscope equipped with a Hamamatsu Orca R2 camera. A Plan-Apochromat 100×/1.4 Oil Ph3 objective (Zeiss) was used, and fluorescence was visualized with filter set 63 HE. The micrographs were analyzed using ImageJ software.
1000 in fresh LB medium. The cells were cultured until the optical density at 600 nm (OD600) reached 0.6. The culture was then centrifuged at 3000 rcf for 5 minutes, and the cell pellet was resuspended in phosphate-buffered saline (pH 8.0). Compound 5 was added to a final concentration of 1.0 mM, and the mixture was incubated at room temperature for 1 hour, protected from light. Following incubation, the cells were centrifuged at 2000 rcf for 10 minutes, and the cell pellet was resuspended in PBS. A 5.0 μL aliquot of the labeled cell suspension (OD600 = 0.6) was transferred onto a microscope cover slide and covered with an agarose gel pad. Bright-field images of the cells were captured using a Zeiss Axio Observer Z1 microscope equipped with a Hamamatsu Orca R2 camera. A Plan-Apochromat 100×/1.4 Oil Ph3 objective (Zeiss) was used, and fluorescence was visualized with filter set 63 HE. The micrographs were analyzed using ImageJ software.
2.9 Protein extraction from cell lysate
HeLa cells were cultured and harvested by removing the medium and washing with ice-cold phosphate-buffered saline (pH 7.4) 2–3 times to eliminate residual culture medium and serum proteins. Cells were lysed by adding ice-cold lysis RIPA buffer (50 mM Tris–HCl, pH 7.4; 150 mM NaCl; 1% NP-40; 0.5% sodium deoxycholate; 0.1% SDS) supplemented with a protease inhibitor mixture. Cells were scraped gently with a cell scraper and the resulting lysate was collected into pre-chilled centrifuge tubes. The lysate was incubated on ice for 30 minutes, mixing gently every 5 minutes. Subsequently, the samples were centrifuged at 12![[thin space (1/6-em)]](https://www.rsc.org/images/entities/char_2009.gif) 000g for 15 minutes at 4 °C to remove cell debris, and the supernatant, containing the total protein extract, was transferred to new tubes for immediate use. Protein concentration was determined using a BCA protein assay kit, ensuring equal loading amounts across samples.
000g for 15 minutes at 4 °C to remove cell debris, and the supernatant, containing the total protein extract, was transferred to new tubes for immediate use. Protein concentration was determined using a BCA protein assay kit, ensuring equal loading amounts across samples.
2.10 SDS-PAGE analysis
Protein samples were mixed with an equal volume of 2× loading buffer to denature the proteins. The samples were then centrifuged briefly. Gels were prepared using 4–12% acrylamide, which were allowed to polymerize at room temperature for 30–60 minutes. The gel was assembled in an electrophoresis chamber filled with running buffer (25 mM Tris, 192 mM glycine, 0.1% SDS, pH 8.3). Samples, along with a protein marker, were loaded into the wells, and electrophoresis was performed at 80 V during the stacking gel phase, then increased to 120–150 V for the resolving gel phase until the bromophenol blue front approached the bottom of the gel. After electrophoresis, the gel was stained in Coomassie Blue fast staining solution for 1 hour, followed by destaining to clearly visualize protein bands.3. Results
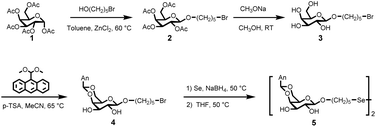
3.1 Synthesis of the probe
Initially, the economically viable commercial starting material α-D-galactose pentaacetate (compound 1) was transformed into 5-bromopentyl-2,3,4,6-tetra-O-acetyl-α-D-galactoside through a reaction with bromoalkyl alcohol using ZnCl2 as a catalyst. Following the deprotection of the acetyl groups, a brominated galactose derivative (compound 3) was prepared with a high yield of 80.3% (Fig. 1). Subsequently, the fluorophore derivative of anthracene dimethylacetal facilitated the esterification of the hydroxy groups at the 4- and 6-positions of the glucoside in the presence of p-toluenesulfonamide (p-TSA). The reaction was performed in MeCN for 16 hours, resulting in the formation of compound 4. The reaction of compound 4 with Se and NaBH4 proceeded via an SN2 substitution mechanism, resulting in the probe, compound 5, with a yield of 29.1%. All compounds were extensively characterized using mass spectrometry and nuclear magnetic resonance (NMR) spectroscopy, including 1H, 13C, and 77Se NMR (Fig. S1–S9, ESI†).3.2 Fluorescence properties of compound 5
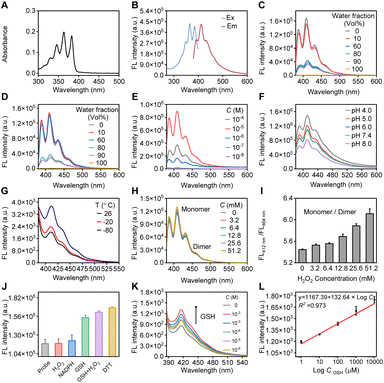
The spectroscopic properties of compound 5 were extensively investigated, as shown in Fig. 2. Under excitation at a maximum wavelength of 365 nm, which closely matches its absorption spectrum (Fig. 2A and B), the probe containing an anthracene fluorophore exhibits vibrationally structured fluorescence emission, with wavelengths in the range of 410–465 nm. These exact wavelengths varied depending on the environment surrounding the anthracene molecules, including solvent type and concentration.55,56 We optimized both the concentration and the detection medium. Given the property of the diselenium-bridged anthracene to stack in higher water percentages (Fig. 2C and D), we determined that the fluorescent signal is optimal at a probe concentration of 10−5 M in a methanol/PBS detection medium (Fig. 2E). This suggests that, at this concentration, the molecular interactions and environment are most conducive for anthracene to exhibit strong fluorescence, likely due to a balance between solvation and molecular structure. At this optimal concentration and solvent medium, we conducted studies on the effects of pH, temperature, and external stimuli on the probe. In phosphate buffer, the probe maintained its fluorescence well at a physiological pH of 7.4 (Fig. 2F). Although lower temperatures inhibit intramolecular rotation, leading to the closure of non-radiative decay pathways and thereby enhancing fluorescence,57 in our case, temperature had a minor effect on the probe, with the fluorescence intensity remaining within the same order of magnitude (Fig. 2G). Consequently, all tests were conducted under room temperature conditions. Biological substances containing sulfhydryl groups including GSH and DTT had a more pronounced impact on the fluorescence of the probe compared to other common bilogical analytes (Fig. 2J). Following incubation of the probe with GSH solutions at varying concentrations (10−2 M to 10−6 M), fluorescence detection was performed using a microplate reader (Fig. 2K). The experimental data revealed a progressive increase in the fluorescence signal with increasing GSH concentrations. Furthermore, a linear correlation between fluorescence intensity and GSH concentration was established (FI = 1167.39 + 132.64 × log![[thin space (1/6-em)]](https://www.rsc.org/images/entities/char_2009.gif) C, Fig. 2L), from which the detection limit, based on the 3σ criterion, was calculated to be 0.75 μM. More specifically, the diselenide bond exhibits redox-specific cleavability in the presence of the oxidative agent H2O2 (Fig. 2H), enabling the regulation of the fluorophore monomers and dimers. With the incremental addition of H2O2, the monomer signal at 412 nm gradually increased, while the aggregate signal around 464 nm progressively decreased. By analyzing the ratio of monomer to dimer signals, a direct proportional relationship with the concentration of the redox agents was observed (Fig. 2I). These properties are essential for potential applications in bioanalytical contexts, particularly where precise control and detection of fluorescence signals are crucial.
C, Fig. 2L), from which the detection limit, based on the 3σ criterion, was calculated to be 0.75 μM. More specifically, the diselenide bond exhibits redox-specific cleavability in the presence of the oxidative agent H2O2 (Fig. 2H), enabling the regulation of the fluorophore monomers and dimers. With the incremental addition of H2O2, the monomer signal at 412 nm gradually increased, while the aggregate signal around 464 nm progressively decreased. By analyzing the ratio of monomer to dimer signals, a direct proportional relationship with the concentration of the redox agents was observed (Fig. 2I). These properties are essential for potential applications in bioanalytical contexts, particularly where precise control and detection of fluorescence signals are crucial.
3.3 Labeling of peptide using compound 5
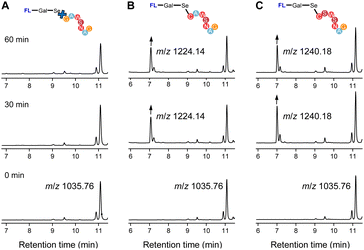
To evaluate the feasibility of Se–S labeling using our probe, we employed short peptides containing cysteine (C) (Fig. 3). The labeling efficiency of two heptapeptides, CAWSNAG (containing cysteine) and GAWSNAG (lacking cysteine), was comparatively analyzed using compound 5 in PBS buffer (0.1 M, pH 8.0) at room temperature. Liquid chromatography-mass spectrometry (LC-MS) analysis confirmed the successful labeling of CAWSNAG (m/z = 707.38) into a product identified as fluorophore–Gal–Se–S–CAWSNAG ([M + H]+, m/z 1224.14) (Fig. 3B).The signal intensity increased with prolonged reaction times, with optimal labeling observed after 1 hour. Additionally, matrix-assisted laser desorption/ionization time-of-flight mass spectrometry (MALDI-TOF-MS) further confirmed the formation of a stable conjugate, fluorophore–Gal–Se–S–CAWSNAG ([M + Na]+, m/z = 1246.428), under the same conditions and within the same time frame (Fig. S10, ESI†). Notably, no significant labeling signal was detected in the reaction between compound 5 and GAWSNAG (Fig. 3A), underscoring the essential role of the cysteine –SH group in the labeling process. Subsequently, we employed a different peptide chain to evaluate the universality of the probe labeling. Incubation with compound 5 led to the conversion of CSWSNAG (m/z = 723.749) into fluorophore–Gal–Se–S–CSWSNAG ([M + H]+, m/z 1240.18), as monitored by LC-MS within one hour (Fig. 3C). These results underscore the Se–S labeling strategy is independent of the specific composition of the peptide chain, provided that a cysteine residue with a sulfhydryl modification is present at the terminal end.The stability of the peptide labeled with the probe via Se–S covalent chemistry was evaluated in the presence of additional GSH, as analyzed by LC-MS (Fig. S11, ESI†). The probe was first co-incubated with the target peptide (CAWSNAG), after which GSH solutions of varying concentrations were added. Before the addition of GSH, peaks corresponding to the anthracene-sugar probe (tR = 11.05 min) and the anthracene-peptide conjugate (tR = 7.09 min) were observed. Upon the addition of GSH at concentrations between 0.5 and 8.0 μM, no new derivative signals appeared. However, when the GSH concentration was increased to 30 μM, a new peak at tR = 7.27 min, attributed to the conjugate of the probe with GSH, was detected. At this stage, mass spectrometry analysis revealed a mixture of the probe-peptide conjugate (m/z = 1223.27) and the probe-GSH reaction product (m/z = 824.05). At higher GSH concentrations (120 μM), the system began transitioning toward the formation of a probe-GSH adduct. Even after 2 hours of exposure to elevated GSH concentrations (1.0 mM), 26% of the original probe-peptide complex remained intact (Fig. S12, ESI†). Notably, the addition of oxidized glutathione (GSSG, 1.0 mM) had no discernible effect on the probe-peptide conjugate (Fig. 4). Furthermore, in the presence of both GSH and the competitive inhibitor N-ethylmaleimide (NEM, 1.0 mM, at a 1![[thin space (1/6-em)]](https://www.rsc.org/images/entities/char_2009.gif) :
:![[thin space (1/6-em)]](https://www.rsc.org/images/entities/char_2009.gif) 1 ratio), the probe–peptide conjugate remained unaffected (Fig. 4). Consequently, GSH concentrations below 10 μM, as well as the presence of NEM or oxidative conditions, did not significantly influence the stability of the Se–S-labeled peptide conjugate. In contrast, at GSH concentrations exceeding millimolar levels, the system favored the formation of a covalent probe-GSH product via thiol–exchange reactions, a phenomenon consistent with previous studies. 45,46,58,59
1 ratio), the probe–peptide conjugate remained unaffected (Fig. 4). Consequently, GSH concentrations below 10 μM, as well as the presence of NEM or oxidative conditions, did not significantly influence the stability of the Se–S-labeled peptide conjugate. In contrast, at GSH concentrations exceeding millimolar levels, the system favored the formation of a covalent probe-GSH product via thiol–exchange reactions, a phenomenon consistent with previous studies. 45,46,58,59
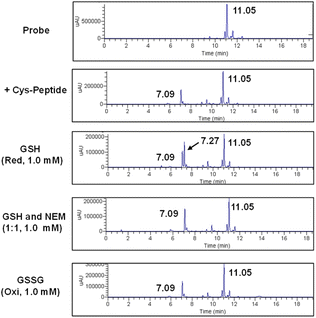 | ||
| Fig. 4 LC-MS analysis of the probe-peptide conjugate in the presence of different reaction conditions. | ||
3.4 Staining sulfhydryl-containing proteins using compound 5
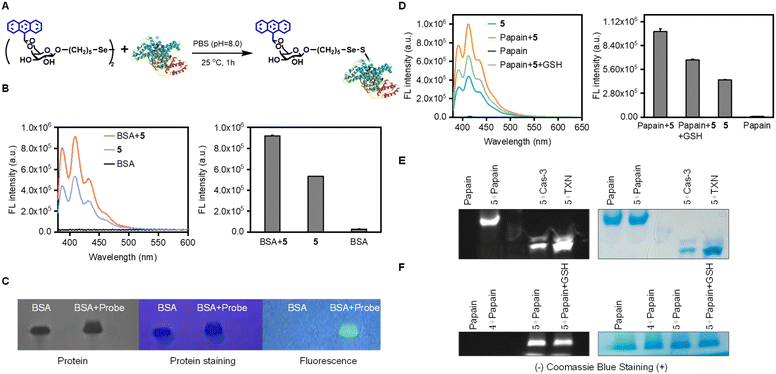
After confirming the successful labeling of the peptide, we further verified its potential for tracking proteins and live cells by applying our Se–S linkage strategy (Fig. 5). Bovine serum albumin (BSA) was chosen as the model protein due to its well-characterized structure and the presence of a single sulfhydryl group on the cysteine residue at position 34 in the primary amino acid sequence,60,61 making it an ideal target for demonstrating selective sulfhydryl labeling. The modification was performed in a pH 8.0 PBS buffer in the presence of air (Fig. 5A). Using a mildly alkaline buffered environment helps maintain pH stability during the reaction, which is crucial for the specificity and efficiency of sulfhydryl labeling. SDS-PAGE analysis validated the success of BSA modification using our probe (Fig. 5C). The appearance of a distinct band corresponding to the labeled BSA by compound 5, absent in control samples, provided clear evidence of protein modification. An increase in fluorescence intensity in the modified BSA sample compared to the control further indicated successful binding of the fluorescently labeled probe (Fig. 5B).We subsequently tested the probe on a range of cysteine proteases, including caspase-3 and papain, as well as on non-protease cysteine-containing proteins, such as thioredoxin. SDS-PAGE and fluorescence turn-on assays were conducted (Fig. 5D–F), similar to the experiments performed with BSA, both in the presence and absence of reduced glutathione. The SDS-PAGE results revealed distinct fluorescent bands corresponding to proteins incubated with the diselenide fluorescent probe (compound 5), confirming successful labeling of papain, caspase-3, and thioredoxin—proteins containing cysteine residues (Fig. 5E). When co-treated with GSH in the papain labeling system, fluorescently labeled protein bands were still detectable (Fig. 5F), although with reduced fluorescence intensity (Fig. 5D). In contrast, when compound 4, which lacks the diselenide bond, was incubated with papain and subjected to SDS-PAGE, no significant fluorescent bands were observed, indicating that compound 4 does not respond to these sulfhydryl-containing proteins.
Our investigation was further extended to mammalian cell lysates derived from HeLa cancer cells, which contain a diverse array of cysteine-rich proteins.62 Following cell lysis and protein extraction, the lysates were co-incubated with our compounds. The resulting protein-compound complexes were then purified via ultrafiltration, quantified using the BCA assay, and analyzed by SDS-PAGE (Fig. 6). Fluorescence imaging revealed distinct bands corresponding to proteins labeled by compound 5, which contains a diselenide bond. In contrast, minimal fluorescence was detected for compound 4, which lacks the diselenide bond. These findings reinforce our initial claims that the probe could serve as a labelling tool for studying proteins in biological systems.
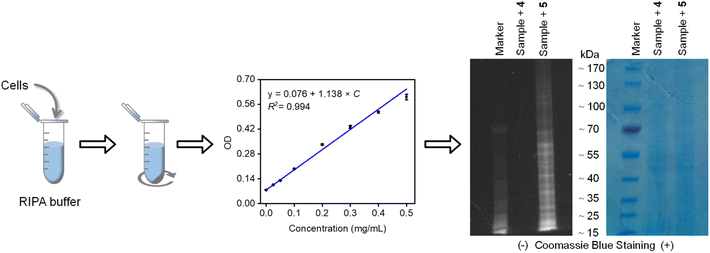 | ||
| Fig. 6 SDS-PAGE analysis of proteins extracted from cell lysate and incubated with compounds 4 and 5, before and after Coomassie blue staining. | ||
Finally, the probe was employed for fluorescent imaging of live Escherichia coli (E. coli) bacterial cells.63 Cells were grown and incubated with compound 5 to achieve staining (Fig. S13A, ESI†). Washed E. coli cells, after incubation with the probe, exhibited bright blue fluorescence within 60 minutes when observed using a confocal fluorescence microscope (Fig. S13B, ESI†). This rapid cellular uptake of our probe is beneficial for the subsequent labeling of sulfhydryl-containing biomolecules within the cells. In contrast, compound 4, which features an anthracene fluorophore lacking diselenide bridge chains, did not exhibit fluorescence after cell incubation, thereby demonstrating the specificity of the Se–S conjugation. After incubating the probe with E. coli, bacterial activity was measured at 600 nm at various time points (Fig. S14, ESI†). Compared to the control group, which was not incubated with the probe, bacterial growth in the presence of the probe was modestly inhibited. The extent of this inhibition showed a positive correlation with the concentration of the probe. The results underscore the potential utility of the probe as both a fluorescent marker and a growth-inhibitory agent, offering a dual-functional approach for studying sulfhydryl biology in bacterial systems.
4. Discussion and conclusion
This study demonstrates the potential of a diselenide fluorescent probe for the specific detection of sulfhydryl groups of biomolecules. However, the probe's effectiveness is limited by the high concentrations of glutathione (GSH) typically found in cellular environments. Nonetheless, it remains a viable tool for applications in simpler systems where GSH levels are either low (less than 10 μM) or manageable, such as under conditions where GSH is oxidized to glutathione disulfide (GSSG) or in the presence of a GSH inhibitor. Our investigation into the effects of sulfhydryl-containing bioactive molecules on Se–S covalent labeling revealed the following (Fig. S15, ESI†): (1) DTT at concentrations higher than 10 mM disrupts the Se–S bond, forming selenol, but no disruption occurs at lower concentrations. (2) Reduced glutathione acts as a nucleophile, targeting selenium after Se–S labeling. At concentrations above 10 μM, GSH partially forms Se–SG adducts via an addition–elimination mechanism, without breaking the Se–S bond. (3) Oxidized glutathione does not affect Se–S conjugation at any concentration. We propose that in biological systems, the Se–S bond remains stable in the absence of high DTT concentrations, and the redox balance between GSH and GSSG restricts complete product conversion.In conclusion, this study presents the design and application of a diglycosyldiselenide probe with an incorporated fluorophore for the rapid fluorescent detection of sulfhydryl-containing biomolecules, including the low molecular weight tripeptide glutathione, as well as cysteine-containing peptides and proteins. The probe enables the quick formation of homogeneous Se–S conjugates and has proven effective for fluorescent staining of living bacterial cells. This method holds potential applications in studying sulfhydryl-containing biomolecules. Future investigations will be designed to optimize its utility in broader contexts, potentially contributing to advancements in specific bioanalytical chemistry.
Data availability
The data for this article, including all figures and tables in both the manuscript and ESI,† are available upon request from the authors.Author contributions
S. J. conceived the idea. C. Q. M. and S. J. directed the project. J. C. X., X. L. W. and X. W. W. performed the experiments. C. Q. M., L. Z. and S. J. conducted the data analysis. S. J. wrote the manuscript. All authors discussed the results and commented on the manuscript.Conflicts of interest
There are no conflicts to declare.Acknowledgements
This work is funded by the National Natural Science Foundation of China (Grant No. 22175090 and 22374075) and the Primary Research & Development Plan of Jiangsu Province (BE2021712).Notes and references
- S. M. Couvertier, Y. Zhou and E. Weerapana, Biochim. Biophys. Acta, Proteins Proteomics, 2014, 1844, 2315–2330 CrossRef CAS.
- C. E. Paulsen and K. S. Carroll, Chem. Rev., 2013, 113, 4633–4679 CrossRef CAS PubMed.
- R. C. Fahey, J. S. Hunt and G. C. Windham, J. Mol. Evol., 1977, 10, 155–160 CrossRef CAS PubMed.
- L. B. Poole, Free Radical Biol. Med., 2015, 80, 148–157 CrossRef CAS PubMed.
- C. Lennicke and H. M. Cochemé, Biochem. Soc. Trans., 2020, 48, 367–377 CrossRef CAS.
- N. M. Giles, G. I. Giles and C. Jacob, Biochem. Biophys. Res. Commun., 2003, 300, 1–4 CrossRef CAS PubMed.
- S. M. Marino and V. N. Gladyshev, J. Mol. Cell Biol., 2010, 404, 902–916 CAS.
- A. Miseta and P. Csutora, Mol. Biol. Evol., 2000, 17, 1232–1239 CrossRef CAS.
- X. Ling, H. Chen, W. Zheng, L. Chang, Y. Wang and T. Liu, Chin. Chem. Lett., 2020, 31, 163–166 CrossRef CAS.
- R. J. Taylor, M. B. Geeson, T. Journeaux and G. J. L. Bernardes, J. Am. Chem. Soc., 2022, 144, 14404–14419 CrossRef CAS PubMed.
- L.-Q. Wan, X. Zhang, Y. Zou, R. Shi, J.-G. Cao, S.-Y. Xu, L.-F. Deng, L. Zhou, Y. Gong, X. Shu, G. Y. Lee, H. Ren, L. Dai, S. Qi, K. N. Houk and D. Niu, J. Am. Chem. Soc., 2021, 143, 11919–11926 CrossRef CAS.
- J. Piechocka, M. Wyszczelska-Rokiel and R. Głowacki, Sci. Rep., 2023, 13, 9294 CrossRef CAS PubMed.
- L. Guo, C. Xiao, S. Wang, T. Gao, L. Ling and X. Guo, J. Am. Soc. Mass Spectrom., 2019, 30, 625–633 CrossRef CAS PubMed.
- S. Nagabooshanam, A. Kumar, S. Ramamoorthy, N. Saravanan and A. Sundaramurthy, Chemosphere, 2024, 346, 140517 CrossRef CAS PubMed.
- A. V. Ivanov, M. A. Popov, V. V. e. Aleksandrin, L. M. Kozhevnikova, A. A. Moskovtsev, M. P. Kruglova, S. E. Vladimirovna, S. V. Aleksandrovich and A. A. Kubatiev, Electrophoresis, 2022, 43, 1859–1870 CrossRef CAS PubMed.
- Y. Yue, F. Huo and C. Yin, Chem. Sci., 2021, 12, 1220–1226 RSC.
- W. Liu, J. Chen and Z. Xu, Coord. Chem. Rev., 2021, 429, 213638 CrossRef CAS.
- S. Zheng, J. Peng, L. Jiang, H. Gu, F. Wang, C. Wang, S. Lu and X. Chen, Sens. Actuators, B, 2022, 367, 132148 CrossRef CAS.
- X. Chen, Y. Zhou, X. Peng and J. Yoon, Chem. Soc. Rev., 2010, 39, 2120–2135 RSC.
- M. S. T. Gonçalves, Chem. Rev., 2009, 109, 190–212 CrossRef.
- Y.-F. Kang, L.-Y. Niu and Q.-Z. Yang, Chin. Chem. Lett., 2019, 30, 1791–1798 CrossRef CAS.
- A. Farrukh, J. I. Paez, M. Salierno and A. del Campo, Angew. Chem., Int. Ed., 2016, 55, 2092–2096 CrossRef CAS PubMed.
- Y. Zhang, C. Yang, S. Peng, J. Ling, P. Chen, Y. Ma, W. Wang, Z. Chen and C. Chen, J. Am. Chem. Soc., 2023, 145, 4187–4198 CrossRef CAS.
- C. Zhang, E. V. Vinogradova, A. M. Spokoyny, S. L. Buchwald and B. L. Pentelute, Angew. Chem., Int. Ed., 2019, 58, 4810–4839 CrossRef CAS PubMed.
- P. Adumeau, M. Davydova and B. M. Zeglis, Bioconjugate Chem., 2018, 29, 1364–1372 CrossRef CAS.
- I. Bibi, S. Mushtaq, K. C. Lee, J. A. Park and J. Y. Kim, Theranostics, 2024, 14, 2396–2426 CrossRef CAS PubMed.
- D. A. Shannon, R. Banerjee, E. R. Webster, D. W. Bak, C. Wang and E. Weerapana, J. Am. Chem. Soc., 2014, 136, 3330–3333 CrossRef CAS PubMed.
- W. D. G. Brittain and C. R. Coxon, Chem. Eur. J., 2022, 28, e202103305 CrossRef CAS PubMed.
- A. M. Embaby, S. Schoffelen, C. Kofoed, M. Meldal and F. Diness, Angew. Chem., Int. Ed., 2018, 57, 8022–8026 CrossRef CAS PubMed.
- P. Adumeau, S. K. Sharma, C. Brent and B. M. Zeglis, Mol. Imaging Biol., 2016, 18, 1–17 CrossRef CAS PubMed.
- F. M. Veronese, Biomaterials, 2001, 22, 405–417 CrossRef CAS PubMed.
- N. Joubert, C. Denevault-Sabourin, F. Bryden and M.-C. Viaud-Massuard, Eur. J. Med. Chem., 2017, 142, 393–415 CrossRef CAS PubMed.
- A. D. Baldwin and K. L. Kiick, Bioconjugate Chem., 2011, 22, 1946–1953 CrossRef CAS PubMed.
- K. Renault, J. W. Fredy, P.-Y. Renard and C. Sabot, Bioconjugate Chem., 2018, 29, 2497–2513 CrossRef CAS.
- A. Petrelli, R. Borsali, S. Fort and S. Halila, Chem. Commun., 2016, 52, 12202–12205 RSC.
- S. V. Moradi, W. M. Hussein, P. Varamini, P. Simerska and I. Toth, Chem. Sci., 2016, 7, 2492–2500 RSC.
- X.-P. He, Y. Zang, T. D. James, J. Li, G.-R. Chen and J. Xie, Chem. Commun., 2017, 53, 82–90 RSC.
- S. Cecioni and D. J. Vocadlo, J. Am. Chem. Soc., 2017, 139, 8392–8395 CrossRef CAS.
- D. Wu, D. Wang, X. Ye, K. Yuan, Y. Xie, B. Li, C. Huang, T. Kuang, Z. Yu and Z. Chen, Chin. Chem. Lett., 2020, 31, 1504–1507 CrossRef CAS.
- O. Boutureira, G. J. L. Bernardes, M. Fernández-González, D. C. Anthony and B. G. Davis, Angew. Chem., Int. Ed., 2012, 51, 1432–1436 CrossRef CAS PubMed.
- C. Jacob, G. I. Giles, N. M. Giles and H. Sies, Angew. Chem., Int. Ed., 2003, 42, 4742–4758 CrossRef CAS.
- V. Diemer, N. Ollivier, B. Leclercq, H. Drobecq, J. Vicogne, V. Agouridas and O. Melnyk, Nat. Commun., 2020, 11, 2558 CrossRef CAS.
- J. Beld, K. J. Woycechowsky and D. Hilvert, Biochemistry, 2007, 46, 5382–5390 CrossRef CAS.
- L. Zeisel, J. G. Felber, K. C. Scholzen, L. Poczka, D. Cheff, M. S. Maier, Q. Cheng, M. Shen, M. D. Hall, E. S. J. Arnér, J. Thorn-Seshold and O. Thorn-Seshold, Chem, 2022, 8, 1493–1517 CAS.
- S. M. Bachrach, D. W. Demoin, M. Luk and J. V. Miller, J. Phys. Chem. A, 2004, 108, 4040–4046 CrossRef CAS.
- B. K. Sarma and G. Mugesh, J. Am. Chem. Soc., 2005, 127, 11477–11485 CrossRef CAS.
- K. M. Reddy and G. Mugesh, RSC Adv., 2019, 9, 34–43 RSC.
- J. C. Kim, Y. Rho, G. Kim, M. Kim, H. Kim, I. J. Kim, J. R. Kim and M. Ree, Polym. Chem., 2013, 4, 2260–2271 RSC.
- T. Murakami, R. Hirono, Y. Sato and K. Furusawa, Carbohydr. Res., 2007, 342, 1009–1020 CrossRef CAS.
- A. D. Ludwig, A. Saint-Jalmes, C. Mériadec, F. Artzner, O. Tasseau, F. Berrée and L. Lemiègre, Chem.–Eur. J., 2020, 26, 13927–13934 CrossRef CAS.
- R. S. Mancini, J. B. Lee and M. S. Taylor, J. Org. Chem., 2017, 82, 8777–8791 CrossRef CAS.
- D. L. Klayman and T. S. Griffin, J. Am. Chem. Soc., 1973, 95, 197–199 CrossRef CAS.
- K. H. Tan, W. Xu, S. Stefka, D. E. Demco, T. Kharandiuk, V. Ivasiv, R. Nebesnyi, V. S. Petrovskii, I. I. Potemkin and A. Pich, Angew. Chem., Int. Ed., 2019, 58, 9791–9796 CrossRef CAS PubMed.
- S. André, K. E. Kövér, H.-J. Gabius and L. Szilágyi, Bioorg. Med. Chem. Lett., 2015, 25, 931–935 CrossRef PubMed.
- E. A. Chandross, J. Ferguson and E. G. McRae, J. Chem. Phys., 1966, 45, 3546–3553 CrossRef CAS.
- S. Abou-Hatab, V. A. Spata and S. Matsika, J. Phys. Chem. A, 2017, 121, 1213–1222 CrossRef CAS PubMed.
- H. Lu, B. Xu, Y. Dong, F. Chen, Y. Li, Z. Li, J. He, H. Li and W. Tian, Langmuir, 2010, 26, 6838–6844 CrossRef CAS PubMed.
- S. G. Ouellet, J. B. Tuttle and D. W. C. MacMillan, J. Am. Chem. Soc., 2005, 127, 32–33 CrossRef CAS PubMed.
- A. Canal-Martín and R. Pérez-Fernández, Nat. Commun., 2021, 12, 163 CrossRef PubMed.
- S. Ariyasu, H. Hayashi, B. Xing and S. Chiba, Bioconjugate Chem., 2017, 28, 897–902 CrossRef CAS.
- G. Li, Y. Dao, J. Mo, S. Dong, S.-i. Shoda and X.-S. Ye, CCS Chem., 2021, 4, 1930–1937 CrossRef.
- R. Wang, D. Yang, T. Tian, Y. An, C. Wan, Q. Chang, M. Liang, Z. Hou, Y. Wang, L. Zhang and Z. Li, Anal. Chem., 2022, 94, 4366–4372 CrossRef CAS.
- L. Zhang, M. Isselstein, J. Köhler, N. Eleftheriadis, N. M. Huisjes, M. Guirao-Ortiz, A. Narducci, J. H. Smit, J. Stoffels, H. Harz, H. Leonhardt, A. Herrmann and T. Cordes, Angew. Chem., Int. Ed., 2022, 61, e202112959 CrossRef CAS.
Footnote |
| † Electronic supplementary information (ESI) available. See DOI: https://doi.org/10.1039/d4ra05923a |
| This journal is © The Royal Society of Chemistry 2024 |

