 Open Access Article
Evaluating the combined estrogenic effects of plant growth regulators via electrochemical and E-Screen methods†
Xijie Wanga,
Zijia Zhaoa,
Shulan Qia,
Zan Lia,
Zhong Wangbc,
Shi Zhou *ab,
Jiwen Cui*ab,
Jinlian Li*ab and
Dongmei Wu
 ab
ab
aCollege of Pharmacy, Jiamusi University, Jiamusi, Heilongjiang 154007, P. R. China. E-mail: zhous146@nenu.edu.cn; cjwhljjms@163.com; lijinlian@jmsu.edu.cn
bHeilongjiang Provincial Key Laboratory of New Drug Development and Pharmacotoxicological Evaluation, Jiamusi University, Jiamusi 154007, China
cCollege of Biology and Agriculture, Jiamusi University, Jiamusi, Heilongjiang 154007, P. R. China
First published on 18th November 2024
Abstract
The study shows that plant growth regulators (PGRs) have estrogenic effects, which may disrupt the normal physiological functions of endogenous estrogen in organisms. This study used electrochemical methods to investigate the electrochemical behavior and estrogenic effects of PGRs gibberellic acid (GA3), ethylene (ETH), and naphthalene acetic acid (NAA) on estrogen-free human breast cancer cells (MCF-7) cells when exposed individually or in combination. The results indicate that GA3, ETH, and NAA, whether used alone or in combination, exhibit estrogenic effects on MCF-7 cells. The accuracy of the electrochemical method was validated against the E-Screen method, with consistent results between the two methods. Analysis of the combined estrogenic effects of PGRs detected by electrochemical and E-Screen methods revealed antagonistic effects for GA3/ETH, synergistic effects for GA3/NAA, additive effects for NAA/ETH, and synergistic effects for GA3/ETH/NAA. The combined estrogenic effects of PGRs at environmental actual concentration ratios detected by the electrochemical method were consistent with the results of the E-Screen method. This study successfully established a simple, fast, sensitive, and low-cost electrochemical detection method for the combined estrogenic effects of PGRs, providing a new approach for detecting such effects.
1. Introduction
PGRs also known as plant hormones, are a class of artificially synthesized organic compounds that have effects similar to those of natural plant hormones.1 They are widely used in agricultural production to effectively regulate the growth and development processes of crops, achieving goals such as increasing yield stability, improving quality, and enhancing crop resistance.2 Common PGRs include GA3, ETH, and NAA.3 According to reports, the amounts of these substances placed into the environment may soon exceed those of insecticides. 4,5 The entry of PGRs into the human body can occur through the ingestion of food, consumption of drinking water, inhalation of air, and contact with the skin. Prolonged consumption of food containing residues of PGRs may have chronic toxic effects on the human body, causing health issues such as immune system disruption, nervous system dysfunction, endocrine system disorders, and even resulting in diseases such as cancer.6,7Research has shown that PGRs have estrogenic effects, which can disrupt the normal physiological function of endogenous estrogen in organisms. This leads to a decrease in sperm count and quality in males, abnormal development of the female reproductive system, and a significant increase in the incidence of diseases such as breast cancer, uterine fibroids, and endometrial cancer.8–11 For example,GA3 may act synergistically with exogenous or endogenous estrogen and produce an enhanced growth of uterine tissue.8 Exposure to 6-Benzylaminopurine increase production of estradiol (E2) and consequently E2/T ratio in zebrafish larvae, which directly indicated 6-BA is estrogenic. 9 Forchlorfenuron may promote estradiol secretion, resulting in altered vaginal opening time and first estrus time and adverse effects in prepubertal female rats.10,11 Although attention has been paid to the estrogenic effects of PGRs, research on the combined estrogenic effects of PGRs is limited. With the use of multiple PGRs during the plant growth cycle, evaluating the combined estrogenic effects of PGRs holds significant research value.
The detection methods for estrogenic effects can be divided into in vivo and in vitro experiments. In vivo experiments include uterine weight gain experiments, fish experiments, etc. However, due to the different metabolic mechanisms in humans and animals, there are certain deviations in the obtained results. In addition, in vivo experiments are time-consuming, expensive, and do not comply with the “3R” principle.12–14 In vitro experiments include recombinant yeast systems and yeast two-hybrid methods, ER assay kit detection, MCF-7 cell proliferation assay (E-Screen), 15,16 etc. However, yeast cells cannot accurately reflect the actual effects of estrogen on mammalian and aquatic organism cells, necessitating the use of biotechnology and molecular biology methods. ER assay kits are expensive and generate a large amount of waste as they are not reusable.
The E-Screen assay is a classic method for evaluating the estrogenic activity of chemical substances, it can be used to screen substances with estrogen-like effects. For example, when studying natural compounds or environmental pollutants, estrogenic activity can be assessed by comparing cell proliferation under different conditions. E-Screen assay using estrogen-dependent MCF-7 cells as model cells. In order to improve the sensitivity of MCF-7 cells to exogenous estrogen, it is necessary to remove the endogenous estrogen of MCF-7 cells. 17 However, E-Screen assay in addition to expressing estrogen receptors, the E-Screen assay can also express androgen receptors, progesterone receptors, glucocorticoid receptors, etc., which can lead to inaccurate experimental results, as well as increased costs and reduced repeatability. Although the E-Screen assay has certain limitations, its high sensitivity and ease of operation have led to its widespread use in detecting estrogenic effects. Therefore, this article chooses to compare the E-Screen assay with electrochemical methods to test the accuracy of the electrochemical approach. It is evident that the existing methods for detecting estrogenic effects have their shortcomings.18–21 Therefore, it is imperative to develop a new, simple, fast, and sensitive method for detecting estrogenic effects.
The electrochemical method, with its advantages of small equipment size, simple operation, rapid detection, high sensitivity, and low cost, has been used for assessing of estrogenic effects of environmental hormones such as estradiol, nonylphenol, and bisphenol A. The results obtained from this method are consistent with those of the conventional E-Screen assay. The electrochemical method, which utilizes purine as a biomarker, has opened new ideas and approaches for evaluating the estrogenic effects of chemical substances.22–26 In this study, the estrogen-free MCF-7 were used as model cells, and the electrochemical method was employed to investigate the effects of single and combined (at equimolar concentrations) exposure of PGRs GA3, ETH, and NAA on the electrochemical behavior of MCF-7 cells. The correlation between the results of the electrochemical method and the E-Screen assay in detecting estrogenic effects was analyzed, and the feasibility of using the electrochemical method to detect combined estrogenic effects of PGRs was verified. The CI and AI models were used to analyze the types of combined estrogenic effects of PGRs, and the differences in detecting the types of combined estrogenic effects between the electrochemical method and the E-Screen assay were examined. Finally, the simulated environmental actual concentration was used to verify the combined estrogenic effects of PGRs, laying a theoretical and experimental foundation for establishing a new electrochemical method for the simple, rapid, sensitive, low-cost, and label-free detection of the combined estrogenic effects of PGRs. And then, opens up new avenues for the detection of the combined estrogenic effects of PGRs.
2. Materials and methods
2.1 Chemicals and materials
E2 activated carbon, dextran, uric acid, hypoxanthine, guanine, xanthine and adenine were purchased from Sigma-Aldrich Company, USA. GA3 ETH and NAA were purchased from Shanghai Maclin Biochemical Technology, China. The glassy carbon electrode (GCE) was purchased from Gaossunion, China. High purity multiwall carbon nanotube (MWCNTs, 10–20 nm in diameter) was purchased from Shenzhen Nanotech Port Co., China. Fetal bovine serum (FBS), culture media and growth supplements were purchased from Gibco (Grand Island, USA). All other chemicals were of analytical grade.2.2 Preparation of estrogen-free fetal bovine serum
Dextran (50 mg) was added to 10 mL of FBS and stirred for 5 min. Then, 500 mg of activated carbon was added and evenly stirred for 5 min. The mixture was inactivated using a water bath shaker at 56 °C for 30 min. Subsequently, the mixture was centrifuged at 1000 rmp for 10 min, and the precipitate was discarded. The above operation was repeated, and then the mixture was passed through 0.45 and 0.22 μm membrane filtrations. Finally, estrogen-free fetal bovine serum was obtained.2.3 In vitro cell culture and pharmaceutical intervention
The MCF-7 cell line was obtained from the Chinese Collection of Authenticated Cell Cultures, culture of normal MCF-7 cells and estrogen-free MCF-7 refer to the previous method.27,28The estrogen-free MCF-7 cells were seeded in 60 mm culture dishes at a density of 1 × 10⁶ cells per dish or 1 × 10 −5 cell per well and treated with PGRs or E2 for 72 h, and 0.1% ethanol was used as negative control group.
2.4 E-Screen assay
This assay, introduced by Soto et al., is based on the estrogen-sensitive human breast cancer cell line MCF-7.27 Briefly, MCF-7 cells were cultured without estrogen for 5 days to obtain estrogen-free MCF-7 cells. They were then seeded in 96-well plates (1 × 10⁵ cell per well) and treated with the drug after 24 h.The cell proliferation was assessed using the MTT assay, and the proliferation effect of the cells was calculated using the following eqn (1):
 | (1) |
2.5 Electrochemical measurement
The electrochemical measurements were conducted using a CHI 660 electrochemical analyzer (Shanghai Chenhua Instruments Co., China) equipped with a conventional three-electrode system. The system included a platinum wire as the auxiliary electrode, an Ag/AgCl (saturated KCl) electrode as the reference, and a MWCNTs-modified glassy carbon electrode (MWCNTs/GCE) with a diameter of 3 mm as the working electrode. The fabrication of the MWCNTs/GCE and the electrochemical measurements followed previously established methods.For the electrochemical detection, the cells were subjected to treatment in a water bath at 50 °C for 30 min.24,28 The detection of the cells was performed using linear sweep voltammetry within a potential range of 0.0 to +1.1 V, with a scan rate of 50 mV s−1 at room temperature. The proliferation of the cells was determined using eqn (2)
 | (2) |
2.6 Combined effect evaluation
CompuSyn software was used to analyze the combined effect. The combined index (CI) of drugs was calculated as eqn (3):29–33
 | (3) |
The CI quantifies the degree of synergy in a combination. Theoretically, a CI value of 1 represents additivity in the absence of synergy or antagonism, CI < 1 indicates synergy, and CI > 1 indicates antagonism.
The formula for calculating the additive index (AI) can be expressed as eqn (4):34–36
 | (4) |
2.7 Statistical analysis
SPSS 19.0 was used for the statistical analysis of the experimental results, and Origin 2021 software was used for fitting analysis. The average of three independent repeated experiments was calculated, and the data was represented as the average ± standard deviation (Mean ± SD, n = 3).3. Results and discussion
3.1 Electrochemical behavior of estrogen-free MCF-7 cells
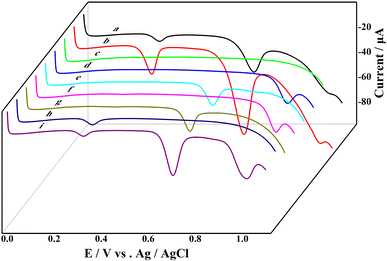
Using linear sweep voltammetry, the electrochemical signals of the MCF-7 cells suspension before and after hormone depletion, uric acid, and four purine standard samples were determined, as shown in Fig. 1. From the electrochemical curve of the MCF-7 cell suspension, three distinct electrochemical signal peaks can be observed. The intensities of the three signals from the estrogen-free MCF-7 cells (Fig. 1a) are significantly lower than those of the normal cells (Fig. 1b), indicating a weakened purine nucleotide metabolism in the estrogen-free cells. Comparing the electrochemical curve of MCF-7 cells with the standard samples, the first electrochemical signal appears at 0.32 V corresponding to the signal position of the uric acid standard sample (Fig. 1h), which belongs to the oxidation peak of uric acid. The second electrochemical signal appears at 0.73 V similar to the signal positions of xanthine (Fig. 1g) and guanine (Fig. 1e) standard samples, indicating a mixed signal from xanthine and guanine. The third electrochemical signal at 1.03 V is similar to the signal positions of hypoxanthine (Fig. 1f) and adenine (Fig. 1d) standard samples, suggesting a mixed signal of hypoxanthine and adenine. The three electrochemical signals of the MCF-7 cells correspond to the signals of uric acid, xanthine/guanine, and hypoxanthine/adenine, as previously confirmed in earlier studies. 25,37–41Although three electrochemical signals can be detected in the cell suspension, the value of the electrochemical signal at 0.32 V is relatively small, and due to the higher position, electrochemical signal at 1.03 V was masked and its change was not significant. Therefore, in subsequent studies, we focused on the significant and stable 0.73 V mixed signal of xanthine/guanine to evaluate the effect of PGRs on cell purine metabolism based on the changes in this electrochemical signal, and thus determining the estrogenic effects of PGRs.
3.2 Effect of PGRs on the electrochemical behavior of estrogen-free MCF-7 cells
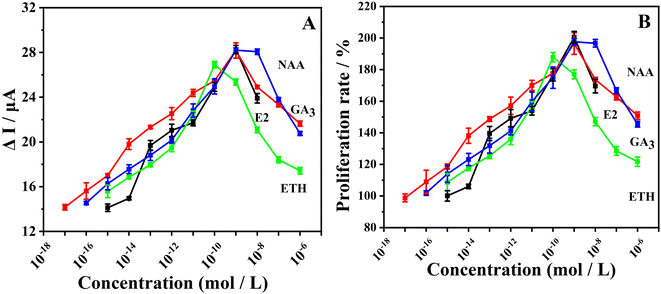
A. M. Gawienowski, et al. have shown that PGRs exhibit estrogenic effects, 8–11 but research on the estrogenic effects of PGRs using electrochemical methods has not been conducted. In this study, E2 was used as the control group, while GA3, ETH, and NAA were used as the experimental groups. The electrochemical method was employed to investigate the changes in electrochemical signals of estrogen-free MCF-7 cells under the influence of different concentrations of PGRs, thereby evaluating the estrogenic effects exerted by PGRs. Firstly, the impact of individua PGRs on cellular purine metabolism was investigated. As shown in Fig. 2A, under the influence of PGRs, estrogen-free MCF-7 cells exhibited a clear dose-dependent response. As the concentrations of each plant growth regulator (PGR) increased, the electrochemical signals initially intensified; however, they began to diminish beyond a certain concentration. The concentrations at which the electrochemical signals peaked influenced by GA3, ETH, and NAA were 1 × 10⁻⁹, 1 × 10⁻¹⁰, and 1 × 10⁻⁹ mol L−1, respectively. This suggests that at these specific concentrations, PGRs exert the most pronounced effect on intracellular purine metabolism. The change in cell proliferation rate was calculated based on the changes in electrochemical signals of xanthine/guanine (Fig. 2B), and the trend of cell proliferation rate change was consistent with the trend of intracellular purine electrochemical signal change, indicating that it is possible to evaluate the impact of exogenous substances on cell activity by using purines as biomarkers.28,41Further investigation of the combined effects of PGRs on cellular purine metabolism was conducted, a positive control group using E2 was employed, with combination ratios of PGR concentrations set as GA3![[thin space (1/6-em)]](https://www.rsc.org/images/entities/char_2009.gif) :
:![[thin space (1/6-em)]](https://www.rsc.org/images/entities/char_2009.gif) ETH = 1
ETH = 1![[thin space (1/6-em)]](https://www.rsc.org/images/entities/char_2009.gif) :
:![[thin space (1/6-em)]](https://www.rsc.org/images/entities/char_2009.gif) 1, GA3
1, GA3![[thin space (1/6-em)]](https://www.rsc.org/images/entities/char_2009.gif) :
:![[thin space (1/6-em)]](https://www.rsc.org/images/entities/char_2009.gif) NAA = 1
NAA = 1![[thin space (1/6-em)]](https://www.rsc.org/images/entities/char_2009.gif) :
:![[thin space (1/6-em)]](https://www.rsc.org/images/entities/char_2009.gif) 1, ETH
1, ETH![[thin space (1/6-em)]](https://www.rsc.org/images/entities/char_2009.gif) :
:![[thin space (1/6-em)]](https://www.rsc.org/images/entities/char_2009.gif) NAA = 1
NAA = 1![[thin space (1/6-em)]](https://www.rsc.org/images/entities/char_2009.gif) :
:![[thin space (1/6-em)]](https://www.rsc.org/images/entities/char_2009.gif) 1, and GA3
1, and GA3![[thin space (1/6-em)]](https://www.rsc.org/images/entities/char_2009.gif) :
:![[thin space (1/6-em)]](https://www.rsc.org/images/entities/char_2009.gif) ETH
ETH![[thin space (1/6-em)]](https://www.rsc.org/images/entities/char_2009.gif) :
:![[thin space (1/6-em)]](https://www.rsc.org/images/entities/char_2009.gif) NAA = 1
NAA = 1![[thin space (1/6-em)]](https://www.rsc.org/images/entities/char_2009.gif) :
:![[thin space (1/6-em)]](https://www.rsc.org/images/entities/char_2009.gif) 1
1![[thin space (1/6-em)]](https://www.rsc.org/images/entities/char_2009.gif) :
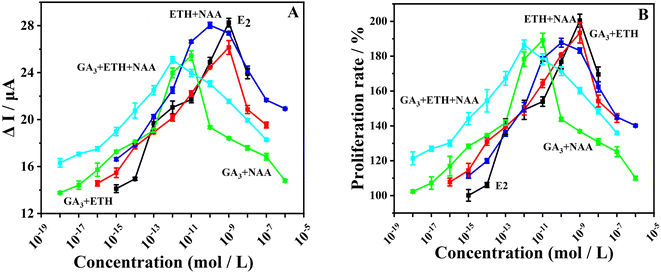
:![[thin space (1/6-em)]](https://www.rsc.org/images/entities/char_2009.gif) 1. The electrochemical signals of cells under the combined effects of PGRs (Fig. 3A) exhibited a consistent trend of change with the electrochemical signals of cells under the influence of individual PGRs (Fig. 2A). As the concentration of combined PGRs increased, the electrochemical signals gradually strengthened, and then gradually weakened after reaching a certain concentration. The change in proliferation rate (Fig. 3B) also followed a consistent trend with the change in electrochemical signals. The concentrations corresponding to the strongest electrochemical signals under the combined effects of GA3/ETH, GA3/NAA, NAA/ETH, and GA3/ETH/NAA were 1 × 10⁻⁹ mol L−1, 1 × 10⁻¹¹ mol L−1, 1 × 10⁻¹⁰ mol L−1, and 1 × 10⁻¹² mol L−1, respectively, indicating the most vigorous cellular purine metabolism at these concentrations. The individual and combined effects of GA3, ETH, and NAA showed a similar trend in their impact on cellular purine metabolism compared to the E2 control group, all demonstrating significant estrogenic effects. However, the degree of impact on purine metabolism in estrogen-free MCF-7 cells differed between the individual and combined effects. Subsequent validation of the accuracy of the electrochemical method will be conducted, and further discussion on the types of combined effects of PGRs will be carried out.
1. The electrochemical signals of cells under the combined effects of PGRs (Fig. 3A) exhibited a consistent trend of change with the electrochemical signals of cells under the influence of individual PGRs (Fig. 2A). As the concentration of combined PGRs increased, the electrochemical signals gradually strengthened, and then gradually weakened after reaching a certain concentration. The change in proliferation rate (Fig. 3B) also followed a consistent trend with the change in electrochemical signals. The concentrations corresponding to the strongest electrochemical signals under the combined effects of GA3/ETH, GA3/NAA, NAA/ETH, and GA3/ETH/NAA were 1 × 10⁻⁹ mol L−1, 1 × 10⁻¹¹ mol L−1, 1 × 10⁻¹⁰ mol L−1, and 1 × 10⁻¹² mol L−1, respectively, indicating the most vigorous cellular purine metabolism at these concentrations. The individual and combined effects of GA3, ETH, and NAA showed a similar trend in their impact on cellular purine metabolism compared to the E2 control group, all demonstrating significant estrogenic effects. However, the degree of impact on purine metabolism in estrogen-free MCF-7 cells differed between the individual and combined effects. Subsequent validation of the accuracy of the electrochemical method will be conducted, and further discussion on the types of combined effects of PGRs will be carried out.
3.3 Establishment of an electrochemical assay for combined effects of PGRs
To confirm the accuracy of the electrochemical detection results, the commonly used estrogenic effect detection method, the E-Screen method, was employed for validation. The results of the E-Screen method showed a consistent trend with the electrochemical method results (Fig. S2†). The proliferation rate was highest for individual PGRs at concentrations of 1 × 10⁻⁹, 1 × 10⁻¹⁰, and 1 × 10⁻⁹ mol L−1, while the combined PGRs exhibited the strongest proliferation rate at concentrations of 1 × 10⁻⁹ mol L−1, 1 × 10⁻¹¹ mol L−1, 1 × 10⁻¹⁰ mol L−1, and 1 × 10⁻¹² mol L−1. A comparison of the proliferation rate results from the two detection methods, as shown in Fig. 4, revealed a significant positive correlation (P > 0.95). This indicates that the electrochemical method using purines as biomarkers is feasible for detecting both individual and combined estrogenic effects of PGRs. Consequently, the changes in xanthine/hypoxanthine content detected by the electrochemical method can be used to evaluate the proliferative effects of exogenous substances on cells.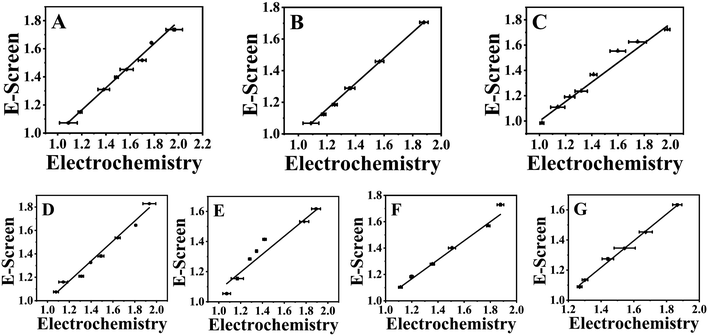 | ||
Fig. 4 Correlation fitting diagram between electrochemical method and E-Screen method. (A) GA3 (B) ETH, (C) NAA, (D) GA3![[thin space (1/6-em)]](https://www.rsc.org/images/entities/char_2009.gif) : :![[thin space (1/6-em)]](https://www.rsc.org/images/entities/char_2009.gif) ETH = 1 ETH = 1![[thin space (1/6-em)]](https://www.rsc.org/images/entities/char_2009.gif) : :![[thin space (1/6-em)]](https://www.rsc.org/images/entities/char_2009.gif) 1, (E) GA3 1, (E) GA3![[thin space (1/6-em)]](https://www.rsc.org/images/entities/char_2009.gif) : :![[thin space (1/6-em)]](https://www.rsc.org/images/entities/char_2009.gif) NAA = 1 NAA = 1![[thin space (1/6-em)]](https://www.rsc.org/images/entities/char_2009.gif) : :![[thin space (1/6-em)]](https://www.rsc.org/images/entities/char_2009.gif) 1, (F) ETH 1, (F) ETH![[thin space (1/6-em)]](https://www.rsc.org/images/entities/char_2009.gif) : :![[thin space (1/6-em)]](https://www.rsc.org/images/entities/char_2009.gif) NAA = 1 NAA = 1![[thin space (1/6-em)]](https://www.rsc.org/images/entities/char_2009.gif) : :![[thin space (1/6-em)]](https://www.rsc.org/images/entities/char_2009.gif) 1, (G) GA3 1, (G) GA3![[thin space (1/6-em)]](https://www.rsc.org/images/entities/char_2009.gif) : :![[thin space (1/6-em)]](https://www.rsc.org/images/entities/char_2009.gif) ETH ETH![[thin space (1/6-em)]](https://www.rsc.org/images/entities/char_2009.gif) : :![[thin space (1/6-em)]](https://www.rsc.org/images/entities/char_2009.gif) NAA = 1 NAA = 1![[thin space (1/6-em)]](https://www.rsc.org/images/entities/char_2009.gif) : :![[thin space (1/6-em)]](https://www.rsc.org/images/entities/char_2009.gif) 1 1![[thin space (1/6-em)]](https://www.rsc.org/images/entities/char_2009.gif) : :![[thin space (1/6-em)]](https://www.rsc.org/images/entities/char_2009.gif) 1. 1. | ||
The types of combined effects are divided into three categories: additive effects, synergistic effects, and antagonistic effects. Additive effects refer to the situation where the total effect of two or more drugs or compounds used together is equal to the sum of their individual effects. This means that each drug acts independently without enhancing or weakening each other. This effect is usually considered in drug dosage calculations to ensure the safety and effectiveness of combination therapy. Synergistic effects occur when the total effect of two or more drugs used together is greater than the sum of their individual effects. This effect indicates that there is a mutually enhancing action between the drugs. Synergistic effects are often used in therapy to increase efficacy or reduce the dose and related side effects of a single drug. Antagonistic effects refer to the scenario where one drug reduces or counteracts the effect of another drug. This effect may be due to competitive inhibition or mutual interference between drugs. Understanding these combined effects is crucial for safety assessment, this article evaluates the combined estrogenic effects of plant growth regulators. Commonly used models for evaluating combined effects include the toxic unit (TU) model, the additivity index (AI) model, the concentration addition (CA) model, and the combination index (CI) model. Typically, a combination of estrogenic activity detection methods and mathematical models is used to assess the type of combined estrogenic effects.42–44 In this context, the CA model is used as a predictive model for combined effects, while TU and AI are methods that quantitatively relate the observed effects of mixtures to the expected effects. In recent years, researchers have focused on developing new models for combined effects, such as the CI model (Combination Index model), which allows for computational analysis through software. The CI model does not rely on the action modes of mixture components, enabling more accurate quantitative measurement of the combination index for drug interactions. This study uses AI and CI models to evaluate the performance of electrochemical and E-Screen methods in detecting the combined estrogenic effects of GA3/ETH, GA3/NAA, NAA/ETH, and GA3/ETH/NAA (Fig. S3 and Table S1†). Both models evaluated the combined effects of GA3/ETH as antagonistic, GA3/NAA as synergistic, and NAA/ETH as additive. However, in the evaluation of the ternary combination of GA3/ETH/NAA, the CI model showed a combined effect transitioning from synergistic to antagonistic, while the AI analysis indicated a synergistic effect. The evaluation results of combined toxicity using the AI and CI models for the electrochemical method and E-Screen method were consistent (Fig. S3 and Table S1†), validating the accuracy and feasibility of the electrochemical method for assessing combined estrogenic effects, and successfully establishing an electrochemical detection method for the combined estrogenic PGRs. Next, the actual environmental concentration ratios will be simulated to evaluate the combined estrogenic effects of PGRs using the electrochemical method, in order to validate its practical applicability.
3.4 The electrochemical method for detecting the actual environmental concentration ratios of PGRs combined estrogenic effects
As commonly used PGRs in agriculture, the residual and hazards of GA3, ETH, and NAA in crops have attracted attention from various countries. In China, corresponding standards stipulate that the maximum residue limits of ETH in wheat, barley, rye, and other crops are 1 mg kg−1, and the maximum residue limits of NAA in wheat, corn, and fresh corn are 0.05 mg kg−1. Although China has not proposed a maximum residue limit for GA3, the United States and Japan have set the maximum residue limits of GA3 at 0.2 mg kg−1. Based on these maximum residue limits, the designed ratios for the drugs are GA3![[thin space (1/6-em)]](https://www.rsc.org/images/entities/char_2009.gif) :
:![[thin space (1/6-em)]](https://www.rsc.org/images/entities/char_2009.gif) ETH = 1
ETH = 1![[thin space (1/6-em)]](https://www.rsc.org/images/entities/char_2009.gif) :
:![[thin space (1/6-em)]](https://www.rsc.org/images/entities/char_2009.gif) 5, GA3
5, GA3![[thin space (1/6-em)]](https://www.rsc.org/images/entities/char_2009.gif) :
:![[thin space (1/6-em)]](https://www.rsc.org/images/entities/char_2009.gif) NAA = 4
NAA = 4![[thin space (1/6-em)]](https://www.rsc.org/images/entities/char_2009.gif) :
:![[thin space (1/6-em)]](https://www.rsc.org/images/entities/char_2009.gif) 1, ETH
1, ETH![[thin space (1/6-em)]](https://www.rsc.org/images/entities/char_2009.gif) :
:![[thin space (1/6-em)]](https://www.rsc.org/images/entities/char_2009.gif) NAA = 20
NAA = 20![[thin space (1/6-em)]](https://www.rsc.org/images/entities/char_2009.gif) :
:![[thin space (1/6-em)]](https://www.rsc.org/images/entities/char_2009.gif) 1, and GA3
1, and GA3![[thin space (1/6-em)]](https://www.rsc.org/images/entities/char_2009.gif) :
:![[thin space (1/6-em)]](https://www.rsc.org/images/entities/char_2009.gif) ETH
ETH![[thin space (1/6-em)]](https://www.rsc.org/images/entities/char_2009.gif) :
:![[thin space (1/6-em)]](https://www.rsc.org/images/entities/char_2009.gif) NAA = 4
NAA = 4![[thin space (1/6-em)]](https://www.rsc.org/images/entities/char_2009.gif) :
:![[thin space (1/6-em)]](https://www.rsc.org/images/entities/char_2009.gif) 20
20![[thin space (1/6-em)]](https://www.rsc.org/images/entities/char_2009.gif) :
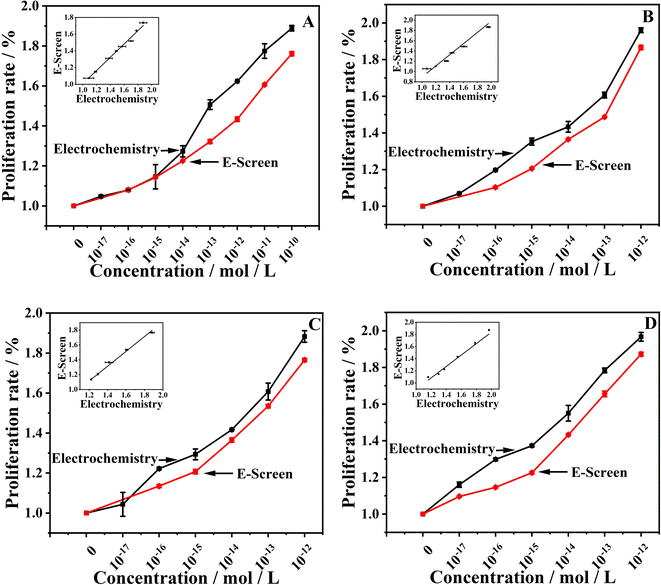
:![[thin space (1/6-em)]](https://www.rsc.org/images/entities/char_2009.gif) 1, which are used as actual concentration ratios in the environment. The electrochemical method was used to evaluate the combined estrogenic effects of the three PGRs, and the accuracy of the electrochemical method was verified by the E-Screen method. The proliferation rate curves of MCF-7 cells treated with the four PGRs ratios are shown in Fig. 5. With the increase in PGRs dosage, the proliferation rate of cells was enhanced, and the detection results of the electrochemical method and the E-Screen method were consistent, with a significant positive correlation (P > 0.95, Fig. 5 insert). However, the cell proliferation rates detected by the electrochemical method were higher than those detected by the E-Screen method, mainly due to the different detection mechanisms of the two methods. The E-Screen method detects cell proliferation rates based on the number of cells, while the electrochemical method evaluates proliferation effects from changes in purine metabolism in cells. This indicates that evaluating cell proliferation rates from the perspective of purine metabolism can detect proliferation changes more significantly than the E-Screen method.
1, which are used as actual concentration ratios in the environment. The electrochemical method was used to evaluate the combined estrogenic effects of the three PGRs, and the accuracy of the electrochemical method was verified by the E-Screen method. The proliferation rate curves of MCF-7 cells treated with the four PGRs ratios are shown in Fig. 5. With the increase in PGRs dosage, the proliferation rate of cells was enhanced, and the detection results of the electrochemical method and the E-Screen method were consistent, with a significant positive correlation (P > 0.95, Fig. 5 insert). However, the cell proliferation rates detected by the electrochemical method were higher than those detected by the E-Screen method, mainly due to the different detection mechanisms of the two methods. The E-Screen method detects cell proliferation rates based on the number of cells, while the electrochemical method evaluates proliferation effects from changes in purine metabolism in cells. This indicates that evaluating cell proliferation rates from the perspective of purine metabolism can detect proliferation changes more significantly than the E-Screen method.
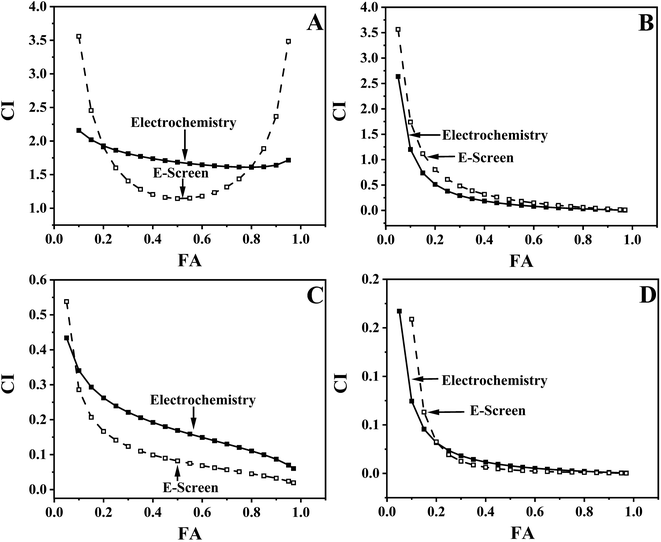
Using AI (Table 1) and CI models (Fig. 6) to evaluate the combined action types of PGRs environmental actual concentration ratios, it was found that apart from the antagonistic effect between GA3 and ETH, GA3/NAA, NAA/ETH, and GA3/ETH/NAA all exhibit synergistic effects. The evaluation results of the combined action types of PGRs environmental actual concentration ratios by AI and CI models were consistent. In the comparison of the combined estrogenic effects between the electrochemical method and the E-Screen method (Table 1 and Fig. 6), the evaluation results of both methods also showed consistency, indicating that the electrochemical method has the potential to become a new method for detecting the combined estrogenic effects of PGRs.
| Mixtures | Electrochemistry | E-Screen | ||
|---|---|---|---|---|
| AI | Description | AI | Description | |
| GA3 + ETH | −0.19 | Antagonism | −0.39 | Antagonism |
| GA3 + NAA | 15.44 | Synergism | 68.09 | Synergism |
| ETH + NAA | 5.26 | Synergism | 10.41 | Synergism |
| GA3 + ETH + NAA | 602.17 | Synergism | 1461.73 | Synergism |
4. Conclusion
This study utilized three PGRs, namely GA3, ETH, and NAA, as model drugs to compare the single and combined estrogenic effects of PGRs using electrochemical and E-Screen methods. The results showed that both the individual and combined use of GA3, ETH, and NAA exhibited estrogenic effects. Additionally, the detection results of the electrochemical method were consistent with those of the E-Screen method, with P > 0.95, indicating a significant positive correlation between the two detection methods. AI and CI models were used to evaluate the type of combined estrogenic effects of PGRs detected using the electrochemical and E-Screen methods, and the evaluation results from both methods were the consistent, suggesting that the electrochemical method is feasible for detecting the combined estrogenic effects of these PGRs. The electrochemical method was also used to evaluate the combined estrogenic effects of PGRs at environmental actual concentration ratios, and the detection results were consistent with those of the E-Screen method. Furthermore, regardless of whether AI or CI models were used to evaluate the combined action types of PGRs, the results obtained from the electrochemical method were consistent with those from the E-Screen method. Additionally, the electrochemical method was able to detect a more significant proliferation rate, indicating that the electrochemical method, which evaluates cell proliferation rates from the perspective of purine metabolism, detects the estrogenic effects of PGRs more significantly than the E-Screen method.Data availability
The authors confirm that the data supporting the findings of this study are available within the article [and/or its ESI†].Conflicts of interest
We declare that we have no financial and personal relationships with other people or organizations that can inappropriately influence our work, there is no professional or other personal interest of any nature or kind in any product, service and/or company that could be construed as influencing the position presented in, or the review of, the manuscript entitled.Acknowledgements
We gratefully acknowledge the support of the National Natural Science Foundation of China (NNSF) (21777060), Heilongjiang Province key research and development plan project (GA22B007), Heilongjiang Provincial Natural Science Foundation of China(YQ2022B011), Heilongjiang Province “Double first-class” discipline collaborative innovation achievement construction project (LJGXCG2022-126), Basic Scientific Research Project for Heilongjiang Provincial Colleges and Universities (2021-KYYWF-0587), National Fund Cultivation Project of Jiamusi University (JMSUGPZR2022-005) and Heilongjiang Huahao Testing Technology Service Co., Ltd.Notes and references
- L. G. Nickell, Chem. Eng. News, 1978, 56, 18–34 CrossRef CAS.
- M. Faruk, M. R. Kumar, D. Arya, M. Panda, R. Kumar, P. Fartiyal and A. Yadav, Int. J. Environ. Clim. Change, 2023, 13, 791–798 CrossRef.
- N. Pallabi, T. N. Dhanalakshmi, T. Rudramuni and S. K. Priyadarshini, Innovative Farming, 2016, 1, 59–61 Search PubMed.
- I. Celik and Y. Tuluce, Pestic. Biochem. Physiol., 2006, 84, 49–54 CrossRef CAS.
- I. Celik, M. Turker and Y. Tuluce, J. Hazard. Mater., 2007, 148, 623–629 CrossRef CAS PubMed.
- S. Garcia-Herrero, B. Simon and J. Garcia-Planells, Genes, 2020, 11(12), 1521 CrossRef CAS PubMed.
- X. Wang and W. Hao, Pestic. Biochem. Physiol., 2023, 196, 105640 CrossRef CAS.
- A. M. Gawienowski, S. S. Stadnicki and M. Stacewicz-Sapuntzakis, Life Sci., 1977, 20, 785–788 CrossRef CAS.
- G. Gong, H. Kam, H. Chen, Y. Chen, W. s. Cheang, J. P. Giesy, Q. Zhou and S. M.-y. Lee, Ecotoxicol. Environ. Saf., 2022, 232, 113287 CrossRef CAS PubMed.
- Q. Bu, X. Wang, H. Xie, K. Zhong, Y. Wu, J. Zhang, Z. Wang, H. Gao and Y. Huang, J. Agric. Food Chem., 2019, 67, 10207–10213 CrossRef CAS.
- D. Zhu, L. Ping, X. Shen, Y. Hong, Q. Weng, Q. He, J. Wang and J. Wang, Reprod. Toxicol., 2020, 98, 157–164 CrossRef CAS.
- H. D. Lauson, C. G. Heller, J. B. Golden and E. L. Sevringhaus, Endocrinology, 1939, 24, 35–44 CrossRef CAS.
- F. L. J. Hisaw, Endocrinology, 1959, 64, 276–289 CrossRef CAS PubMed.
- T. Zacharewski, Environ. Health Perspect., 1998, 106, 577–582 Search PubMed.
- D. M. Klotz, B. S. Beckman, S. M. Hill, J. A. McLachlan, M. R. Walters and S. F. Arnold, Environ. Health Perspect., 1996, 104, 1084–1089 CrossRef CAS PubMed.
- R. Bolger, T. E. Wiese, K. Ervin, S. Nestich and W. Checovich, Environ. Health Perspect., 1998, 106, 551–557 CrossRef CAS PubMed.
- J. Li, J. Song, S. Bi, S. Zhou, J. Cui, J. Liu and D. Wu, J. Hazard. Mater., 2016, 313, 238–243 CrossRef CAS PubMed.
- C. R. Lyttle, P. Damian-Matsumura, H. Juul and T. R. Butt, J. Steroid Biochem. Mol. Biol., 1992, 42, 677–685 CrossRef CAS PubMed.
- A. M. Soto, C. Sonnenschein, K. L. Chung, M. F. Fernandez, N. Olea and F. O. Serrano, Environ. Health Perspect., 1995, 103(Suppl 7), 113–122 CrossRef CAS PubMed.
- J. R. Zysk, B. Johnson, B. A. Ozenberger, B. Bingham and J. Gorski, Endocrinology, 1995, 136, 1323–1326 CrossRef CAS.
- Zacharewski, Environ. Sci. Technol., 1997, 31, 613–623 CrossRef CAS.
- W. Wang, J. Cui, Y. Zhao, C. Ye, S. Zhou, X. Guo, C. Zhang, J. Li and D. Wu, J. Pharmacol. Toxicol. Methods, 2019, 100, 106625 CrossRef CAS PubMed.
- S. Zhou, X. Guo, L. Meng, J. Cui, J. Li, X. Yuan and D. Wu, Anal. Biochem., 2019, 577, 67–72 CrossRef CAS PubMed.
- Y. Wei, C. Gao, J. Cui, H. Shen, Y. Zhao, S. Zhou, C. Ye, Y. Du, J. Li and D. Wu, Anal. Chim. Acta, 2022, 1233, 340514 CrossRef CAS PubMed.
- J.-W. Cui, Q. Wang, S. Bi, J. Zhang, J.-L. Zhu, J.-G. Liu and D.-m. Wu, Analyst, 2017, 142, 591–595 RSC.
- S. Zhou, P. Guo, J. Li, L. Meng, H. Gao, X. Yuan and D. Wu, Sens. Actuators, B, 2018, 255, 2595–2600 CrossRef CAS.
- A. M. Soto and C. Sonnenschein, J. Steroid Biochem., 1985, 23, 87–94 CrossRef CAS PubMed.
- Y. Wei, H. Shen, C. Gao, Y. Du, Y. Zhao, Y. Wang, S. Zhou, J. Li, B. Zhao and D. Wu, Chemosphere, 2023, 311, 136970 CrossRef CAS.
- T.-C. Chou and P. Talalay, Adv. Enzyme Regul., 1984, 22, 27–55 CrossRef CAS.
- T.-C. Chou, J. Theor. Biol., 1976, 59, 253–276 CrossRef CAS PubMed.
- T.-C. Chou, J. Theor. Biol., 1977, 65, 345–356 CrossRef CAS PubMed.
- T. C. Chou, Carcinogenesis, 1980, 1, 203–213 CrossRef CAS.
- T.-C. Chou and P. Talalay, Trends Pharmacol. Sci., 1983, 4, 450–454 CrossRef CAS.
- Y. Wang, T. Cang, R. Yu, S. Wu, X. Liu, C. Chen, Q. Wang and L. Cai, Environ. Sci. Pollut. Res. Int., 2016, 23, 11766–11776 CrossRef CAS PubMed.
- S. Xu and N. Nirmalakhandan, Water Res., 1998, 32, 2391–2399 CrossRef CAS.
- L. Marking, Chemistry, Environmental Science ASTM special technical publications, 1977, pp. 99–108, DOI:10.1520/STP32392S.
- J.-Y. Zhang, C. Xia, H.-F. Wang and C. Tang, J. Energy Chem., 2022, 67, 432–450 CrossRef CAS.
- H. Qin, Q. Gao, H. Niu, Z. Wang, X. Zhu, J. Li, X. Yuan and D. Wu, Analyst, 2013, 138, 3372–3375 RSC.
- G.-B. Xu, J.-M. Cui, H. Liu, G.-G. Gao, Y.-F. Qiu, S.-M. Zhang and D.-M. Wu, Electrochim. Acta, 2015, 168, 32–40 CrossRef CAS.
- Z. Guo, S. Zhou, J. Li, X. Guo, J. Cui and D. Wu, Bioelectrochemistry, 2020, 135, 107552 CrossRef CAS.
- J.-W. Cui, T.-J. Hou, Q. Wang, G.-G. Gao, S. Bi, K.-C. Zhou, J.-L. Li and D.-M. Wu, Electrochim. Acta, 2015, 180, 360–365 CrossRef CAS.
- J. Payne, M. Scholze and A. Kortenkamp, Environ. Health Perspect., 2001, 109, 391–397 CrossRef CAS PubMed.
- G. Aichinger, F. Pantazi and D. Marko, Toxicol. Lett., 2020, 319, 242–249 CrossRef CAS PubMed.
- H. Yu, D. J. Caldwell and R. P. Suri, Chemosphere, 2019, 215, 396–403 CrossRef CAS PubMed.
Footnote |
| † Electronic supplementary information (ESI) available. See DOI: https://doi.org/10.1039/d4ra06838f |
| This journal is © The Royal Society of Chemistry 2024 |

