 Open Access Article
A 3D printed dual screen-printed electrode separation device for twin electrochemical mini-cell establishment†
Thana Thaweeskulchai‡
,
Waswan Prempinij‡ and
Albert Schulte *
*
School of Biomolecular Science and Engineering (BSE) of the Vidyasirimedhi Institute of Science and Technology (VISTEC), 21210 Rayong, Thailand. E-mail: thana.t_s17@vistec.ac.th; albert.s@vistec.ac.th
First published on 26th September 2024
Abstract
We describe a tiny 3D-printed polymethyl-methacrylate-based plastic sleeve that houses two disposable screen-printed electrodes (SPE) and enables each of the working electrodes (WEs) to work independently, on a different side of a thin barrier, in its own electrochemical (EC) mini-cell, while the SPE counter and reference units are shared for electroanalysis. Optical and EC performance tests proved that the plastic divider between WE1 and WE2 efficiently inhibited solution mixing between the mini-cells. The two neighboring, independently operating mini-cells enabled matched differential measurements in the same sample solution, a tactic designed for elimination of electrochemical interference in complex samples. In a proof-of-principle glucose biosensor trial, a glucose oxidase-modified WE2 and an unmodified WE1 delivered the EC data for the removal of anodic ascorbic acid (AA) interference simply by subtracting the WE1 (background) current from the analyte-specific WE2 current (from buffered sample solution supplemented with glucose/AA), at an anodic H2O2 detection potential of +1 V. The microfabricated SPE accessory is cheap and easy to make and use. For the many dual electrode SPE strips on the market for multiple analytical targets the new device widens the options for their exploitation in assays of biological and environmental samples with complex matrix compositions and significant risks of interference.
1. Introduction
Screen-printed carbon and noble metal electrodes (SPEs) are widely exploited tools in electrochemical (EC) analysis and biosensing. SPEs combine an ease of use and good performance with good availability, either by large scale in-house production or by purchase from vendors that offer them as affordable mass-produced items.1–5 They are usually realised on planar plastic or ceramic plates, with conductive carbon or metal inks screen-printed and dried in various geometries as assembly of working- (WE), reference- (RE) and counter-electrodes (CE), with a thin insulating top layer defining the active electrode areas. Adaptation of SPE WEs is possible, by the choice of the special conductive inks offered by major producers, either from stock or as custom-made orders for specific SPE needs. Carbon, gold, silver or platinum disks or bands, of 1 or 3 mm spans are commonly used. SPEs, either unmodified or modified with metal or metal oxide nanoparticles, (redox) polymers, carbon nanotubes, graphene, enzyme, DNA or antibodies are now standard tools for advanced electroanalytical applications and EC biosensing in clinical, pharmaceutical, environmental and food biotech laboratories.6–24The simplest SPEs has a single WE disc as electrochemical detector with nearby CE and RE stripes or spots completing a three-electrode assembly. Also popular are dual WE SPEs, in which two conductive spots form individual WEs next to each other, with a shared CE/RE unit.
With modern bi-potentiostat operation simultaneous independent storage of the current readouts of the two WE units of a dual WE SPE is feasible. However, with a standard dual WE SPE layout only a single drop of solution can be analysed by the two WEs. A simultaneous electroanalysis in two separated portioning's of one and the same sample solutions under different test conditions is impracticable, which severely limits the practicality of the SPE platform. A technical adjustment was therefore deemed necessary for an optimal exploitation of dual SPEs and to enable simultaneous discrete detections in split sample solutions (“differential testing”) with a consequent gain in the flexibility of electroanalysis. The advantage of a dual WE/dual EC mini-cell assembly is the unique possibility of direct comparison of control and test samples and the option of background/noise (“interference”) removal for more exact analyte signal quantification. Interference removal is usually achieved by placing an extra coating of semipermeable polymer on top,25,26 but as a barrier to analyte diffusion such a layer not only slows down the sensor's response time but also adversely affects the sensitivity of detection.
We report here a simple 3-D printed sleeve device that allows inserted dual SPEs to run separate voltammetric or amperometric tests simultaneously in two EC mini-cells on the twin electrode platform. We provide details of the fabrication of the proposed SPE device, report the outcome of a series of functionality tests and verify the feasibility of using it to establish a cheap, easily set up and used and widely applicable novel interference elimination assay.
2. Experimental
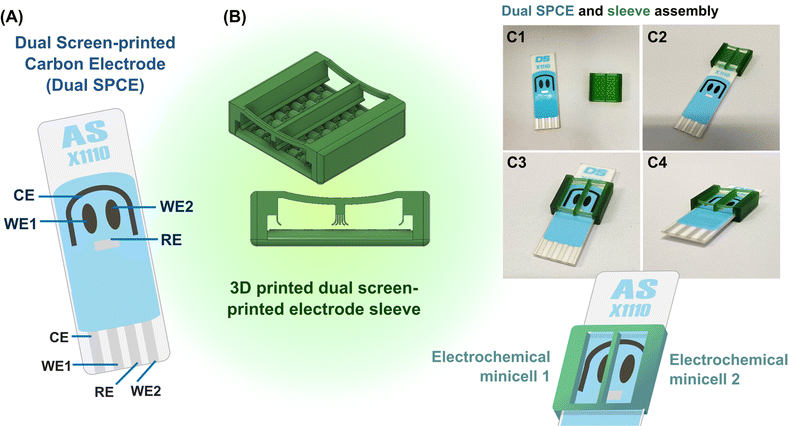
As explained graphically in Fig. 1, the function of the proposed 3D printed sleeve device is to place a liquid-tight partition between the adjacent WEs on a dual SPE and maintain test solutions in separate chambers on opposite sides of the dividing plastic wall. The device was fabricated using a DLP (Digital Light Processing) 3D printer and CADworks3D Ultra M50 with the Utility software in version 6.3.0.t3 with green polymethylmethacrylate-based liquid 3D printing resin as the feed for wall formation. 3D printer settings for fabrication were curing time, 5 s; speed, slow; gap adjustment, 0.1 mm; base layer, 1; base curing, 50 s; buffer layers, 10; layer thickness, 50 μm. The finished plastic device, which is displayed as the core part of Fig. 1 and S1 (ESI),† is a sleeve with two open ends into which a SPE can easily be inserted, with walls on either side, a bottom with a row of elevated arches and an open top for easy access and liquid handling. An extra solid wall runs through the centre of the device to form two halves that ultimately work as twin EC mini-cells with equivalent electrode sets. The wall is supported on either end by a flexible bar that curves downward slightly, designed to apply pressure on the SPE substrate to prevent fluid leakage across the partitioned chambers. At the bottoms of the side and central walls, flexible curved flaps that run along the length of the walls restrict fluid movement and prevent leakage of solution. The elevated arches on the bottom are designed to distribute pressure equally across the SPE substrate when inserted. To use the device, an SPE is gently inserted until the electrodes are inside the chambers (Fig. 1C1–C4). The two WEs are then located on the left and right of the partition, while the CE and the RE, stretching to either side, are thus shared between the two EC mini-cells. Loading the two chambers prepares the system for leakage and EC tests on the fillings.Potassium chloride and mono and dibasic sodium phosphate for aqueous electrolyte preparation, potassium ferricyanide, hydrogen peroxide (H2O2), glucose and ascorbic acid were all from Carlo Erba Reagents (Milan, Italy). The glucose oxidase (GOx) used for the glucose biosensor tests of this study was isolated from Aspergillus niger and obtained as product number #G7141, with an activity of about 228 kU per gram solid from Sigma-Aldrich (St. Louis, MO, USA). 5 μL of a 10 mg per mL solution of the GOx in 0.1 M sodium phosphate buffer (PB) was drop-dried on the right (WE2) of the two screen-printed carbon electrodes of the dual SPE, which then carried a GOx equivalent of 11.4 units. The second screen-printed carbon electrode (WE1) was left unmodified for background recording.
3. Result and discussion
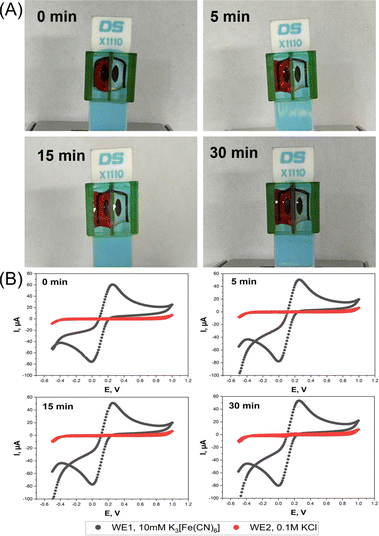
The function of the device was to create two separate electrolyte chambers on the sensor platform by physical partition with a central wall. Optical leak tests were first performed to verify that there is no fluid exchange between the two chambers. The left and right vessels were filled with DI water and red food coloring solution, or vice versa, and the status of the fillings was then followed visually over time. With the color on the left and water on the right, the photos in Fig. 2A prove that the device could keep the liquids above the two SPE WEs separated for at least 15 min. The first minimal signs of chemical crossover were observed after 30 min, with red color traces emerging on the DI water side of the separating wall. The same quality of separation was also true for the “color right, water left” trial (Fig. S2A, ESI†).To further prove the device's function, EC leakage tests were performed by synchronous SPE cyclic voltammetry in separate ferricyanide-free and ferricyanide-containing mini-cells. Cyclic voltammograms (CVs) of the WE in the KCl solution showed no redox peak for 15 min, regardless of which side the ferricyanide was added, while those for 10 mM ferricyanide/0.1 M KCl loading showed the expected well-defined faradaic current waves for the reduction of dissolved [Fe(CN)6]3+ in the forward and the anodic re-oxidation of freshly generated [Fe(CN)6]4+ in the backward scan. In CV scans that were performed 30 min after starting the trial modest solution mixing became evident through the appearance of a faint ferricyanide fingerprint in the KCl chamber (Fig. 2B and S2B, ESI†).
The results of the optical and the electrochemical leakage tests confirmed that the proposed sleeve device achieved its function as a barrier between solutes in the two neighboring chambers, for up to 15 minutes at least. While not perfect, 15 minutes of leakage protection allows successful standard amperometric or voltammetric sample analysis, as required, for instance, for on-site environmental or point-of-care clinical testing, where rapid data acquisition is generally prioritized.
Successful operation of the plastic sleeve/SPCE assembly with the two EC mini-cells for interference elimination required, in addition to prevention of leakage of solutes from one mini-cell to the other, equal electrochemical performance of WE1 and WE2 (redox responsiveness). For the commercial dual-electrode SPCE platform WE parity was promised by the specifications of the manufacturer and supplier. Our own experimental proof came from a comparative differential pulse voltammetry (DPV) test with ferricyanide as standard redox mediator. Specifically, the WE2 DPV response to 0.1 M KCl was recorded while at the same time WE1 measured the matching DPVs for 0.5, 1.0 and 2.5 mM ferricyanide in 0.1 M KCl. The trial was also carried out with the WEs reversed. Depending on the setting up, either WE1 or WE1 delivered the background current value. Examples of the background/ferricyanide DPV pairs for WE1 and WE2 are shown in Fig. S3A (ESI).† Plots of the averaged background-corrected ferricyanide DPV peak amplitudes were constructed with the data of the two trials and are shown in Fig. S3B (ESI).† Regardless of the left- or right-side location of the ferricyanide the regression lines were linear, with regression coefficients (R2) close to 1, while error bars showing the standard deviation of the averages were small, and the graphs through the data points from the two conditions appeared almost perfectly superimposable. This confirmed the reliability of sleeve-based paired mini-cell formation for voltammetry data acquisition and proved the equality of the responses of the two individually operated carbon WEs.
H2O2 is an electrochemically detectable signaling molecule for GOx biosensors and GOx-based biosensing with anodic H2O2 detection was the model used here for the interference elimination feasibility tests. Before the model interference tests were executed the quality of the SPE platform for amperometric H2O2 detection at +1 V vs. RE was inspected. H2O2 amperograms were recorded with WE2 for 0.4, 0.6, 0.8 and 1.0 mM analyte in 0.1 KCl and the 0.1 M KCl background current was acquired with WE1 (Fig. S4A, ESI†). A plot of the background-corrected WE2 current versus [H2O2], extracted at the end to the recordings after the decay of the capacitive current contribution, was linear with a regression coefficient, R2, of 0.9988 and at 5.2 μA mM−1 the sensitivity of the H2O2 response was adequate for the purposes of this study.
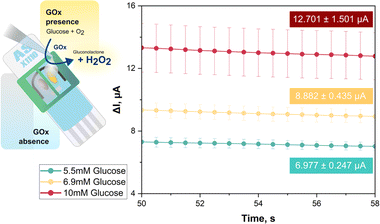
What follows is the requisite proof that the proposed 3D printed plastic device for dual WE SPEs is indeed well suited to the analysis of samples with a complex matrix that require the elimination or minimization of the impact of interferents on analyte signaling. Anodic H2O2 readout in GOx-based glucose biosensing, for instance, is affected in trials of human body fluid by currents from constituents that are oxidizable at the detection potential. As a model performance test, glucose biosensing was carried with a screen-printed dual carbon disk electrode platform in a dual electrochemical mini-cell assembly, using glucose mock samples with and without an added interferent, ascorbic acid. In the first triplicate proof-of-principle trial, WE1 of a dual carbon electrode SPE was operated in unmodified state without GOx attachment, while WE2 was coated in the simplest possible way with drop-dried GOx to confer a selective biosensor response to its substrate glucose. This glucose biosensing approach is illustrated in the schematic in the left panel of Fig. 3.
For the recordings in Fig. 3, 65 μL each of 0.1 M, pH 7.0 PB with 5.5, 6.9 or 10 mM glucose were dropped into the two reservoirs above WE1 and WE2. For amperometric H2O2 detection both WEs were held at +1.0 V vs. the RE. In the mini-cell of WE1 GOx was absent, so there was no H2O2 release from enzymic glucose turnover and the sensor recorded only a small background current from anodic water splitting and/or direct oxidation of the sugar or traces of buffer contaminants. In EC mini-cell 2, with a GOx surface deposit on WE2, the biocatalytic oxidation of glucose led to significant H2O2 production and an anodic H2O2 current proportional to substrate concentration and well above background. The green, yellow, and red traces in the I vs. t plot of Fig. 3 show, for the triplicate runs of the 5.5, 6.9 and 10 mM glucose samples, the averaged WE2 (biosensor) currents after subtraction of the background, i.e. the matching WE1 current. Obviously, these distinct concentrations, which are accepted guideline values for normal, elevated and diabetic fasting blood glucose content, were accurately measured and clearly distinguished. The proposed dual electrode/dual electrochemical mini-cell approach thus proved to be feasible for routine biosensor applications.
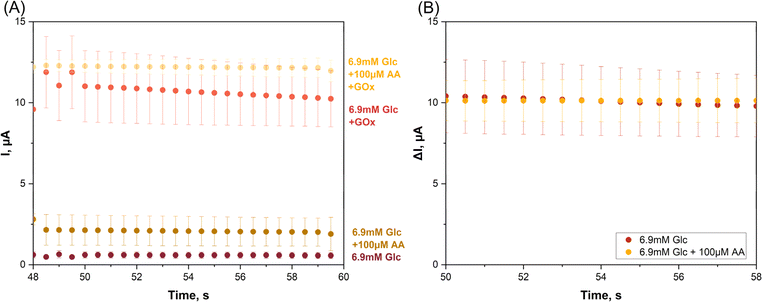
The twin SPE/twin EC mini-cell biosensing trials that produced the data in Fig. 3 related to glucose detection in simple buffer without interfering chemicals. To prove that the proposed tactic is practicable for interference removal the application was repeated in triplicate, with ascorbic acid (AA) added to the sample solution as a sample component that will be oxidized at the two WEs of the system with +1.0 V polarization, producing significant interfering current. The AA content was set to 100 μM, which approximates to its physiological concentration in human serum. Glucose, the analyte, was used in the model interference test at 6.9 mM, which for blood samples taken after overnight fasting is at the border between elevated and diabetic states. Fig. 4A shows four current traces from the artificial near-diabetic blood model.
The two lower tracks are WE1 current recordings in the GOx-free mini-cell 1, obtained in two independent test runs on a glucose sample with and without an AA supplement. The current in the absence of AA (−AA) was 0.57 ± 0.18 μA while in the presence of AA (+AA) the value was higher, 1.90 ± 1.03 μA, from triplicate measurement repetition (n = 3). H2O2 was not produced in mini-cell 1 because of the lack of GOx and the WE1 current thus free of any contribution from the oxidation of this species. The distinct current increase that was observed between case 1 (−AA) and case 2 (+AA) obviously reflects the impact of anodic AA interference oxidation on the WE1 recording.
The two amperometric WE1 recordings in GOx-free mini-cell 1 are the −AA and the +AA current traces for the glucose sample. GOx-modified WE2 acquired the −AA and +AA responses for the same glucose sample. GOx was present on the surface of WE2 and partial dissolution of the drop-dried GOx in the electrolyte was possible, but not detrimental to the outcome of the trial. The anodic WE2 currents were signals from the anodic oxidation of H2O2, as produced by Gox-catalysed oxidation of glucose, from AA oxidation in the +AA case, and from oxidation of other oxidizable buffer components. Indeed, the WE2 current in the absence of AA as interferent was 10.24 ± 1.73 μA while in the presence of AA the value was higher, 11.97 ± 0.66 μA from triplicate measurements (n = 3). The clear difference between the −AA and +AA currents a sign of the impact of the unwanted anodic AA interference oxidation, but now on the signal from WE2. Obviously, the proposed detection method was able to detect and visualize the model interferent, even at the low concentration of 100 μM, as a clear signal elevation above the interferent-free level.
For the data points in Fig. 4A and for the presence and the absence of AA the biosensor response for pure glucose was computed as the difference between the WE2 and WE1 currents and all values obtained were replotted against time (Fig. 4B). The superimposable traces of μI vs. t verified the success of the twin SPE/twin EC mini-cell biosensing approach in the elimination of interference.
4. Conclusion
The principal goal of the work described in this report was the construction of a 3D-printed plastic sleeve for single-use screen-printed electrodes (SPEs) with two WEs incorporated. This device enabled WE1 and WE2 to work autonomously on either side of a thin barrier in their own electrochemical mini-cells, while the counter- and reference-electrodes of the microfabricated SPE platform were shared for electroanalysis. In a successful proof-of-principle glucose biosensor trial with a glucose solution containing added ascorbic acid, cooperative anodic H2O2 detection with an unmodified WE1 and a glucose oxidase-modified WE2 produced data that enabled interference elimination by a simple subtraction of the background (WE1) from the analyte-specific (WE2) current. For the dual electrode SPE strips on the market with a wide range of analyte responsiveness the described microfabricated accessory is recommended as a cheap, sustainable and easily made and used accessory that can usefully widen the options of their analytical exploitation.Data availability
The data supporting this article have been included in the main manuscript and as part of the accompanying ESI.†Author contributions
TT designed and created the 3D-printed plastic sleeve and performed the optical leak tests. WP carried out the electrochemical performance test and the proof-of-principle biosensor trial. All authors contributed to data analysis, graphic preparation and report writing and all gave their approval to the final version of the manuscript.Conflicts of interest
There are no conflicts to declare.Acknowledgements
The authors thank their institutions and its kind sponsors from the industry and business section for general laboratory support, the VISTEC Postdoctoral Fellowship funding of Thana Thaweeskulchai and the VISTEC PhD grant for Waswan Prempinij. The Thailand Science Research and Innovation public funding agency is acknowledged for funding through a 2023/2024 grant within the Global Partnership Program and Dr David Apps, Edinburgh Medical School, Edinburgh, Scotland, is thanked for his critical manuscript reading and language corrections.References
- A. G.-M. Ferrari, S. J. Rowley-Neale and C. E. Banks, Talanta Open, 2021, 3, 100032 CrossRef.
- R. R. Suresh, M. Lakshmanakumar, J. B. B. A. Jayalatha, K. S. Rajan, S. Sethuraman, U. M. Krishnan and J. B. B. Rayappan, J. Mater. Sci., 2021, 56, 8951–9006 CrossRef CAS.
- K. Yamanaka, M. d. C. Vestergaard and E. Tamiya, Sensors, 2016, 16, 1761 CrossRef PubMed.
- N. Serrano, A. Alberich, J. M. Díaz-Cruz, C. Ariño and M. Esteban, TrAC, Trends Anal. Chem., 2013, 46, 15–29 CrossRef CAS.
- O. D. Renedo, M. A. Alonso-Lomillo and M. J. A. Martínez, Talanta, 2007, 73, 202–219 CrossRef CAS PubMed.
- P. Kelíšková, O. Matvieiev, L. Janíková and R. Šelešovská, Curr. Opin. Electrochem., 2023, 42, 101408 CrossRef.
- G. Paimard, E. Ghasali and M. Baeza, Chemosensors, 2023, 11, 113 CrossRef CAS.
- G. Liang, Z. He, J. Zhen, H. Tian, L. Ai, L. Pan and W. Gong, Environ. Technol. Innovation, 2022, 28, 102922 CrossRef CAS.
- Q. Ye, Z. Zhang, J. Liu and X. Wang, Anal. Methods, 2022, 14, 2961–2975 RSC.
- M. Sher, A. Faheem, W. Asghar and S. Cinti, TrAC, Trends Anal. Chem., 2021, 143, 116374 CrossRef CAS PubMed.
- D. Antuña-Jiménez, M. B. González-García, D. Hernández-Santos and P. Fanjul-Bolado, Biosensors, 2020, 10, 9 CrossRef PubMed.
- N.-B. Mincu, V. Lazar, D. Stan, C. M. Mihailescu, R. Iosub and A. L. Mateescu, Diagnostics, 2020, 10, 517 CrossRef CAS PubMed.
- A. L. Squissato, R. A. A. Munoz, C. E. Banks and E. M. Richter, ChemElectroChem, 2020, 7, 2211–2221 CrossRef CAS.
- B. Pérez-Fernández, A. Costa-García and A. D. Muñiz, Biosensors, 2020, 10, 32 CrossRef PubMed.
- A. L. Squissato, E. S. Almeida, S. G. Silva, E. M. Richter, A. D. Batista and R. A. A. Munoz, TrAC, Trends Anal. Chem., 2018, 108, 210–220 CrossRef CAS.
- F.-D. Munteanu, A. M. Titoiu, J.-L. Marty and A. Vasilescu, Sensors, 2018, 18, 901 CrossRef PubMed.
- M. Li, D.-W. Li, G. Xiu and Y.-T. Long, Curr. Opin. Electrochem., 2017, 3, 137–143 CrossRef CAS.
- A. Vasilescu, G. Nunes, A. Hayat, U. Latif and J.-L. Marty, Sensors, 2016, 16, 1863 CrossRef PubMed.
- H. M. Mohamed, TrAC, Trends Anal. Chem., 2016, 82, 1–11 CrossRef CAS.
- M. U. Ahmed, M. M. Hossain, M. Safavieh, Y. L. Wong, I. Abd Rahman, M. Zourob and E. Tamiya, Crit. Rev. Biotechnol., 2016, 36, 495–505 Search PubMed.
- F. Arduini, L. Micheli, D. Moscone, G. Palleschi, S. Piermarini, F. Ricci and G. Volpe, TrAC, Trends Anal. Chem., 2016, 79, 114–126 CrossRef CAS.
- J. Barton, M. B. G. García, D. H. Santos, P. Fanjul-Bolado, A. Ribotti, M. McCaul, D. Diamond and P. Magni, Microchim. Acta, 2016, 183, 503–517 CrossRef CAS.
- R. A. S. Couto, J. L. F. C. Lima and M. B. Quinaz, Talanta, 2016, 146, 801–814 CrossRef CAS PubMed.
- M. Li, Y.-T. Li, D.-W. Li and Y.-T. Long, Anal. Chim. Acta, 2012, 734, 31–44 CrossRef CAS PubMed.
- W.-Z. Jia, K. Wang and X.-H. Xia, TrAC, Trends Anal. Chem., 2010, 29, 306–318 CrossRef CAS.
- T. Kulkarni and G. Slaughter, Membranes, 2016, 6, 55 CrossRef PubMed.
Footnotes |
| † Electronic supplementary information (ESI) available. See DOI: https://doi.org/10.1039/d4ra05929h |
| ‡ These two authors contributed equally. |
| This journal is © The Royal Society of Chemistry 2024 |


