 Open Access Article
Optical detection of uric acid based on a citric acid functionalized copper-doped biochar nanozyme
Noaman Khana,
Mansoor Ahmadb,
Wei Sunb,
Noor S. Shahc,
Muhammad Asada,
Mohibullah Shahd,
Riaz Ullahe,
Mohamed A. Ibrahimf,
Amir Badshah*a and
Umar Nishan *a
*a
aDepartment of Chemistry, Kohat University of Science and Technology, Kohat 26000, KP, Pakistan. E-mail: amirqau@yahoo.com; umarnishan85@gmail.com
bHainan International Joint Research Center of Marine Advanced Photoelectric Functional Materials, College of Chemistry and Chemical Engineering, Hainan Normal University, Haikou 571158, P. R. China
cDepartment of Chemistry, COMSATS University Islamabad, Abbottabad Campus, 22060, Pakistan
dDepartment of Biochemistry, Bahauddin Zakariya University, Multan 66000, Pakistan
eDepartment of Pharmacognosy, College of Pharmacy, King Saud University, Riyadh, Kingdom of Saudi Arabia
fDepartment of Pharmaceutics, College of Pharmacy, King Saud University, Riyadh 11451, Saudi Arabia
First published on 21st October 2024
Abstract
Uric acid is the end product of purine metabolism and is a key biomarker for various diseases. Under normal conditions, there is a balance between its production and excretion. Its higher concentration can cause inflammation and severe pain, which makes it necessary to monitor its level for the diagnosis, management, and treatment of various pathological conditions. The current work reports on the synthesis of a copper-doped biochar (Cu@BC) nanocomposite and its functionalization with citric acid. The synthesis of the mimic enzyme was confirmed through various spectroscopic techniques. The nanozyme catalyzes hydrogen peroxide to oxidize tetramethylbenzidine (TMB) with an optical change from colorless to blue-green. This optical transformation was confirmed through a UV-vis spectrophotometer, which gave an expected λmax of 652 nm characteristic of TMBoxi. The incorporation of uric acid into this reaction mixture resulted in the reduction of TMBoxi to TMBred, accompanied by an optical change from blue-green to colorless, which was again confirmed with a UV-vis spectrophotometer. The fabricated sensor's performance was finely-tuned to report on its various key components. The best response was achieved at 2 mg of the nanozyme, pH 6, time 150 seconds, TMB, and hydrogen peroxide 0.9 and 1.5 mM, respectively. Under the above-mentioned optimized conditions, the fabricated sensor detected uric acid in the range of 1–90 μM with limits of detection and quantification of 0.17 and 0.58 μM, respectively, with an R2 of 0.997. The proposed sensor was highly selective and successfully detected uric acid in real sample solutions.
1 Introduction
Uric acid is the final product produced from the metabolism of purine in the human body.1 The permissible range of uric acid is 120–520 μM in human serum and 1.4–4.4 mM in urine. In normal human physiology, there is a balance between its production and excretion. However, diet patterns and several other factors can result in a rise in the generation of uric acid. A steady increase in the level of uric acid has been observed in several people due to a change in diet pattern.2,3 The excess formation of uric acid results in the formation of monosodium urate crystals, which can be deposited in the joints. This can cause inflammation and severe pain. This abnormal level of uric acid is closely related to various diseases like Lesch–Nyhan syndrome, gout, hyperuricemia, renal failure, etc.4,5 Therefore, accurate monitoring of the level of uric acid in human blood and urine can help in the diagnosis and management of various diseases.Numerous analytical strategies, namely, fluorescence,6 chromatography,7 electrochemistry,8 capillary electrophoresis,9 uricase-based systems, etc.,10 have been reported for the accurate determination of uric acid in blood or urine. The mentioned methods have achieved good results, but still they have numerous shortcomings. These include high cost, the need for skilled personnel, sample pretreatment steps, and time consumption, to name a few. Conversely, the colorimetric method offers an alternative with greater flexibility, viability, accuracy, simplicity, and easy operation.11 Colorimetric methods can employ natural enzymes such as horse reddish peroxidase and alkaline phosphatase.12,13 However, the problems associated with the natural enzymes, such as their high cost, difficult maintenance, narrow range-bound temperature, and pH requirements, limit their viability.14 The rise of mimic enzymes has resulted in a great interest in the fabrication of colorimetric biosensors. In mimic enzymes, nanobiosensors have become a central point of attention for the research community. In addition, colorimetric sensors offer the advantage of naked-eye detection of the progress of a reaction.15,16
Despite their easy synthesis, tunable properties, and high catalytic activity, the evolution of nanomaterials has been held back by their tendency to agglomerate. This agglomeration of the nanomaterials causes polydispersity and a reduction in surface area, which results in a decrease in their catalytic activity.17,18 For this purpose, it is of utmost importance to achieve a homogenous distribution of nanomaterials to realize their true potential. The best strategy to overcome the agglomeration of nanomaterials is to use them in the form of composites. Different matrix materials have been used to keep the nanomaterials in homogeneous, dispersed form in the composite.15,19,20
Biochar is a commonly used matrix material that is produced through the pyrolysis of various feedstocks, ranging from agricultural residues to organic waste materials.21 Biochar has a wide surface area, a nanoporous structure, high reactive functionalities, a high level of conductivity, low cost, is biocompatible, and is ubiquitous.22 In addition, the renewable nature of the raw materials for its production makes it a favorable choice as a deagglomerating agent.23 Owing to the carbonaceous nature of biochar, its metal-based nanocomposites can easily be recycled.24 In addition, the nanocomposite was further macerated with citric acid to enhance its deagglomeration, biocompatibility, and conductivity. The selected capping and deagglomeration agent, i.e., citric acid, causes thermodynamic stability and is widely used as a coating material. It changes the surface charge and leaves additional carboxyl groups on the surface of nanoparticles.25
Transition metal-based nanoparticles have been a common focus of attention in recent years. Various metal- and metal oxide-based nanoparticles have been used so far. Among them, copper is an element that functions as a coenzyme in the body, is involved in various biological functions, and has lower toxicity.26 Copper-based nanomaterials have been used for the diagnosis of several biomarkers.27 Owing to their impressive properties, copper nanoparticles were impregnated on the surface of biochar and further functionalized with citric acid.
The novelty of this work lies in the fabrication and use of citric acid-functionalized copper biochar (CA-Cu@BC), a mimic enzyme for the colorimetric sensing of uric acid. The synthesis of the proposed mimic enzyme (CA-Cu@BC) was confirmed by the use of various techniques. In this way, a new, fast, sensitive, and selective method was developed for the sensing of uric acid. The progress of the proposed sensor was monitored through the use of the chromogenic substrate TMB (3,3′,5,5′-tetramethylbenzidine). Optimization experiments were performed to find the best performance of the fabricated mimic enzyme for the quantitative sensing of uric acid. The developed sensor with optimized conditions was successfully used to quantitatively assess uric acid in physiological solutions.
2 Experimental
2.1 Reagents and materials
Analytical-grade chemicals were used in all the experiments. All the chemicals were used as received without any further purification. Uric acid, TMB, CuSO4·5H2O, and sodium borohydride were acquired from Sigma-Aldrich. Other chemicals, such as citric acid and DMSO, were purchased from Daejung, South Korea. For the preparation of solutions, fresh double-distilled water, distilled in our lab, was used.2.2 Instrumentation
Fourier transform infrared spectroscopy analysis for the prepared material was performed using a thermonicolet Waltham, MA, 5700 spectrometer. The analysis was performed in the range of 4000–400 cm−1. For sample preparation, a few mg of the sample was mixed with KBr, and its pellets were formed via pressing. A UV-vis spectrophotometer acquired from Shimadzu, Japan, model no. 1800, was used throughout the experimental process for scanning the absorption spectra. For this purpose, quartz cuvettes were used and filled about 2/3 with the prepared sample solution. A ZEISS Gemini 500 Germany scanning electron microscope coupled to an EDS was used to study the surface morphology and elemental composition of the synthesized material, respectively. A JEM-2100F microscope (JEOL, Japan) transmission electron microscope was employed to study the microstructure of the prepared nanocomposite. The samples were dispersed evenly on double-sided conductive carbon tape attached to the SEM stub. The phase and crystallite size of the synthesized material were studied through a Bruker AXS D8 X-ray diffractometer. The samples were evenly distributed on flat surfaces and placed in an XRD holder. X-ray photoelectron microscopy was performed to report on the chemical environment of each element on the surface of the synthesized material using Escalab 250Xi (Thermo, USA). The samples were placed on indium foil, and the powder was pressed for even distribution. A biochar kiln with controllable temperature was used for the preparation of biochar from date palm roots. The thermal stability of the synthesized Cu@BC was assessed through Pyris-1, V-3.81 PerkinElmer. The heating rate was maintained at 10 °C min−1 from temperature to 800 °C under a nitrogen environment. The obtained data from these techniques was analyzed using standard protocols for the mentioned techniques.2.3 Preparation of biochar
The biochar was prepared using the biomass obtained from date palm (Phoenix dactylifera) root. The root was washed several times with water to remove dirt and other adhering materials. After washing, the biomass was dried and then pyrolyzed in a biochar kiln at 450 °C for 80 minutes, according to the earlier reported protocol.28 After the completion of the reaction, the reaction assembly was allowed to cool to room temperature. The biochar thus produced was taken out of the kiln and stored in plastic bottles for further use.2.4 Preparation of the composite
The preparation of the copper-doped biochar (Cu@BC) nanocomposite was performed in an airtight flask under the continuous supply of nitrogen gas. For this purpose, (A) 1 gram of biochar was suspended in 50 mL of water/ethanol (9![[thin space (1/6-em)]](https://www.rsc.org/images/entities/char_2009.gif) :
:![[thin space (1/6-em)]](https://www.rsc.org/images/entities/char_2009.gif) 1), followed by the addition of 50 mL of water solution containing 2.5 gram of CuSO4·5H2O. (B) On the other hand, 2.5 g of NaBH4 was dissolved in 70 mL of water. Solution (B) was added dropwise into solution (A) with continuous stirring for 6 hours. The solution mixture was centrifuged, and the supernatant was removed. The solid precipitate was washed with ethanol and kept in an oven for 20 hours at 60 °C for drying.29 The percentage yield was calculated to be 52%.
1), followed by the addition of 50 mL of water solution containing 2.5 gram of CuSO4·5H2O. (B) On the other hand, 2.5 g of NaBH4 was dissolved in 70 mL of water. Solution (B) was added dropwise into solution (A) with continuous stirring for 6 hours. The solution mixture was centrifuged, and the supernatant was removed. The solid precipitate was washed with ethanol and kept in an oven for 20 hours at 60 °C for drying.29 The percentage yield was calculated to be 52%.
2.5 Functionalization of the material
To further enhance conductivity and deagglomeration, the synthesized materials were functionalized with citric acid. For this purpose, 0.5 g of citric acid was dissolved in 6 mL of ethanol and stirred for 30 minutes. Subsequently, 1 g of Cu@BC was added to it and stirred again for 60 minutes. Afterwards, the solution mixture was dried at room temperature to obtain CA-Cu@BC nanocomposites. The as-prepared material was kept in an airtight bottle for further use.2.6 Colorimetric sensing of uric acid
For the colorimetric sensing of uric acid, various constituents of the proposed sensor were reacted together in an Eppendorf tube. For this purpose, 2 mg of the nanozyme, 250 μL of PBS solution (pH 6), 100 μL of TMB (0.9 mM), and 100 μL of H2O2 (1.5 mM) were added together. This resulted in an optical change that was visible to the naked eye and also confirmed through a UV-vis spectrophotometer. This was followed by the addition of the analyte (uric acid) at a specific concentration and incubation for a specific time. At ambient temperature, the reaction was monitored to detect optical changes in the solution mixture. The absorption spectra of the final solution were recorded using a UV-vis spectrophotometer. Finally, the fabricated sensor was successfully applied for sensing uric acid in real samples. The work was approved by the ethical committee of Kohat University of Science and Technology, via No. KUST/Ethical Committee/1628.3 Results and discussion
3.1 Characterization results
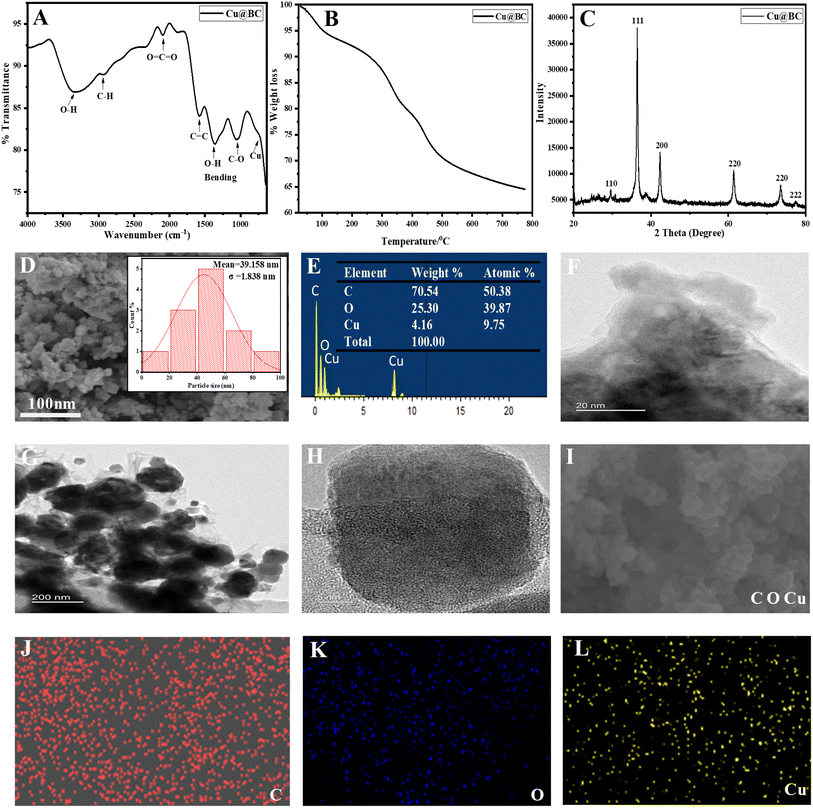
Before the application of the synthesized mimic enzyme, its synthesis was confirmed with the help of the following techniques.![[double bond, length as m-dash]](https://www.rsc.org/images/entities/char_e001.gif) C
C![[double bond, length as m-dash]](https://www.rsc.org/images/entities/char_e001.gif) C in the fabricated material. The peaks around 1580, 1350, and 1120 cm−1 indicate the presence of C
C in the fabricated material. The peaks around 1580, 1350, and 1120 cm−1 indicate the presence of C![[double bond, length as m-dash]](https://www.rsc.org/images/entities/char_e001.gif) C, O–H (bending), and C–O–C respectively. A peak around 650 cm−1 indicates the presence of doped copper in biochar.
C, O–H (bending), and C–O–C respectively. A peak around 650 cm−1 indicates the presence of doped copper in biochar.
To assess the thermal stability of the synthesized Cu@BC composite, thermal gravimetric analysis was carried out as shown in Fig. 1(B). The first prominent weight loss occurs at around 100 °C and can be attributed to the loss of moisture from the synthesized nanocomposite. A further increase in temperature leads to steady weight loss, which could be attributed to the various organic moieties in the biochar. At around 500 °C, the loss in weight almost becomes constant, and the char yield is around 65% at 750 °C. These results suggest the high thermal stability of the synthesized nanocomposite.
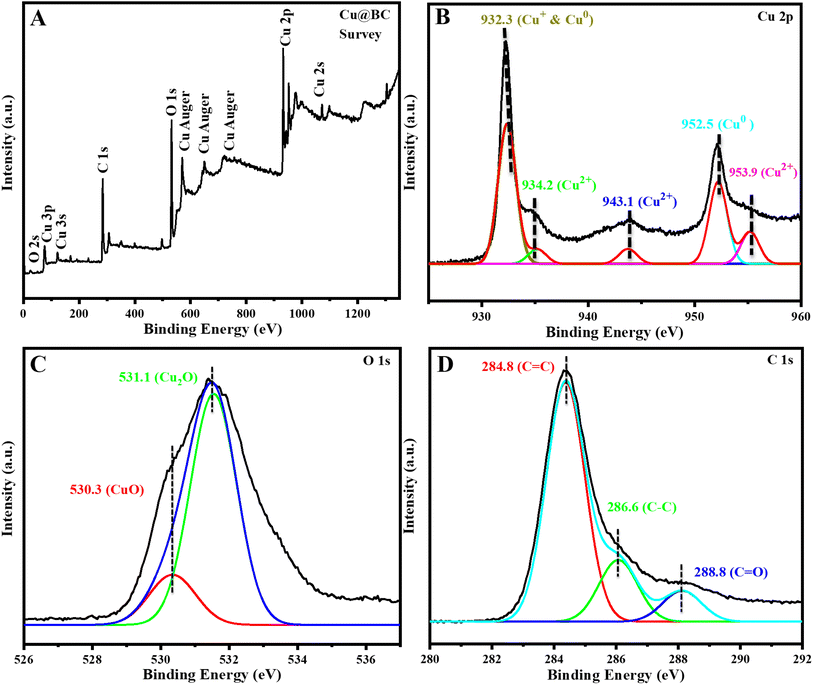
![[double bond, length as m-dash]](https://www.rsc.org/images/entities/char_e001.gif) C, C–C, and C
C, C–C, and C![[double bond, length as m-dash]](https://www.rsc.org/images/entities/char_e001.gif) O, respectively.
O, respectively.
3.2 Functionlization of the synthesized material
After the confirmation of the synthesis of Cu@BC by various techniques, the synthesized material was functionalized by citric acid. The selection of citric acid as a functionalization agent was preferred owing to its biocompatible nature, abundant availability, and low cost. This deagglomeration agent coated on the surface of the material (Cu@BC) produces a negative charge over the surface. These charges repel each other and keep the particles away from each other, so the surface area needed for catalytic reactions remains intact. In addition, it further increases the electron density and enhances conductivity on the synthesized platform. The schematic representation of the functionalization of Cu@BC to CA-Cu@BC is shown in Scheme 1.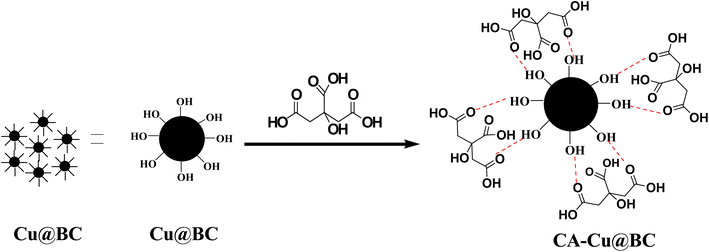 | ||
| Scheme 1 Schematic representation of the deagglomeration and surface functionalization achieved through capping of Cu@BC with citric acid. | ||
3.3 Proof of concept experiment
In an effort to prove the efficacy of the synthesized mimic enzyme, the reaction of chromogenic substrate oxidation was performed in the presence and absence of the nanozyme. It is clear from Fig. 3 that, in the absence of the mimic enzyme, hydrogen peroxide was able to oxidize TMB to a minimal extent under the prevailing conditions. The UV-vis spectrum of the reaction showed a less intense peak due to the lower amount of oxidized TMB. On the other hand, in the presence of the mimic enzyme, the oxidation of TMB resulted in an intense peak and color of TMB, as shown in the figure. It indicates that the fabricated mimic enzyme catalyzes the oxidation of TMB effectively.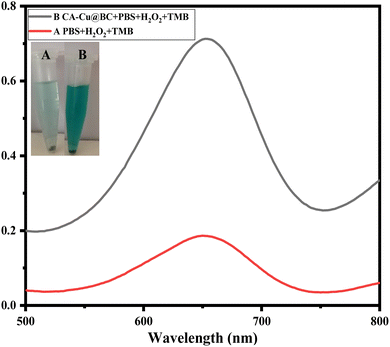 | ||
| Fig. 3 Both (A and B) and their corresponding spectra show the role of the synthesized mimic enzyme (CA-Cu@BC) in the oxidation of the chromogenic substrate TMB under the prevailing conditions. | ||
3.4 Optical detection of uric acid
Hydrogen peroxide, with the assistance of the proposed mimic enzyme (CA-Cu@BC), transforms the chromogenic substrate (TMB) into its oxidized form. This oxidation of TMB was visualized by the appearance of a blue-green color, and confirmation was done through a UV-vis spectrophotometer. This reaction set the stage for the incorporation of the analyte (uric acid) into the reaction mixture. The addition of uric acid results in a visible optical transformation from blue-green to colorless. This can be explained by the reduction of TMB accompanied by the oxidation of uric acid. This reduction was visualized through the unaided eye and confirmed again through a UV-vis spectrophotometer. The adjoining Fig. 4 shows the UV-vis spectra and the optical change visible to the naked eye during the course of the reaction.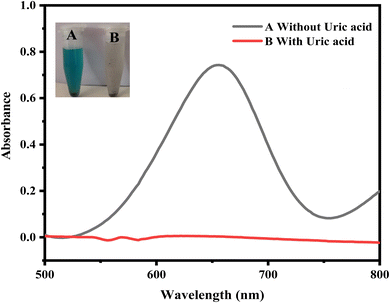 | ||
| Fig. 4 UV-vis spectra and corresponding optical changes before (A) and after (B) the addition of the uric acid. The addition of uric acid diminishes the peak of TMB, resulting in its reduction. | ||
3.5 Proposed mechanism of the reaction
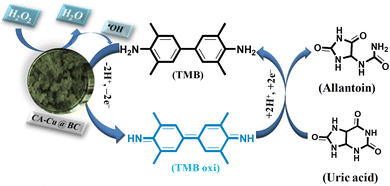
Hydrogen peroxide, with the catalytic assistance of a fabricated mimic enzyme (CA-Cu@BC), catalyzes the oxidation of TMB. This oxidation is triggered by the production of hydroxyl free radicals generated by the homolytic splitting of hydrogen peroxide. This generation of hydroxyl free radicals and the hemolytic splitting of hydrogen peroxide are not enough to adequately oxidize TMB. Here, the role of the mimic enzyme becomes crucial. Due to the enrichment of electron density, the mimic enzyme expedites the generation of abundant hydroxyl free radicals. These increased numbers of hydroxyl-free radicals attack the chromogenic substrate (TMB). As a result of this, extensive oxidation of TMB takes place, and the color of the solution mixture changes from colorless to an intense blue-green color.Mechanistically, this oxidation results in the conversion of the benzoid form of TMB into the quinoid form. This results in an increase in conjugation, and the energy gap between the frontier orbitals decreases. As a result of this, a red shift occurs, and the absorption takes place in the visible region at λmax of 652 nm. At this stage, the fabricated sensor is ready to sense uric acid. The incorporation of uric acid into the reaction mixture results in a reduction of the TMB coupled with an optical change visible to the naked eye. Since oxidation and reduction take place side by side, as TMB is reduced, the uric acid is oxidized to allantoin. The mechanistic pathway of the proposed mechanism is shown in Scheme 2.
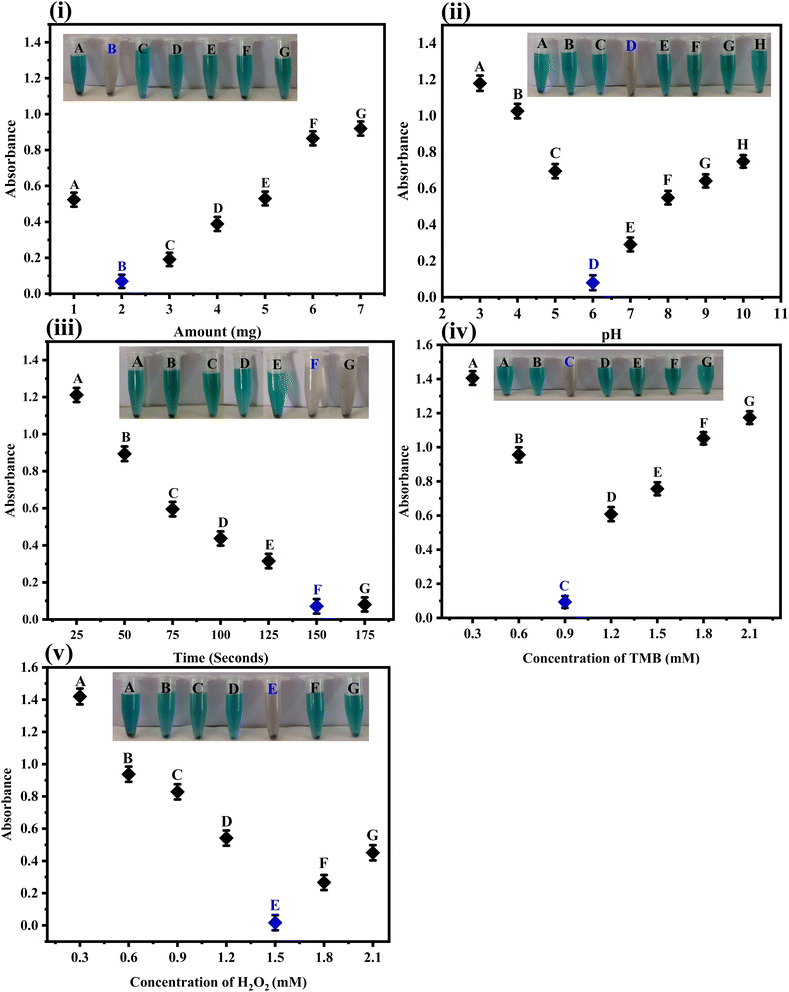
3.6 Optimization studies
In order to report on the fabricated sensor in its fine-tuned form, comprehensive optimization experiments were carried out as follows.3.7 Determination of the analytical merit of the fabricated sensing platform
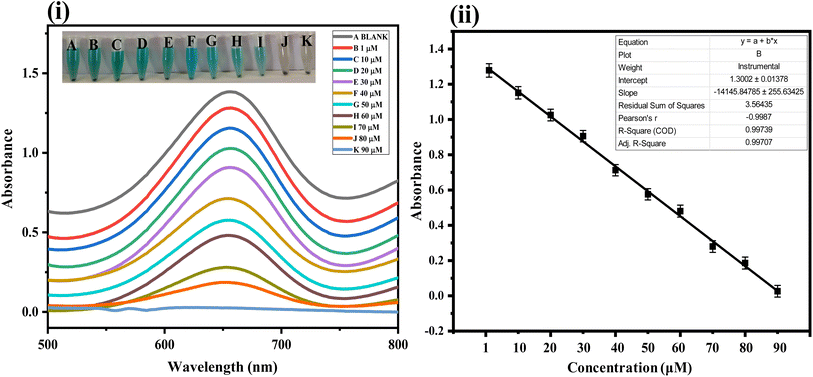
Capitalizing on the successful synthesis, characterization, and optimization of the fabricated sensor, its quantitative performance was tested. For this purpose, various concentration solutions of the analyte were tested with the fabricated sensor. The fabricated platform could detect the analyte under study at a wide range of concentrations. However, the linear response of the developed sensor could be achieved in the range of 1–90 μM, as shown in Fig. 6(i) and (ii). The linear regression coefficient in this linear range was calculated to be 0.997, indicating the higher linearity and precision of the fabricated sensor. Other key analytical indicators for the proposed sensor, such as limits of detection and quantification, were calculated to be 0.17 μM and 0.58 μM, respectively. The analytical performance of the fabricated sensor was compared with several other reported sensing platforms, as shown in Table 1. The results indicate that the fabricated sensor has a broad linear range and an excellent limit of detection and quantification.| S.·no | Analytical method | Linear range (μM) | LOD (μM) | References |
|---|---|---|---|---|
| 1 | HRP-CdS QDs | 125–1000 | 125 | 34 |
| 2 | MIL-53 (Fe) | 10–40 | 8.9 | 35 |
| 3 | Cu2+ NPs | 1–100 | 1.3 | 36 |
| 4 | AuNP/cMWCNT/Au | 10–800 | 10 | 37 |
| 5 | GCE/Lys/Au-NPs | 2–40 | 2.7 | 38 |
| 6 | CdTeNPs | 220–6000 | 100 | 39 |
| 7 | MIL-53 (Fe) | 10–40 | 8.9 | 40 |
| 8 | Luminol-K3[Fe(CN)6] | 4.8–179 | 3 | 41 |
| 9 | Uricase/BSA-stabilized Au nanoclusters | 2.0–200 | 0.36 | 42 |
| 10 | Nanocrystalline cobalt selenide TMB | 2.0–40 | 0.5 | 43 |
| 11 | CA-Cu@BC nanocomposite | 1–90 | 0.17 | Present work |
3.8 Selectivity of the proposed method
Despite all the other merits of any fabricated sensor, selectivity towards the analyte of interest is a key factor in assessing the performance of a sensor. In this regard, the selectivity of the sensor was examined for a variety of potential interfering species against uric acid. These include zinc, magnesium, calcium ions, glucose, dopamine, ascorbic acid, and their mixture, as shown in Fig. 7.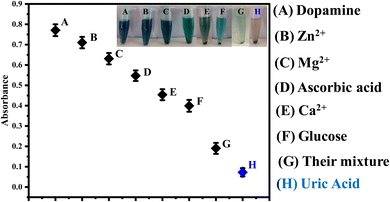 | ||
| Fig. 7 Interfering studies of the proposed sensor show that it is selective for uric acid in the presence of a number of various potential interfering species. | ||
3.9 Application of the fabricated sensor
To study the applicability of the fabricated sensor, uric acid was detected in real urine samples. For the quantitative investigation, urine samples were strategically diluted and processed for sensing through the optimized proposed sensor. Through this method, UA with varying amounts of 8, 23, and 42 μM were obtained through the already established calibration curve. Using a UV-vis spectrophotometer, the colorimetric change was confirmed, and the absorption peaks were noted at the λmax of 652 nm. The findings indicate that the developed sensing system is capable of figuring out the amounts of uric acid in real urine samples. The change in absorption spectra of TMB corresponds well with the change in concentration of the analyte under study, as illustrated in Fig. 8. In addition, the results of the application of the method to urine samples have also been given in Table 2.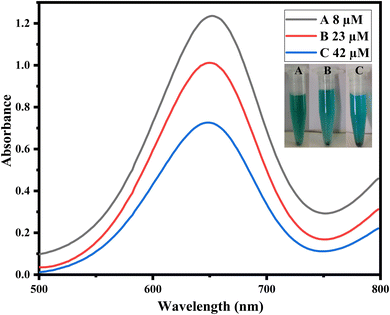 | ||
| Fig. 8 Real sample analysis in urine samples with varying concentrations of uric acids such as (A) 8, (B) 23, and (C) 42 μM. | ||
| S. no | Initial absorbance | Final absorbance | Uric acid found (μM) |
|---|---|---|---|
| 1 | 1.37 | 1.23±0.09 | 0.14±0.01 |
| 2 | 1.37 | 1.07±0.06 | 0.3±0.02 |
| 3 | 1.37 | 0.73±0.02 | 0.64±0.001 |
4 Conclusion
In conclusion, we have successfully synthesized copper biochar (Cu@BC) and capped it with citric acid to achieve citric acid-capped copper biochar (CA-Cu@BC). The entire set of necessary characterization techniques confirmed the desired synthesis. Based on the fabricated mimic enzyme, a new, easy-to-use, sensitive, low-cost, and selective optical sensor for uric acid was fabricated. Various optimization parameters were fine-tuned in order to report the newly synthesized sensor in its optimized form. Under the optimized conditions, the proposed sensing platform was able to detect uric acid in a wide linear range, with lower limits of detection and quantification when compared with the already reported sensors. The selectivity performance of the synthesized nanozyme was excellent when compared with other potential interfering species under the reported optimized conditions. The sensor system was successfully applied to detect uric acid in real urine samples. The proposed sensor has the potential to be translated into a robust, easy-to-use, low-cost, sensitive, and selective platform for the diagnosis, management, and monitoring of uric acid-related diseases.Data availability
The manuscript contains the majority of the data generated in the current work. Any additional information that may be required can be requested from the corresponding author on a reasonable basis.Conflicts of interest
The authors declare that they have no known competing financial interests or personal relationships that could have appeared to influence the work reported in this paper. The authors declare the following financial interests/personal relationships which may be considered as potential competing interests.Acknowledgements
Authors wish to thanks Researchers Supporting Project Number (RSP2024R171) at King Saud University Riyadh Saudi Arabia for financial support. The work is also supported by Open Foundation of Hainan International Joint Research Center of Marine Advanced Photoelectric Functional Materials (2024MAPFM01).References
- D. Huang, Y. Cheng, H. Xu, H. Zhang, L. Sheng and H. Xu, et al., The determination of uric acid in human body fluid samples using glassy carbon electrode activated by a simple electrochemical method, J. Solid State Electrochem., 2015, 19, 435–443 CrossRef CAS.
- Y. Li, X. Zhai, X. Liu, X. Ji and L. Wang, Voltammetric determination of uric acid in the presence of ascorbic acid and dopamine using chitosan/ionic liquid composite electrode, Ionics, 2014, 20, 1247–1254 CrossRef CAS.
- P. Xu, R. Li, Y. Tu and J. Yan, A gold nanocluster-based sensor for sensitive uric acid detection, Talanta, 2015, 144, 704–709 CrossRef CAS.
- U. Nishan, W. Ullah, N. Muhammad, M. Asad, S. Afridi and M. Khan, et al., Development of a nonenzymatic colorimetric sensor for the detection of uric acid based on ionic liquid-mediated nickel nanostructures, ACS Omega, 2022, 7, 26983–26991 CrossRef CAS.
- Q.-Q. Zhuang, Z.-H. Lin, Y.-C. Jiang, H.-H. Deng, S.-B. He and L.-T. Su, et al., Peroxidase-like activity of nanocrystalline cobalt selenide and its application for uric acid detection, Int. J. Nanomed., 2017, 3295–3302 CrossRef CAS.
- Y. Zhou, B. Liu, R. Yang and J. Liu, Filling in the gaps between nanozymes and enzymes: challenges and opportunities, Bioconjugate Chem., 2017, 28, 2903–2909 CrossRef CAS.
- P. Zhao, N. Li and D. Astruc, State of the art in gold nanoparticle synthesis, Coord. Chem. Rev., 2013, 257, 638–665 CrossRef CAS.
- K. Esumi, N. Takei and T. Yoshimura, Antioxidant-potentiality of gold–chitosan nanocomposites, Colloids Surf., B, 2003, 32, 117–123 CrossRef CAS.
- D. Wei, W. Qian, Y. Shi, S. Ding and Y. Xia, Mass synthesis of single-crystal gold nanosheets based on chitosan, Carbohydr. Res., 2007, 342, 2494–2499 CrossRef CAS PubMed.
- A. Murugadoss and H. Sakurai, Chitosan-stabilized gold, gold–palladium, and gold–platinum nanoclusters as efficient catalysts for aerobic oxidation of alcohols, J. Mol. Catal. A: Chem., 2011, 341, 1–6 CrossRef CAS.
- M. Asad, N. Muhammad, N. Khan, M. Shah, M. Khan and M. Khan, et al., Colorimetric acetone sensor based on ionic liquid functionalized drug-mediated silver nanostructures, J. Pharm. Biomed. Anal., 2022, 221, 115043 CrossRef CAS PubMed.
- U. Nishan, I. Ullah, N. Muhammad, S. Afridi, M. Asad and S. U. Haq, et al., Investigation of silver-doped iron oxide nanostructures functionalized with ionic liquid for colorimetric sensing of hydrogen peroxide, Arabian J. Sci. Eng., 2023, 48, 7703–7712 CrossRef CAS.
- P. Parthasarathy and S. Vivekanandan, A comprehensive review on thin film-based nano-biosensor for uric acid determination: arthritis diagnosis, World Rev. Sci. Technol. Sustain. Dev., 2018, 14, 52–71 CrossRef.
- K. Ragavan, S. R. Ahmed, X. Weng and S. Neethirajan, Chitosan as a peroxidase mimic: Paper based sensor for the detection of hydrogen peroxide, Sens. Actuators, B, 2018, 272, 8–13 CrossRef CAS.
- U. Nishan, A. Ahmed, N. Muhammad, M. Shah, M. Asad and N. Khan, et al., Uric acid quantification via colorimetric detection utilizing silver oxide-modified activated carbon nanoparticles functionalized with ionic liquid, RSC Adv., 2024, 14, 7022–7030 RSC.
- U. Nishan, A. Niaz, N. Muhammad, M. Asad, N. Khan and M. Khan, et al., Non-enzymatic colorimetric biosensor for hydrogen peroxide using lignin-based silver nanoparticles tuned with ionic liquid as a peroxidase mimic, Arabian J. Chem., 2021, 14, 103164 CrossRef CAS.
- U. Nishan, K. Ullah, N. Muhammad, A. Badshah, S. Afridi and N. Khan, et al., Environment-Friendly and Efficient Colorimetric Sensing of Hydrogen Peroxide Based on Dalbergia sissoo Sawdust-Deposited Nickel Nanoparticles, Waste Biomass Valorization, 2024, 1–12 Search PubMed.
- A. Khaliq, R. Nazir, M. Khan, A. Rahim, M. Asad and M. Shah, et al., Co-doped CeO2/activated C nanocomposite functionalized with ionic liquid for colorimetric biosensing of H2O2 via peroxidase mimicking, Molecules, 2023, 28, 3325 CrossRef CAS PubMed.
- U. Nishan, T. Zahra, A. Badshah, N. Muhammad, S. Afridi and M. Shah, et al., Colorimetric sensing of hydrogen peroxide using capped Morus nigra-sawdust deposited zinc oxide nanoparticles via Trigonella foenum extract, Front. Bioeng. Biotechnol., 2024, 12, 1338920 CrossRef PubMed.
- J. Wang, X. Fang, Y. Zhang, X. Cui, H. Zhao and X. Li, et al., A simple and rapid colorimetric probe for uric acid detection based on redox reaction of 3, 3′, 5, 5′-tetramethylbenzidine with HAuCl4, Colloids Surf., A, 2018, 555, 565–571 CrossRef CAS.
- M. Ahmad, A. U. Rajapaksha, J. E. Lim, M. Zhang, N. Bolan and D. Mohan, et al., Biochar as a sorbent for contaminant management in soil and water: a review, Chemosphere, 2014, 99, 19–33 CrossRef CAS PubMed.
- R. Amen, H. Bashir, I. Bibi, S. M. Shaheen, N. K. Niazi and M. Shahid, et al., A critical review on arsenic removal from water using biochar-based sorbents: the significance of modification and redox reactions, Chem. Eng. J., 2020, 396, 125195 CrossRef CAS.
- E. Wen, X. Yang, H. Chen, S. M. Shaheen, B. Sarkar and S. Xu, et al., Iron-modified biochar and water management regime-induced changes in plant growth, enzyme activities, and phytoavailability of arsenic, cadmium and lead in a paddy soil, J. Hazard. Mater., 2021, 407, 124344 CrossRef CAS PubMed.
- A. Banu, A. M. Antony, B. S. Sasidhar, S. A. Patil and S. A. Patil, Palladium Nanoparticles Grafted onto Phytochemical Functionalized Biochar: A Sustainable Nanozyme for Colorimetric Sensing of Glucose and Glutathione, Molecules, 2023, 28, 6676 CrossRef CAS PubMed.
- V. Mikelashvili, S. Kekutia, J. Markhulia, L. Saneblidze, N. Maisuradze and M. Kriechbaum, et al., Synthesis and characterization of citric acid-modified iron oxide nanoparticles prepared with electrohydraulic discharge treatment, Materials, 2023, 16, 746 CrossRef CAS PubMed.
- M. Solioz and M. Solioz, “Copper—A Modern Bioelement”, Copper and Bacteria: Evolution, Homeostasis and Toxicity, 2018, pp. 1–9 Search PubMed.
- S. H. Baek, J. Roh, C. Y. Park, M. W. Kim, R. Shi and S. K. Kailasa, et al., Cu-nanoflower decorated gold nanoparticles-graphene oxide nanofiber as electrochemical biosensor for glucose detection, Mater. Sci. Eng., C, 2020, 107, 110273 CrossRef CAS.
- N. S. Shah, J. A. Khan, M. Sayed, J. Iqbal, Z. U. H. Khan and N. Muhammad, et al., Nano-zerovalent copper as a Fenton-like catalyst for the degradation of ciprofloxacin in aqueous solution, J. Water Process Eng., 2020, 37, 101325 CrossRef.
- J. Iqbal, N. S. Shah, M. Sayed, N. K. Niazi, M. Imran and J. A. Khan, et al., Nano-zerovalent manganese/biochar composite for the adsorptive and oxidative removal of Congo-red dye from aqueous solutions, J. Hazard. Mater., 2021, 403, 123854 CrossRef CAS.
- N. H. Lam, R. P. Smith, N. Le, C. T. T. Thuy, M. S. Tamboli and A. M. Tamboli, et al., Evaluation of the structural deviation of Cu/Cu2O nanocomposite using the X-ray diffraction analysis methods, Crystals, 2022, 12, 566 CrossRef CAS.
- D. S. Kozak, R. A. Sergiienko, E. Shibata, A. Iizuka and T. Nakamura, Non-electrolytic synthesis of copper oxide/carbon nanocomposite by surface plasma in super-dehydrated ethanol, Sci. Rep., 2016, 6, 21178 CrossRef CAS.
- L. Xu, J. Li, H. Sun, X. Guo, J. Xu and H. Zhang, et al., In situ growth of Cu2O/CuO nanosheets on Cu coating carbon cloths as a binder-free electrode for asymmetric supercapacitors, Front. Chem., 2019, 7, 420 CrossRef CAS.
- Y. Pan, Y. Yang, Y. Pang, Y. Shi, Y. Long and H. Zheng, Enhancing the peroxidase-like activity of ficin via heme binding and colorimetric detection for uric acid, Talanta, 2018, 185, 433–438 CrossRef CAS.
- N. E. Azmi, N. I. Ramli, J. Abdullah, M. A. A. Hamid, H. Sidek and S. Abd Rahman, et al., A simple and sensitive fluorescence based biosensor for the determination of uric acid using H2O2-sensitive quantum dots/dual enzymes, Biosens. Bioelectron., 2015, 67, 129–133 CrossRef CAS PubMed.
- J. Lu, Y. Xiong, C. Liao and F. Ye, Colorimetric detection of uric acid in human urine and serum based on peroxidase mimetic activity of MIL-53 (Fe), Anal. Methods, 2015, 7, 9894–9899 RSC.
- H.-F. Lu, J.-Y. Li, M.-M. Zhang, D. Wu and Q.-L. Zhang, A highly selective and sensitive colorimetric uric acid biosensor based on Cu (II)-catalyzed oxidation of 3, 3′, 5, 5′-tetramethylbenzidine, Sens. Actuators, B, 2017, 244, 77–83 CrossRef CAS.
- N. Chauhan and C. S. Pundir, An amperometric uric acid biosensor based on multiwalled carbon nanotube–gold nanoparticle composite, Anal. Biochem., 2011, 413, 97–103 CrossRef CAS PubMed.
- T. L. Le, Q. K. Dinh, T. H. Tran, H. P. Nguyen, T. L. H. Hoang and Q. H. Nguyen, Synthesis of water soluble chitosan stabilized gold nanoparticles and determination of uric acid, Adv. Nat. Sci.: Nanosci. Nanotechnol., 2014, 5, 025014 CAS.
- D. Jin, M.-H. Seo, B. T. Huy, Q.-T. Pham, M. L. Conte and D. Thangadurai, et al., Quantitative determination of uric acid using CdTe nanoparticles as fluorescence probes, Biosens. Bioelectron., 2016, 77, 359–365 CrossRef CAS.
- M. N. Cardoza-Contreras, J. M. Romo-Herrera, L. A. Ríos, R. García-Gutiérrez, T. Zepeda and O. E. Contreras, Single ZnO nanowire-based gas sensors to detect low concentrations of hydrogen, Sensors, 2015, 15, 30539–30544 CrossRef CAS PubMed.
- D. He, Z. Zhang, Y. Huang, Y. Hu, H. Zhou and D. Chen, Chemiluminescence microflow injection analysis system on a chip for the determination of uric acid without enzyme, Luminescence, 2005, 20, 271–275 CrossRef CAS.
- H. Zhao, Z. Wang, X. Jiao, L. Zhang and Y. Lv, Uricase-based highly sensitive and selective spectrophotometric determination of uric acid using BSA-stabilized Au nanoclusters as artificial enzyme, Spectrosc. Lett., 2012, 45, 511–519 CrossRef CAS.
- Q.-Q. Zhuang, Z.-H. Lin, Y.-C. Jiang, H.-H. Deng, S.-B. He and L.-T. Su, et al., Peroxidase-like activity of nanocrystalline cobalt selenide and its application for uric acid detection, Int. J. Nanomed., 2017, 12, 3295 CrossRef CAS PubMed.
| This journal is © The Royal Society of Chemistry 2024 |

