 Open Access Article
Synthesis, structure, and superconductivity of La7+2xSr1−4xKxNaxCu4O16−δ†
Deyang Xua,
Guohong Caib,
Peiliang Huangc,
Xi Wud,
Yan Wangb,
Jinling Gengb,
Jing Ju b,
Xiaoge Wangb,
Congling Yin
 *a and
Guobao Li
 *b
*b
aMOE Key Laboratory of New Processing Technology for Nonferrous Metal and Materials, Guangxi Key Laboratory of Optical and Electronic Materials and Devices, College of Materials Science and Engineering, Guilin University of Technology, Guilin 541004, People's Republic of China
bBeijing National Laboratory for Molecular Sciences, State Key Laboratory of Rare Earth Materials Chemistry and Applications, College of Chemistry and Molecular Engineering, Peking University, Beijing, 100871, People's Republic of China
cBeijing Ritan High School, Beijing, 100020, People's Republic of China
dHenan Institute of Chemical Technology, Kaifeng, 475000, People's Republic of China. E-mail: congling.yin@glut.edu.cn; liguobao@pku.edu.cn
First published on 6th November 2024
Abstract
Sodium and potassium have been doped into La7SrCu4O16−δ to form La7+2xSr1−4xKxNaxCu4O16−δ solid solutions by a solid-state reaction, which crystallizes in the I4/mmm space group when 0 ≤ x < 0.16 and Fmmm when 0.16 < x ≤ 0.25. With the equivalent replacement of four Sr2+ by one Na+, one K+ and two La3+, it is very interesting to find that Tzeroc (the definition is presented in the introduction part) of La7+2xSr1−4xKxNaxCu4O16−δ does not remain constant with an increase in x but first increases from 14.8 K for x = 0.00 to 33.9 K for x = 0.10 and then decreases to 18.5 K for x = 0.175.
1. Introduction
Since J. G. Bednorz et al.1 first discovered superconductivity in the La–Ba–Cu–O system with Tonsetc (a transition temperature at which the resistivity begins to drop rapidly to “zero” with a decrease in temperature, indicating the onset of superconductivity) at about 30 K and Tzeroc (the highest temperature at which the resistivity of the sample reaches “zero”, marking the full superconducting state) at about 20 K, the mechanism of high Tc (a general term for the phase transition temperature, which can be one of Tonsetc, Tzeroc, and Tmagc (the temperature at which the magnetization of the sample starts to decrease to negative values with a decrease of temperature, indicating the start of the Meissner effect) for a superconductor) has been widely investigated, and new materials with higher Tc have been explored.2,3 La2CuO4−δ materials are called “model materials” for the study of superconductivity due to their simple formulation and structure,4 which provides a unique opportunity to investigate the relationship between the structure and superconducting properties.5 The widely studied Sr-substituted compound La2−xSrxCuO4−δ is the copper oxide compound that can be varied over a wide enough range to obtain a full spectrum of electronic properties.6 As the Sr content increases, it goes from antiferromagnetic insulator (0 ≤ x ≤ 0.03) to superconductor (0.07 ≤ x ≤ 0.27) to non-superconducting metal (x ≥ 0.27).7 Many attempts have been made to investigate the relationship with Tc in La2−xSrxCuO4−δ systems by adding new doping elements and changing the doping amount. J. P. Attfield et al.8 have shown that the Tc of (Ln1−xMx)2CuO4−δ (Ln = La and other lanthanides, M = Ca, Sr, and Ba) superconductors depends on the doping level x and the average A-site cation radius.9,10 More complex doping compounds, such as (La0.925Sr0.075−xBax)2CuO4−δ,11 (La0.925−xLnxSr0.075)2CuO4−δ (Ln = Pr, Nd, Sm, Eu),10,12 have also been studied, which indicates that Tc is also affected by the change in the ionic radius at the A-site. M. A. Subramanian et al.13 have reported the superconductivity of La2−xAx1+CuO4−δ (A = Na, K) with Tonsetc ∼40 K, which confirms the feasibility of A-site doping with alkali metal cations. The elements Na and K can influence the crystal structure and electronic properties of copper oxide superconductors due to their unique electronic configurations.14,15 They also help to lower the sintering temperature, promote sintering, and inhibit grain growth.16 Therefore, combining Na and K into La2−xSrxCuO4−δ matrices provides an interesting avenue to tailor the electronic structure and superconducting properties of the materials. In the La2−xSrxCuO4−δ system, superconductivity is usually reported when 0.05 < x < 0.27, x = 0.15, which is identified as the optimal doping concentration.17 Many studies relating to the optimal doping of La1.85Sr0.15CuO4−δ have been performed.18–22 The research on the over-doped range (0.15 ≤ x ≤ 0.27) should be enhanced. Therefore, La1.75Sr0.25CuO4−δ/4 (which can also be noted as La7SrCu4O16−δ) is chosen as the solid solution matrix, serving as a starting point for further investigation. To reduce the change in the average A-site cation radius to limit the size effect on Tc suggested by J. P. Attfield et al.,8 one K+, one Na+, and two La3+ were chosen to replace four Sr2+ (the details are shown in section 3.1). Then, the nominal compounds La7+2xSr1−4xKxNaxCu4O16−δ were tried. In this case, it is found that the above doping is just an equivalent doping, which introduces no additional electron or hole into the synthesized compound if δ is not changed. This means that the Tc of La7+2xSr1−4xKxNaxCu4O16−δ may remain constant if we believe that the Tc of doped La2CuO4−δ is strongly related to the hole content. However, the Tzeroc of La7+2xSr1−4xKxNaxCu4O16−δ is raised to 33.9 K for x = 0.10 from 14.8 K for x = 0.00, then finally lowered to 18.5 K for x = 0.175. The details for such an interesting phenomenon and the possible explanation about the influence of K and Na ions on the superconductivity are presented below.2. Experimental
The samples with the nominal formula La7+2xSr1−4xKxNaxCu4O16−δ (x = 0.0, 0.025, 0.050, 0.075, 0.100, 0.125, 0.150, 0.175, 0.200, 0.225 and 0.250, denoted as LSKNCO1, LSKNCO2, …, and LSKNCO11, respectively) were synthesized. La2O3 (99.95%), SrCO3 (A.R.), K2CO3 (A.R.), Na2CO3 (A.R.), and CuO (A.R.) were used as raw materials. The oven-dried raw materials were weighed according to the molar ratios of the nominal formula La7+2xSr1−4xKxNaxCu4O16−δ and homogenized by about 30 min of grinding for total 10 g of mixtures with an agate mortar and a pestle. These mixtures were sintered first at 900 °C for 12 h. Then, the reacted powders were pressed into pellets under 30 MPa and sintered at 920 °C for 12 h. The sintered mass was again crushed, pulverized, and pressed into cylindrical pellets to undertake five 12 h heat treatments at 1100 °C (LSKNCO1, LSKNCO2, LSKNCO3), 1080 °C (LSKNCO4, LSKNCO5), 1060 °C (LSKNCO6), 1020 °C (LSKNCO7), and 960 °C (LSKNCO8, LSKNCO9, LSKNCO10, LSKNCO11). All the treatments were performed in air.Powder X-ray diffraction (PXRD) data of La7+2xSr1−4xKxNaxCu4O16−δ were collected on a PANalytical X'Pert PRO (The Netherlands) with Cu Kα (λ1 = 1.5405 Å and λ2 = 1.5443 Å) radiation over a wide 2θ range (5°–120°) at a scan rate of 1° per minute. Time-of-flight (TOF) neutron powder diffraction (NPD) data were collected for the samples LSKNCO2, LSKNCO5, and LSKNCO9 using the General-Purpose Powder Diffractometer (GPPD) at the China Scattering Neutron Source (CSNS, Dongguan, China). Rietveld refinements were performed for the XRD patterns and neutron diffraction patterns using TOPAS-Academic software.23 Selected area electron diffraction (SAED) was performed on a JEM2100 (accelerating voltage: 200 kV). X-ray photoelectron spectroscopy (XPS) was carried out using a Kratos Axis Ultra spectrometer (UK) at a voltage of 15 kV and a current of 15 mA. The vacuum of the instrument during the test was about 10−10 mbar, and the chamber pressure was not greater than 5.0 × 10⁻⁹ torr. All the acquired energy spectral data were calibrated with the C 1s emission at Eb = 284.8 eV. Direct-current (dc) magnetic susceptibility was recorded in a magnetic field of 10 Oe while heating the sample from 2 K to 300 K after zero-field cooling (ZFC) and field cooling (FC) using an MPMS-3 Superconducting Quantum Interference Device (SQUID, Quantum Design) magnetometer. The resistivity was investigated with a cryogenic liquid helium-free physical property measurement system (PPMS, supplied by East Changing, China) from 2 to 120 K. Scanning electron microscopy (SEM) imaging and elemental analysis through energy-dispersive X-ray spectroscopy (EDS) were performed using an SU8600 (Hitachi, Japan) field-emission scanning electron microscope equipped with an XFlash 760 (Bruker, Germany) EDS spectrometer.
3. Results and discussion
3.1 Solid solution and structure of La7+2xSr1−4xKxNaxCu4O16−δ
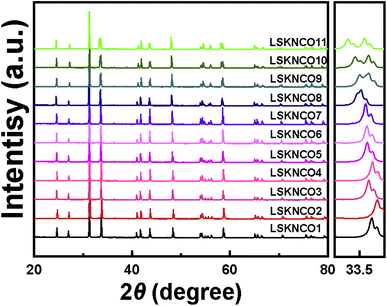
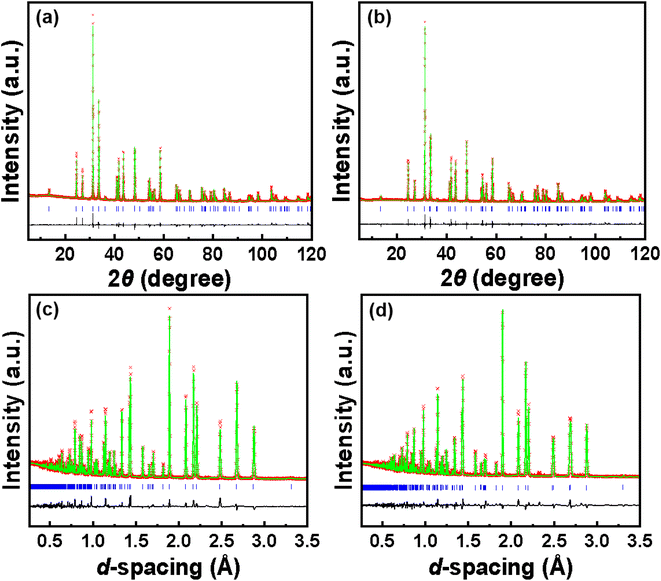
The powder XRD patterns of samples LSKNCO1 to LSKNCO11 are depicted in Fig. 1. The powder XRD patterns of LSKNCO2 to LSKNCO7 closely resemble that of LSKNCO1 (La1.75Sr0.25CuO4−δ/4), suggesting a similarity in their structures to La1.75Sr0.25CuO4−δ/4, which was reported to crystallize in a tetragonal space group.17 When more Na and K are doped into the compound, some reflection peaks are split, as shown at the right hand of Fig. 1, at 2 theta of about 33.5° for the samples LSKNCO8 to LSKNCO11, which may mean that these samples crystalize in the orthogonal space group, similar as that of La2CuO4−δ.3 Therefore, the structures of La1.75Sr0.25CuO4−δ/4 and La2CuO4−δ were used as the starting structure in the Rietveld refinement of the X-ray diffraction patterns of LSKNCO1 to LSKNCO7 and LSKNCO8 to LSKNCO11, respectively. Reasonable refinement results were obtained with Rpx ≤ 0.032, Rwpx ≤ 0.045. Neutron diffraction data of the selected samples LSKNCO2 (tetragonal phase), LSKNCO5 (tetragonal phase), and LSKNCO9 (orthogonal phase) were obtained and are refined well using the same lattice parameters and atomic coordination as those used in the refinement of the X-ray diffraction patterns for the corresponding samples with Rpn ≤ 0.048, Rwpn ≤ 0.062, which confirms that the results obtained from the X-ray diffraction data are plausible. Typical Rietveld plots of the X-ray and neutron diffraction data for La7+2xSr1−4xKxNaxCu4O16−δ with x = 0.1 and 0.2 are shown in Fig. 2 and the corresponding refinement details are listed in Table 1 (the others are shown in Fig. S1 to S9 and Tables S1 to S4 in ESI†).| Sample | LSKNCO5, x = 0.100 | LSKNCO9, x = 0.200 |
|---|---|---|
a The occupancy of La/Sr/K/Na is 0.9000![[thin space (1/6-em)]](https://www.rsc.org/images/entities/char_2009.gif) : :![[thin space (1/6-em)]](https://www.rsc.org/images/entities/char_2009.gif) 0.0750 0.0750![[thin space (1/6-em)]](https://www.rsc.org/images/entities/char_2009.gif) : :![[thin space (1/6-em)]](https://www.rsc.org/images/entities/char_2009.gif) 0.0125 0.0125![[thin space (1/6-em)]](https://www.rsc.org/images/entities/char_2009.gif) : :![[thin space (1/6-em)]](https://www.rsc.org/images/entities/char_2009.gif) 0.0125 for x = 0.100, and 0.925 0.0125 for x = 0.100, and 0.925![[thin space (1/6-em)]](https://www.rsc.org/images/entities/char_2009.gif) : :![[thin space (1/6-em)]](https://www.rsc.org/images/entities/char_2009.gif) 0.025 0.025![[thin space (1/6-em)]](https://www.rsc.org/images/entities/char_2009.gif) : :![[thin space (1/6-em)]](https://www.rsc.org/images/entities/char_2009.gif) 0.025 0.025![[thin space (1/6-em)]](https://www.rsc.org/images/entities/char_2009.gif) : :![[thin space (1/6-em)]](https://www.rsc.org/images/entities/char_2009.gif) 0.025 for x = 0.200.b Beq is the thermal displacement parameter.c Rwpx and Rwpn are the weighted R factors calculated by (sum(w(I0 − Ic)2)/sum(w(I02))0.5) for powder X-ray and neutron diffraction data, respectively; Rpx and Rpn are the R factors calculated by sum(|I0 – Ic|/sum(I0) for powder X-ray and neutron diffraction data, respectively. 0.025 for x = 0.200.b Beq is the thermal displacement parameter.c Rwpx and Rwpn are the weighted R factors calculated by (sum(w(I0 − Ic)2)/sum(w(I02))0.5) for powder X-ray and neutron diffraction data, respectively; Rpx and Rpn are the R factors calculated by sum(|I0 – Ic|/sum(I0) for powder X-ray and neutron diffraction data, respectively. |
||
| Lattice parameters (Å) | a = b = 3.7781(2), c = 13.2411(5) | a = 5.3540(2), b = 5.3769(1), c = 13.1962(5) |
| Space group | I4/mmm | Fmmm |
| Atom | (x, y, z) | (x, y, z) |
| La/Sr/K/Naa | 0, 0, 0.3609(3) | 0, 0, 0.3611(3) |
| Cu1 | 0, 0, 0 | 0, 0, 0 |
| O1 | 0, 1/2, 0 | 1/4, 1/4, 0 |
| O2 | 0, 0, 0.1814(6) | 0, 0, 0.1867(8) |
| Beq(La/Sr/K/Na) (Å2)b | 1.02(1) | 0.65(1) |
| Beq(Cu) (Å2) | 1.29(1) | 0.99(1) |
| Beq(O1) (Å2) | 1.17(1) | 0.55(1) |
| Beq(O2) (Å2) | 2.13(1) | 2.42(2) |
| R factorc | Rwpx = 0.040, Rwpn = 0.062, Rpx = 0.020, Rpn = 0.044 | Rwpx = 0.044, Rwpn = 0.054, Rpx = 0.032, Rpn = 0.048 |
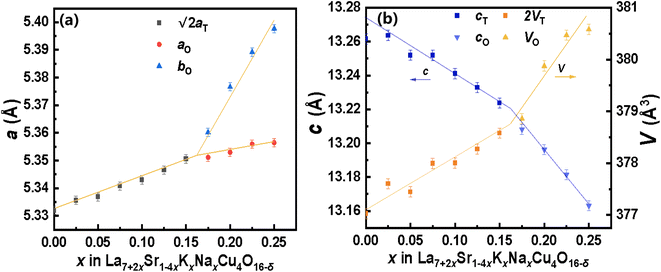
Through the Rietveld refinement, the lattice parameters and unit cell volume of La7+2xSr1−4xKxNaxCu4O16−δ were obtained and are presented in Fig. 3, where the data corresponding to the √2aT and 2VT of the tetragonal phase were used to simplify the comparison. The lattice parameter a of the tetragonal La7+2xSr1−4xKxNaxCu4O16−δ phase (noted as aT) increases with an increase in the Na and K content until x ≈ 0.16. When x > 0.16, the orthogonal La7+2xSr1−4xKxNaxCu4O16−δ phase appears. The lattice parameters a and b of the La7+2xSr1−4xKxNaxCu4O16−δ phase (noted as ao and bo, respectively) also increase with an increase in the Na and K content. The lattice parameter c of the tetragonal La7+2xSr1−4xKxNaxCu4O16−δ (cT) and the orthogonal La7+2xSr1−4xKxNaxCu4O16−δ (co) are similar to each other, as shown in Fig. 3b. They decrease in a different slope with the increase in the Na and K content in the samples with x = 0.16 as the boundary. Simultaneously, the unit cell volume of the tetragonal La7+2xSr1−4xKxNaxCu4O16−δ and the orthogonal La7+2xSr1−4xKxNaxCu4O16−δ increases in a different slope before and after x = 0.16. Therefore, the tetragonal to orthogonal phase transition occurs at about x = 0.16 for the La7+2xSr1−4xKxNaxCu4O16−δ system.
It is known that La, Sr, Na, K in La7+2xSr1−4xKxNaxCu4O16−δ are situated at the same crystallographic site (noted as the La site here), which is nine-coordinated to oxygen atoms in the I4/mmm or Fmmm space group. Therefore, the radius of La3+, Sr2+, Na+, and K+ under nine-coordination is used to consider the change in the lattice parameters, which are 1.212 Å, 1.31 Å, 1.24 Å, and 1.55 Å, respectively. The change Δ in the average radius of La site is denoted as follows.
| Δ = (2rLa3+ (IX) + rK+ (IX) + rNa+ (IX) − 4rSr2+ (IX)) x/4 = −0.0065x (Å) | (1) |
Eqn (1) indicates that the average radius of the La site should decrease with an increase in the Na and K contents in the samples, which will reduce the volume of the unit cell of the sample. However, the data shown in Fig. 3b tell us that the volume of the unit cell of La7+2xSr1−4xKxNaxCu4O16−δ increases with an increase in the Na and K contents in the sample, which means that the radius data for La3+, Sr2+, Na+, and K+ under nine-coordination are not suitable for the present compound La7+2xSr1−4xKxNaxCu4O16−δ. For the La7+2xSr1−4xKxNaxCu4O16−δ system, the average radius of the La site should increase with four Sr2+ replaced by two La3+, one Na+ and one K+. Then, the increase in the lattice parameters aT, ao, and bo can be attributed to this increase in the average radius of the La site. The decrease in the lattice parameters cT and co may be explained by the “shrinkage effect”: expansion of the aT, ao, and bo axis allows the layers to be closer together to shrink the cT and co axis. This phenomenon is similar to the findings in ZrSi1−xGexTe solid solutions by C. Wang et al.24 A. Kimura et al. also found that on adding larger Cr and Ti atoms into the AlN lattice, the hexagonal lattice spacings expanded in the a-direction and shrank in the c-direction.25
It was found that the lattice parameter a of La2−xSrxCuO4−δ (0.1 ≤ x ≤ 0.25) reported by J. M. Tarascon26 also decreases with an increase in Sr, which is very similar to that of our La7+2xSr1−4xKxNaxCu4O16−δ samples (shown in Fig. S10†). However, the lattice parameter c and the unit cell volume of La2−xSrxCuO4−δ are smaller than those of La7+2xSr1−4xKxNaxCu4O16−δ with the same amount of Sr in the sample (shown in Fig. S10†), which supports that K+ and Na+ should occupy the La sites as these larger ions expand the lattice (see ESI† for the details).
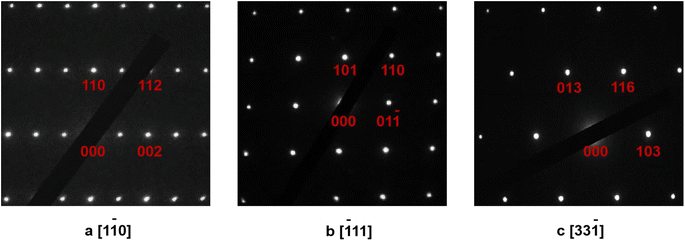
The SAED (selected-area electron diffraction) patterns are very useful to check the choice of the space group for the studied materials.27,28 Therefore, the SAED patterns of the selected samples in the La7+2xSr1−4xKxNaxCu4O16−δ system have been obtained with the typical data shown in Fig. 4 for LSKNCO5. The tetragonal space group I4/mmm with lattice parameters a ≈ 3.778 Å, b ≈ 3.778 Å, c ≈ 13.241 Å, α = 90°, β = 90°, γ = 90° can adequately index the corresponding points, indicating that the space group I4/mmm can be used to describe the structures of LSKNCO5. As the X-ray diffraction patterns of LSKNCO1 to LSKNCO7 are almost the same as that of LSKNCO5, the space group I4/mmm can also be used to describe the structures of LSKNCO1 to LSKNCO7.
In order to access the contents of Na and K in La7+2xSr1−4xKxNaxCu4O16−δ, EDX analysis was performed on LSKNCO9 and LSKNCO11 (see Fig. S11 and S12†). It was found that the La![[thin space (1/6-em)]](https://www.rsc.org/images/entities/char_2009.gif) :
:![[thin space (1/6-em)]](https://www.rsc.org/images/entities/char_2009.gif) Sr
Sr![[thin space (1/6-em)]](https://www.rsc.org/images/entities/char_2009.gif) :
:![[thin space (1/6-em)]](https://www.rsc.org/images/entities/char_2009.gif) K
K![[thin space (1/6-em)]](https://www.rsc.org/images/entities/char_2009.gif) :
:![[thin space (1/6-em)]](https://www.rsc.org/images/entities/char_2009.gif) Na
Na![[thin space (1/6-em)]](https://www.rsc.org/images/entities/char_2009.gif) :
:![[thin space (1/6-em)]](https://www.rsc.org/images/entities/char_2009.gif) Cu ratio of LSKNCO9 was 27.88
Cu ratio of LSKNCO9 was 27.88![[thin space (1/6-em)]](https://www.rsc.org/images/entities/char_2009.gif) :
:![[thin space (1/6-em)]](https://www.rsc.org/images/entities/char_2009.gif) 0.68
0.68![[thin space (1/6-em)]](https://www.rsc.org/images/entities/char_2009.gif) :
:![[thin space (1/6-em)]](https://www.rsc.org/images/entities/char_2009.gif) 0.76
0.76![[thin space (1/6-em)]](https://www.rsc.org/images/entities/char_2009.gif) :
:![[thin space (1/6-em)]](https://www.rsc.org/images/entities/char_2009.gif) 0.82
0.82![[thin space (1/6-em)]](https://www.rsc.org/images/entities/char_2009.gif) :
:![[thin space (1/6-em)]](https://www.rsc.org/images/entities/char_2009.gif) 15.76 (corresponding to 7.34
15.76 (corresponding to 7.34![[thin space (1/6-em)]](https://www.rsc.org/images/entities/char_2009.gif) :
:![[thin space (1/6-em)]](https://www.rsc.org/images/entities/char_2009.gif) 0.18
0.18![[thin space (1/6-em)]](https://www.rsc.org/images/entities/char_2009.gif) :
:![[thin space (1/6-em)]](https://www.rsc.org/images/entities/char_2009.gif) 0.20
0.20![[thin space (1/6-em)]](https://www.rsc.org/images/entities/char_2009.gif) :
:![[thin space (1/6-em)]](https://www.rsc.org/images/entities/char_2009.gif) 0.22
0.22![[thin space (1/6-em)]](https://www.rsc.org/images/entities/char_2009.gif) :
:![[thin space (1/6-em)]](https://www.rsc.org/images/entities/char_2009.gif) 4.15), and the La
4.15), and the La![[thin space (1/6-em)]](https://www.rsc.org/images/entities/char_2009.gif) :
:![[thin space (1/6-em)]](https://www.rsc.org/images/entities/char_2009.gif) K
K![[thin space (1/6-em)]](https://www.rsc.org/images/entities/char_2009.gif) :
:![[thin space (1/6-em)]](https://www.rsc.org/images/entities/char_2009.gif) Na
Na![[thin space (1/6-em)]](https://www.rsc.org/images/entities/char_2009.gif) :
:![[thin space (1/6-em)]](https://www.rsc.org/images/entities/char_2009.gif) Cu ratio of LSKNCO11 was 28.23
Cu ratio of LSKNCO11 was 28.23![[thin space (1/6-em)]](https://www.rsc.org/images/entities/char_2009.gif) :
:![[thin space (1/6-em)]](https://www.rsc.org/images/entities/char_2009.gif) 0.82
0.82![[thin space (1/6-em)]](https://www.rsc.org/images/entities/char_2009.gif) :
:![[thin space (1/6-em)]](https://www.rsc.org/images/entities/char_2009.gif) 0.94
0.94![[thin space (1/6-em)]](https://www.rsc.org/images/entities/char_2009.gif) :
:![[thin space (1/6-em)]](https://www.rsc.org/images/entities/char_2009.gif) 14.70 (corresponding to 8.02
14.70 (corresponding to 8.02![[thin space (1/6-em)]](https://www.rsc.org/images/entities/char_2009.gif) :
:![[thin space (1/6-em)]](https://www.rsc.org/images/entities/char_2009.gif) 0.23
0.23![[thin space (1/6-em)]](https://www.rsc.org/images/entities/char_2009.gif) :
:![[thin space (1/6-em)]](https://www.rsc.org/images/entities/char_2009.gif) 0.27
0.27![[thin space (1/6-em)]](https://www.rsc.org/images/entities/char_2009.gif) :
:![[thin space (1/6-em)]](https://www.rsc.org/images/entities/char_2009.gif) 4.18), which are essentially identical to their ideal values. Therefore, the chemical composition of the samples aligns with the planned formula.
4.18), which are essentially identical to their ideal values. Therefore, the chemical composition of the samples aligns with the planned formula.
3.2 Valence of Na and Cu in La7+2xSr1−4xKxNaxCu4O16−δ
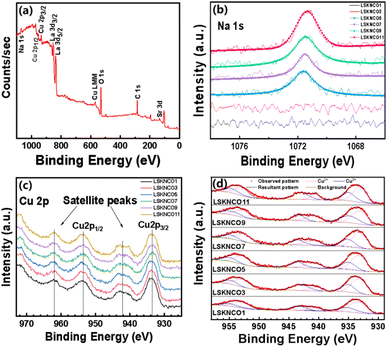
As widely recognized, copper in most copper oxides exists in the oxidation states of +1, or +2. However, the presence of Sr2+, Na+, and K+ in La7+2xSr1−4xKxNaxCu4O16−δ can induce the partial oxidation of Cu2+ to Cu3+. In order to accurately understand the changes in the oxidation state of copper in the samples, the X-ray photoelectron spectroscopy (XPS) data of the samples LSKNCO1, LSKNCO3, LSKNCO5, LSKNCO7, LSKNCO9, and LSKNCO11 was obtained. The full-scan XPS measurement spectrum of the LSKNCO9 sample is presented in Fig. 5a, which indicates the presence of La, Sr, K, Na, Cu, and O elements in the sample (with C being introduced by the XPS instrument itself). High-resolution element-specific fine scans of Na 1s, Cu 2p, and O 1s were recorded, which will be discussed in detail later.As shown in Fig. 5b, Na 1s XPS have no significant signals for the samples LSKNCO1 and LSKNCO3. This is probably due to the low doping concentration of Na+. As the Na content in the samples increases, prominent peaks are observed at an energy position of about 1071.58 eV in LSKNCO5, LSKNCO7, LSKNCO9, and LSKNCO11, corresponding to the Na 1s orbital. The Na+ state (binding energy ∼1071.0–1071.5 eV) can be confirmed based on the commonly used line position diagrams.29,30 Due to the limited sensitivity of the spectrometer to K elements, the signal intensity for K is not significant, and the spectra for K elements were not measured.
Fig. 5c shows the Cu 2p XPS spectra of all the studied components containing Cu 2p3/2 and Cu 2p1/2 as well as satellite peaks. The main peaks with binding energies at ∼933.14 eV and ∼952.62 eV correspond to Cu2+ at Cu 2p3/2 and Cu 2p1/2, respectively.31–33 However, the peaks at higher energies of the binding energy at ∼934.98 eV and ∼954.63 eV correspond to the Cu3+ of Cu 2p3/2 and Cu 2p1/2, respectively.31 Rocking satellite peaks at binding energies 940.79 eV and 943.31 eV were observed, which can be assigned to Cu2+ and Cu3+, respectively. The Cu2+![[thin space (1/6-em)]](https://www.rsc.org/images/entities/char_2009.gif) :
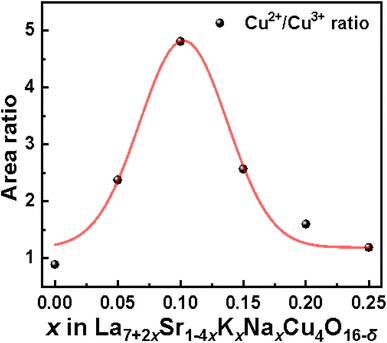
:![[thin space (1/6-em)]](https://www.rsc.org/images/entities/char_2009.gif) Cu3+ ratios in these samples were obtained by fitting the XPS spectra of Cu 2p, as shown in Fig. 5d, which are listed in Table 2 and presented in Fig. 6. The Cu2+
Cu3+ ratios in these samples were obtained by fitting the XPS spectra of Cu 2p, as shown in Fig. 5d, which are listed in Table 2 and presented in Fig. 6. The Cu2+![[thin space (1/6-em)]](https://www.rsc.org/images/entities/char_2009.gif) :
:![[thin space (1/6-em)]](https://www.rsc.org/images/entities/char_2009.gif) Cu3+ ratio of the substituted samples gradually increased in the doped samples to a maximum value of 4.882 at x = 0.10, followed by a gradual decrease, which indicates that the valence state of Cu firstly shifts from Cu3+ to Cu2+ and then moves back to Cu3+. R. A. M. Ram et al. mentioned for the (La, Ln)2−x(Ba, Sr)xCuO4−δ system that the substitution of La3+ with Sr2+ usually oxidizes Cu2+ to Cu3+.34 However, in the La7+2xSr1−4xKxNaxCu4O16−δ system, the oxidation tendency caused by the replacement of two Sr2+ by one Na+ and one K+ is cancelled by the co-replacement of two Sr2+ by two La3+. The change in the valence of Cu in the La7+2xSr1−4xKxNaxCu4O16−δ system may be due to other reasons.
Cu3+ ratio of the substituted samples gradually increased in the doped samples to a maximum value of 4.882 at x = 0.10, followed by a gradual decrease, which indicates that the valence state of Cu firstly shifts from Cu3+ to Cu2+ and then moves back to Cu3+. R. A. M. Ram et al. mentioned for the (La, Ln)2−x(Ba, Sr)xCuO4−δ system that the substitution of La3+ with Sr2+ usually oxidizes Cu2+ to Cu3+.34 However, in the La7+2xSr1−4xKxNaxCu4O16−δ system, the oxidation tendency caused by the replacement of two Sr2+ by one Na+ and one K+ is cancelled by the co-replacement of two Sr2+ by two La3+. The change in the valence of Cu in the La7+2xSr1−4xKxNaxCu4O16−δ system may be due to other reasons.
![[thin space (1/6-em)]](https://www.rsc.org/images/entities/char_2009.gif) :
:![[thin space (1/6-em)]](https://www.rsc.org/images/entities/char_2009.gif) Cu3+ ratio for La7+2xSr1−4xKxNaxCu4O16−δ
Cu3+ ratio for La7+2xSr1−4xKxNaxCu4O16−δ
| 2p3/2 | 2p1/2 | Cu2+![[thin space (1/6-em)]](https://www.rsc.org/images/entities/char_2009.gif) : :![[thin space (1/6-em)]](https://www.rsc.org/images/entities/char_2009.gif) Cu3+ Cu3+ |
|||
|---|---|---|---|---|---|
| Sample | Cu2+ | Cu3+ | Cu2+ | Cu3+ | |
| LSKNCO1 | 933.40 | 935.19 | 953.00 | 954.90 | 0.47![[thin space (1/6-em)]](https://www.rsc.org/images/entities/char_2009.gif) : :![[thin space (1/6-em)]](https://www.rsc.org/images/entities/char_2009.gif) 0.53 0.53 |
| LSKNCO3 | 933.20 | 935.04 | 952.79 | 954.76 | 0.70![[thin space (1/6-em)]](https://www.rsc.org/images/entities/char_2009.gif) : :![[thin space (1/6-em)]](https://www.rsc.org/images/entities/char_2009.gif) 0.30 0.30 |
| LSKNCO5 | 933.22 | 935.00 | 952.81 | 954.96 | 0.83![[thin space (1/6-em)]](https://www.rsc.org/images/entities/char_2009.gif) : :![[thin space (1/6-em)]](https://www.rsc.org/images/entities/char_2009.gif) 0.17 0.17 |
| LSKNCO7 | 933.14 | 935.10 | 952.62 | 954.76 | 0.72![[thin space (1/6-em)]](https://www.rsc.org/images/entities/char_2009.gif) : :![[thin space (1/6-em)]](https://www.rsc.org/images/entities/char_2009.gif) 0.28 0.28 |
| LSKNCO9 | 933.11 | 934.86 | 952.85 | 954.76 | 0.62![[thin space (1/6-em)]](https://www.rsc.org/images/entities/char_2009.gif) : :![[thin space (1/6-em)]](https://www.rsc.org/images/entities/char_2009.gif) 0.38 0.38 |
| LSKNCO11 | 933.10 | 934.98 | 952.98 | 954.63 | 0.54![[thin space (1/6-em)]](https://www.rsc.org/images/entities/char_2009.gif) : :![[thin space (1/6-em)]](https://www.rsc.org/images/entities/char_2009.gif) 0.46 0.46 |
3.3 Oxygen vacancy in La7+2xSr1−4xKxNaxCu4O16−δ
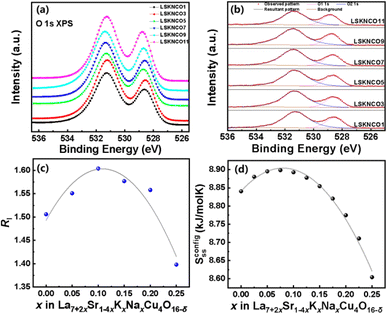
The O 1s XPS spectra for all the investigated compositions are shown in Fig. 7a with two peaks at binding energies of 528.7 eV and 531.4 eV, denoted as O1 and O2, respectively. In the study on Ga3+-doped BiMn1−xGaxO3-BaTiO3 ceramics, K. K. Rahangdale35 found that the two peaks at binding energies of 527.75 eV and 529.0–532.0 eV in the O 1s XPS spectra are related to the lattice oxygen without oxygen vacancies in the neighboring vicinity and vacancy-related oxygen with oxygen vacancies in the neighboring vicinity, respectively. Additionally, D. Kumar et al.36 in Ti4+-doped La0.6Ba0.4Mn1−xTixO3 perovskites found the binding energies of lattice oxygen and vacancy related oxygen to be approximately 529.0–530.2 eV and 531.3–531.7 eV, respectively. Therefore, the binding energies O1 and O2 in our study may correspond to lattice oxygen without oxygen vacancies in the neighboring vicinity and vacancy related oxygen with oxygen vacancies in the neighboring vicinity, respectively.Fig. 7b shows the fitted spectra of the two peaks of the selected samples. When x ≤ 0.10, the intensity of the O2 peak (I1sO2) increases with increasing doping concentration of K and Na. However, there is a decreasing trend in the intensity of the O2 peak when x > 0.10. The I1sO2![[thin space (1/6-em)]](https://www.rsc.org/images/entities/char_2009.gif) :
:![[thin space (1/6-em)]](https://www.rsc.org/images/entities/char_2009.gif) I1sO1 ratio denoted by RI for each sample is listed in Table 3 and shown in Fig. 7c. Compared to Fig. 6, the I1sO2
I1sO1 ratio denoted by RI for each sample is listed in Table 3 and shown in Fig. 7c. Compared to Fig. 6, the I1sO2![[thin space (1/6-em)]](https://www.rsc.org/images/entities/char_2009.gif) :
:![[thin space (1/6-em)]](https://www.rsc.org/images/entities/char_2009.gif) I1sO1 ratio can correspond well with the Cu2+
I1sO1 ratio can correspond well with the Cu2+![[thin space (1/6-em)]](https://www.rsc.org/images/entities/char_2009.gif) :
:![[thin space (1/6-em)]](https://www.rsc.org/images/entities/char_2009.gif) Cu3+ ratio, which means that the change in the valence of Cu in the La7+2xSr1−4xKxNaxCu4O16−δ system is related to the change in the content of oxygen vacancies in the samples. In fact, as La7+2xSr1−4xKxNaxCu4O16−δ is an equivalent doping system, it is natural that the Cu2+
Cu3+ ratio, which means that the change in the valence of Cu in the La7+2xSr1−4xKxNaxCu4O16−δ system is related to the change in the content of oxygen vacancies in the samples. In fact, as La7+2xSr1−4xKxNaxCu4O16−δ is an equivalent doping system, it is natural that the Cu2+![[thin space (1/6-em)]](https://www.rsc.org/images/entities/char_2009.gif) :
:![[thin space (1/6-em)]](https://www.rsc.org/images/entities/char_2009.gif) Cu3+ ratio is directly related to the change in the oxygen vacancies. Therefore, the origin for the change in the Cu2+
Cu3+ ratio is directly related to the change in the oxygen vacancies. Therefore, the origin for the change in the Cu2+![[thin space (1/6-em)]](https://www.rsc.org/images/entities/char_2009.gif) :
:![[thin space (1/6-em)]](https://www.rsc.org/images/entities/char_2009.gif) Cu3+ ratio may be the same as the origin of the change in the I1sO2
Cu3+ ratio may be the same as the origin of the change in the I1sO2![[thin space (1/6-em)]](https://www.rsc.org/images/entities/char_2009.gif) :
:![[thin space (1/6-em)]](https://www.rsc.org/images/entities/char_2009.gif) I1sO1 ratio.
I1sO1 ratio.
![[thin space (1/6-em)]](https://www.rsc.org/images/entities/char_2009.gif) :
:![[thin space (1/6-em)]](https://www.rsc.org/images/entities/char_2009.gif) I1sO1 (RI) for La7+2xSr1−4xKxNaxCu4O16−δ
I1sO1 (RI) for La7+2xSr1−4xKxNaxCu4O16−δ
| Sample | O1 1s | O2 1s | RI |
|---|---|---|---|
| LSKNCO1 | 528.56 | 531.24 | 1.506 |
| LSKNCO3 | 528.61 | 531.32 | 1.551 |
| LSKNCO5 | 528.65 | 531.29 | 1.604 |
| LSKNCO7 | 528.66 | 531.43 | 1.577 |
| LSKNCO9 | 528.74 | 531.47 | 1.558 |
| LSKNCO11 | 528.73 | 531.35 | 1.398 |
As shown in Fig. 3, the change in the lattice parameters of La7+2xSr1−4xKxNaxCu4O16−δ is monotonous, which could not induce a parabolic change in the oxygen vacancies shown in Fig. 7c or a parabolic change in the Cu2+![[thin space (1/6-em)]](https://www.rsc.org/images/entities/char_2009.gif) :
:![[thin space (1/6-em)]](https://www.rsc.org/images/entities/char_2009.gif) Cu3+ratio shown in Fig. 6 with the increase in the Na+ and K+ contents in the samples. Therefore, it is estimated that the change in the content of oxygen vacancies in La7+2xSr1−4xKxNaxCu4O16−δ may be related to the configurational entropy change in this system with different amounts of Na and K doping. The configurational entropy can be calculated by the following equation.37
Cu3+ratio shown in Fig. 6 with the increase in the Na+ and K+ contents in the samples. Therefore, it is estimated that the change in the content of oxygen vacancies in La7+2xSr1−4xKxNaxCu4O16−δ may be related to the configurational entropy change in this system with different amounts of Na and K doping. The configurational entropy can be calculated by the following equation.37
 | (2) |
![[thin space (1/6-em)]](https://www.rsc.org/images/entities/char_2009.gif) :
:![[thin space (1/6-em)]](https://www.rsc.org/images/entities/char_2009.gif) I1sO1 ratio shown in Fig. 7c and the change in the Cu2+
I1sO1 ratio shown in Fig. 7c and the change in the Cu2+![[thin space (1/6-em)]](https://www.rsc.org/images/entities/char_2009.gif) :
:![[thin space (1/6-em)]](https://www.rsc.org/images/entities/char_2009.gif) Cu3+ ratio shown in Fig. 6. The change in the content of oxygen vacancies in La7+2xSr1−4xKxNaxCu4O16−δ and the change in the Cu2+
Cu3+ ratio shown in Fig. 6. The change in the content of oxygen vacancies in La7+2xSr1−4xKxNaxCu4O16−δ and the change in the Cu2+![[thin space (1/6-em)]](https://www.rsc.org/images/entities/char_2009.gif) :
:![[thin space (1/6-em)]](https://www.rsc.org/images/entities/char_2009.gif) Cu3+ ratio may be due to the change in the configurational entropy caused by the Na and K doping.
Cu3+ ratio may be due to the change in the configurational entropy caused by the Na and K doping.
3.4 Superconducting properties of La7+2xSr1−4xKxNaxCu4O16−δ
Temperature-dependent resistivity measurements were conducted on all the samples from LSKNCO1 to LSKNCO11 in the temperature range from 2 to 120 K. The typical data for the samples LSKNCO1, LSKNCO5, LSKNCO8, and LSKNCO9 are shown in Fig. 8a–d (the others are presented in the ESI†).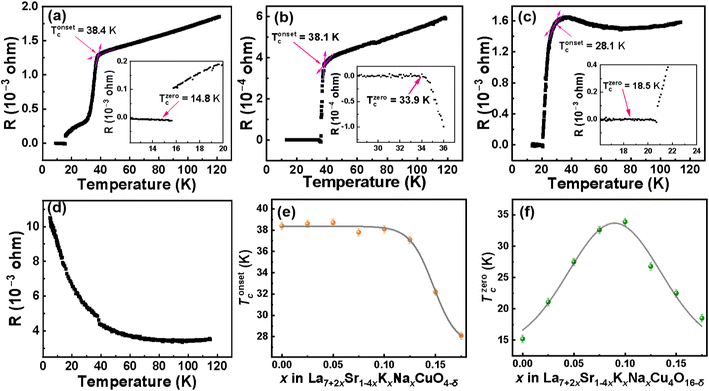 | ||
| Fig. 8 Temperature-dependent resistance of LSKNCO1 (a), LSKNCO5 (b), LSKNCO8 (c), LSKNCO9 (d), Tonsetc (0 ≤ x ≤ 0.175) (e) and Tzerocof the samples La7+2xSr1−4xKxNaxCu4O16−δ (0 ≤ x ≤ 0.175) (f). | ||
For the samples LSKNCO1 to LSKNCO6, the resistivity decreases with decreasing temperature to show a metallic behavior until the temperature reaches Tonsetc. After Tonsetc, the resistivity drops sharply with a decrease in temperature. Subsequently, as the temperature continues to decrease, the resistivity reaches “zero” at Tzeroc. Tonsetc is not changed significantly for these six samples, which is about 38 K, as shown in Fig. 8e. However, as shown in Fig. 8f, the Tzeroc of La7+2xSr1−4xKxNaxCu4O16−δ firstly increases and then decreases, which is a surprise at first glance. The main reason is that with an increase in the contents of Na and K in the sample, the average valence at the La site remains unchanged because the decrease tendency caused by the replacement of two Sr2+ with one Na+ and one K+ is cancelled by the replacement of two Sr2+ with two La3+. In this case, the valence of Cu should not change. Therefore, the Tzeroc of La7+2xSr1−4xKxNaxCu4O16−δ should remain constant at about 16.5 K, as reported by L. Weckhuysen,39 because most of us believe that the Tzeroc of doped La2CuO4−δ is strongly related to the valence of Cu, as indicated by P. G. Radaelli et al.6 However, the XPS data shown in Table 2 in section 3.2 indicates that the Cu2+![[thin space (1/6-em)]](https://www.rsc.org/images/entities/char_2009.gif) :
:![[thin space (1/6-em)]](https://www.rsc.org/images/entities/char_2009.gif) Cu3+ ratio in La7+2xSr1−4xKxNaxCu4O16−δ first increases and then decreases. This means that the amount of Cu3+ in La7+2xSr1−4xKxNaxCu4O16−δ first decreases with an increase in x when x < 0.100, then increases when 0.100 < x < 0.25. As mentioned by P. G. Radaelli et al.,6 La1.75Sr0.25CuO4−δ/4 (which is corresponding to La7+2xSr1−4xKxNaxCu4O16−δ with x = 0.000) is a hole over-doped superconductor. Therefore, the decrease in the holes (corresponding to the decrease in the Cu3+ content) in La7+2xSr1−4xKxNaxCu4O16−δ with an increase in x when x < 0.100 will help to move to the optimal doped state. Then, the Tzeroc of La7+2xSr1−4xKxNaxCu4O16−δ increases with an increase in x when x < 0.100. The Tzeroc of La7+2xSr1−4xKxNaxCu4O16−δ decreases from 33.9 K for x = 0.100 to 26.7 K for x = 0.125, which can be due to the increase in the holes to move the sample back to the over-doped state.
Cu3+ ratio in La7+2xSr1−4xKxNaxCu4O16−δ first increases and then decreases. This means that the amount of Cu3+ in La7+2xSr1−4xKxNaxCu4O16−δ first decreases with an increase in x when x < 0.100, then increases when 0.100 < x < 0.25. As mentioned by P. G. Radaelli et al.,6 La1.75Sr0.25CuO4−δ/4 (which is corresponding to La7+2xSr1−4xKxNaxCu4O16−δ with x = 0.000) is a hole over-doped superconductor. Therefore, the decrease in the holes (corresponding to the decrease in the Cu3+ content) in La7+2xSr1−4xKxNaxCu4O16−δ with an increase in x when x < 0.100 will help to move to the optimal doped state. Then, the Tzeroc of La7+2xSr1−4xKxNaxCu4O16−δ increases with an increase in x when x < 0.100. The Tzeroc of La7+2xSr1−4xKxNaxCu4O16−δ decreases from 33.9 K for x = 0.100 to 26.7 K for x = 0.125, which can be due to the increase in the holes to move the sample back to the over-doped state.
With more Na and K doped into the sample, the metallic resistivity above Tonsetc for LSKNCO1 to LSKNCO6 changes to semiconductive resistivity for LSKNCO7 and LSKNCO8. This may be because the doping level directly affects the carrier concentration and metallic nature of the material. For samples LSKNCO1 (x = 0) and LSKNCO5 (x = 0.1), the doping level is low and the carrier concentration is sufficiently high to form effective conduction channels, which enhances the metallic properties. As the temperature decreases, superconductivity emerges, leading to increased carrier mobility and reduced electron scattering, which results in a decrease in resistivity.14,40 In contrast, for LSKNCO7 (x = 0.15) and LSKNCO8 (x = 0.175) (Fig. S18† and 8(c)), the higher doping levels introduce increased disorder, leading to the presence of defects. This disorder enhances electron scattering, thereby hindering the decrease in resistivity, even though the materials exhibit superconductivity at low temperatures.41 Additionally, the increased disorder due to higher doping levels may localize some carriers, preventing them from effectively contributing to conductivity at higher temperatures.42 As the temperature decreases, these localized carriers contribute less to the metallic behavior, resulting in different resistivity characteristics compared to the lower-doped samples. Tonsetc decreases from 32.2 K for LSKNCO7 to 28.1 K for LSKNCO8, as shown in Fig. 8e, and Tzeroc continues to decrease from 22.5 K for LSKNCO7 to 18.5 K for LSKNCO8. The reason is similar to that for LSKNCO6, as mentioned above. It is noted that LSKNCO7 is tetragonal and LSKNCO8 is orthogonal, which means that the superconductivity can appear in both the tetragonal and orthogonal phases for the La7+2xSr1−4xKxNaxCu4O16−δ system.
With a further increase in the Na and K contents in the sample, “zero” resistivity is not be measured for the samples LSKNCO9 to LSKNCO11 with a semiconductive behavior for the temperature-dependent resistivity. The data for the temperature-dependent resistance of LSKNCO10 and LSKNCO11 is shown in Fig. S20–S21.†
In order to confirm the superconductivity of the La7+2xSr1−4xKxNaxCu4O16−δ system, the magnetization of the samples was measured under a magnetic field of 10 Oe in the temperature range of 2–300 K. Typical data are shown in Fig. 9 and the data for other samples are presented in ESI (Fig. S13–S21†). As the temperature decreases, the magnetization of the samples starts to decrease to negative values at Tmagc, which are 37.5 K and 28.0 K for LSKNCO5 and LSKNCO8, respectively. They both exhibit strong diamagnetic signals, confirming that superconductivity exists in these samples as “zero” resistivity is already observed above. Weak diamagnetic signals (about 2% to 0.1% of that for LSKNCO5 or LSKNCO8) are found in the magnetization of the samples for LSKNCO9 to LSKNCO11. Since the sample LSKNCO9 no longer exhibits “zero” resistivity, the temperature-dependent DC magnetization data (Fig. S19†) reveals that the zero-field-cooling (ZFC) and field-cooling (FC) curves do not show any splitting, which may be attributed to weak flux pinning in the material.43 This observation further suggests the absence of superconductivity properties in the sample. Additionally, the incomplete diamagnetic signals observed in the magnetic susceptibility measurements of LSKNCO10 and LSKNCO11 further corroborate the loss of superconductivity in these materials.
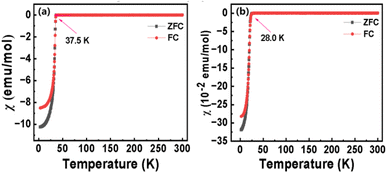 | ||
| Fig. 9 Temperature dependence of DC magnetic susceptibility of LSKNCO5 (a) and LSKNCO8 (b) in an applied field of 10 Oe after zero field cooling. | ||
As discussed in section 3.3, the change in the Cu2+![[thin space (1/6-em)]](https://www.rsc.org/images/entities/char_2009.gif) :
:![[thin space (1/6-em)]](https://www.rsc.org/images/entities/char_2009.gif) Cu3+ ratio is due to the change in the configurational entropy caused by the Na and K doping in the present equivalent doping La7+2xSr1−4xKxNaxCu4O16−δ system. Therefore, the Tzeroc of La7+2xSr1−4xKxNaxCu4O16−δ is increased to 33.9 K (for x = 0.10) from 14.8 K (for x = 0.00) and then lowered to 18.5 K (for x = 0.175), which is related to the change in the configurational entropy caused by Na and K doping.
Cu3+ ratio is due to the change in the configurational entropy caused by the Na and K doping in the present equivalent doping La7+2xSr1−4xKxNaxCu4O16−δ system. Therefore, the Tzeroc of La7+2xSr1−4xKxNaxCu4O16−δ is increased to 33.9 K (for x = 0.10) from 14.8 K (for x = 0.00) and then lowered to 18.5 K (for x = 0.175), which is related to the change in the configurational entropy caused by Na and K doping.
4. Conclusions
In summary, we demonstrated the synthesis of new series of solid solutions La7+2xSr1−4xKxNaxCu4O16−δ (0.00 ≤ x ≤ 0.25) by the traditional solid-state method, which crystalizes in the I4/mmm space group when 0.00 ≤ x < 0.16 and Fmmm when 0.16 < x ≤ 0.25.All the tetragonal phase La7+2xSr1−4xKxNaxCu4O16−δ (0.00 ≤ x < 0.16) are superconductors with Tzeroc increasing from 14.8 K for x = 0.00 to 33.9 K for x = 0.10 and then decreasing to 22.5 K for x = 0.15. The change in theTzeroc for the equivalent doping system La7+2xSr1−4xKxNaxCu4O16−δ is related to the change in the Cu2+![[thin space (1/6-em)]](https://www.rsc.org/images/entities/char_2009.gif) :
:![[thin space (1/6-em)]](https://www.rsc.org/images/entities/char_2009.gif) Cu3+ ratio in the samples confirmed by the XPS data, which may be caused by the change in the configurational entropy.
Cu3+ ratio in the samples confirmed by the XPS data, which may be caused by the change in the configurational entropy.
Tzeroc for the orthogonal phase La7+2xSr1−4xKxNaxCu4O16−δ with x = 0.175 is about 18.5 K. The other samples with x = 0.200, 0.225, and 0.250 do not show superconductivity in the present study.
Data availability
The data supporting this article have been included as part of the ESI.† All relevant data are available from the corresponding author upon reasonable request.Author contributions
Deyang Xu: methodology, data curation, writing—original draft preparation; Guohong Cai: conceptualization; Peiliang Huang: formal analysis; Xi Wu: formal analysis; Yan Wang: data curation; Jinling Geng: conceptualization; Jing Ju: methodology, data curation; Xiaoge Wang: investigation, formal analysis; Congling Yin: conceptualization, supervision, project administration, writing—review and editing; Guobao Li: conceptualization, formal analysis, supervision, writing—review and editing. All authors have read and agreed to the published version of the manuscript.Conflicts of interest
There are no conflicts to declare.Acknowledgements
This work is supported by the National Natural Science Foundation of China (Grant 22175003). The measurements of X-ray photoelectron spectroscopy (XPS) patterns were performed at the Analytical Instrumentation Center of Peking University.References
- J. G. Bednorz and K. A. Mller, Z. Phys. B, 1986, 64, 189–193 CrossRef CAS.
- Y. Maeno, A. Odagawa, N. Kakehi, T. Suzuki and T. Fujita, Physica C, 1991, 173, 322–330 CrossRef CAS.
- M. Onoda, S. Shamoto, M. Sato and S. Hosoya, Jpn. J. Appl. Phys., 1987, 26, L363–L365 CrossRef CAS.
- J. C. Grenier, A. Wattiaux, N. Lagueyte, J. C. Park, E. Marquestaut, J. Etourneau and M. Pouchard, Physica C, 1991, 173, 139–144 CrossRef CAS.
- B. Dabrowski, Z. Wang, J. D. Jorgensen, R. L. Hitterman, J. L. Wagner, B. A. Hunter and D. G. Hinks, Physica C, 1993, 217, 455–460 CrossRef CAS.
- P. G. Radaelli, D. G. Hinks, A. W. Mitchell, B. A. Hunter, J. L. Wagner, B. Dabrowski, K. G. Vandervoort, H. K. Viswanathan and J. D. Jorgensen, Phys. Rev. B, 1994, 49, 4163–4175 CrossRef CAS PubMed.
- J. B. Torrance, Y. Tokura, A. I. Nazzal, A. Bezinge, T. C. Huang and S. S. P. Parkin, Phys. Rev. Lett., 1988, 61, 1127–1130 CrossRef CAS PubMed.
- J. P. Attfield, A. L. Kharlanov and J. A. McAllister, Nature, 1998, 394, 157–159 CrossRef CAS.
- J. B. Torrance, A. Bezinge, A. I. Nazzal, T. C. Huang, S. S. P. Parkin, D. T. Keane, S. J. LaPlaca, P. M. Horn and G. A. Held, Phys. Rev. B, 1989, 40, 8872–8877 CrossRef CAS PubMed.
- J. M. Tarascon, L. H. Greene, W. R. McKinnon and G. W. Hull, Solid State Commun., 1987, 63, 499–505 CrossRef CAS.
- K. Oh-Ishi and Y. Syono, J. Solid State Chem., 1991, 95, 136–144 CrossRef CAS.
- B. Büchner, M. Braden, M. Cramm, W. Schlabitz, O. Hoffels, W. Braunisch, R. Müller, G. Heger and D. Wohlleben, Physica C, 1991, 185–189, 903–904 CrossRef.
- M. A. Subramanian, J. Gopalakrishnan, C. C. Torardi, T. R. Askew, R. B. Flippen, A. W. Sleight, J. J. Lin and S. J. Poon, Science, 1988, 240, 495–497 CrossRef CAS PubMed.
- Y. Liu, Y. Wang, Y. Cai, Z. Hao, X.-M. Ma, L. Wang, C. Liu, J. Chen, L. Zhou, J. Wang, S. Wang, H. He, Y. Liu, S. Cui, B. Huang, J. Wang, C. Chen and J.-W. Mei, Phys. Rev. Mater., 2023, 7, 064801 CrossRef CAS.
- Y. Zhao, W. Deng, X. Chen, H. Zhang, A. Chang and Y. Xie, J. Mater. Sci.: Mater. Electron., 2022, 33, 22448–22455 CrossRef CAS.
- D. Lv, R. Zuo and S. Su, J. Mater. Sci.: Mater. Electron., 2011, 23, 1367–1372 CrossRef.
- J. B. Goodenough, J. S. Zhou and K. Allan, J. Mater. Chem., 1991, 1, 715–724 RSC.
- A. F. Dong, H. X. Geng, G. C. Che, W. W. Huang, S. L. Jia and Z. X. Zhao, Supercond. Sci. Technol., 2006, 19, 206–211 CrossRef CAS.
- R. Li, X. Wu, Z. Chen, Y. Qian, C. Zhu, H. Wei, S. Wang, J. Sha and J. Xia, Phys. Lett. A, 1990, 144, 35–38 CrossRef CAS.
- A. Malinowski, M. Z. Cieplak, M. Berkowski, W. Plesiewicz and T. Skośkiewicz, Acta Phys. Pol., A, 2006, 109, 617–621 CrossRef CAS.
- C. Zhang and Y. Zhang, J. Phys.: Condens.Matter, 2002, 14, 9659–9665 CrossRef CAS.
- C. J. Zhang and H. Oyanagi, Physica C, 2008, 468, 1155–1158 CrossRef CAS.
- A. Coelho, Coelho Software, 2012 Search PubMed.
- C. Wang and T. Hughbanks, Inorg. Chem., 2002, 34, 5524–5529 CrossRef.
- A. Kimura, M. Kawate, H. Hasegawa and T. Suzuki, Surf. Coat. Technol., 2003, 169–170, 367–370 CrossRef CAS.
- J. M. Tarascon, L. H. Greene, W. R. McKinnon, G. W. Hull and T. H. Geballe, Science, 1987, 235, 1373–1376 CrossRef CAS PubMed.
- H. Wang, C.-H. Wang, G. Li, T. Jin, F. Liao and J. Lin, Inorg. Chem., 2010, 49, 5262–5270 CrossRef CAS PubMed.
- H. Wang, C. Yang, J. Lu, M. Wu, J. Su, K. Li, J. Zhang, G. Li, T. Jin, T. Kamiyama, F. Liao, J. Lin and Y. Wu, Inorg. Chem., 2013, 52, 2388–2392 CrossRef CAS PubMed.
- Y. Foucaud, M. Badawi, L. O. Filippov, O. Barres, I. V. Filippova and S. Lebegue, Chem. Sci., 2019, 10, 9928–9940 RSC.
- Y. Lu, Y. Cai, Q. Zhang, L. Liu, Z. Niu and J. Chen, Chem. Sci., 2019, 10, 4306–4312 RSC.
- S. Yadav, D. Kumar and A. K. Singh, Mater. Today Commun., 2024, 38, 107767 CrossRef CAS.
- C. S. Gopinath, J. Chem. Soc., Faraday Trans., 1996, 92, 3605–3610 RSC.
- U. M. Meshiya, P. Y. Raval, P. R. Pansara, M. Nehra, N. Jakhar, S. Kumar, K. B. Modi, D.-K. Lim and R. K. Singhal, Ceram. Int., 2020, 46, 2147–2154 CrossRef CAS.
- R. A. M. Ram, P. Ganguly and C. N. R. Rao, Phase Transitions, 2006, 10, 107–121 CrossRef.
- K. K. Rahangdale and S. Ganguly, Phys. B, 2022, 626, 413570 CrossRef CAS.
- D. Kumar and A. K. Singh, J. Phys. Chem. Solids, 2023, 176, 111253 CrossRef CAS.
- O. F. Dippo and K. S. Vecchio, Scr. Mater., 2021, 201, 113974 CrossRef CAS.
- M. Brahlek, M. Gazda, V. Keppens, A. R. Mazza, S. J. McCormack, A. Mielewczyk-Gryń, B. Musico, K. Page, C. M. Rost, S. B. Sinnott, C. Toher, T. Z. Ward and A. Yamamoto, APL Mater., 2022, 10, 110902 CrossRef CAS.
- L. Weckhuysen, J. Vanacken, P. Wagner and V. V. Moshchalkov, Eur. Phys. J. B, 2002, 29, 369–375 CrossRef CAS.
- C. Collignon, B. Fauqué, A. Cavanna, U. Gennser, D. Mailly and K. Behnia, Phys. Rev. B, 2017, 96, 224506 CrossRef.
- M. Qin, R. Zhang, C. Miao, Z. Wei, Y. Shi, Y. Yao, H. Wang, Y. Li, K. Jin and X. Xiang, Phys. Rev. Res., 2024, 6, 023194 CrossRef CAS.
- Z.-X. Li, S. A. Kivelson and D.-H. Lee, npj Quantum Mater., 2021, 6, 36 CrossRef CAS.
- H. Chauhan and G. D. Varma, J. Appl. Phys., 2024, 135, 013901 CrossRef CAS.
Footnote |
| † Electronic supplementary information (ESI) available. See DOI: https://doi.org/10.1039/d4ra06045h |
| This journal is © The Royal Society of Chemistry 2024 |

