 Open Access Article
A rhodamine-based fluorescent probe bearing 8-hydroxyquinoline group for the highly selective detection of Hg2+ and its practical application in cell imaging†
Lei Zhanga,
Jun Guob and
Qihua You *c
*c
aDepartment of Biology, Xinzhou Normal University, Xinzhou, Shanxi Province 034000, P. R. China
bShanxi Weipu Testing Technology Co. Ltd, Taiyuan, Shanxi Province 030012, P. R. China
cDepartment of Chemical and Biological Engineering, Hong Kong University of Science and Technology, Clear Water Bay Road, Saikung, Hong Kong SAR, Hong Kong. E-mail: qihuayou@ust.hk
First published on 8th October 2024
Abstract
A highly selective and sensitive fluorescent probe, RHOQ, was designed for the detection of Hg2+ by incorporating an 8-hydroxyquinoline moiety onto a rhodamine molecular platform with a suitable linker. In MeOH–Tris (20 mM, pH = 7.4, 1![[thin space (1/6-em)]](https://www.rsc.org/images/entities/char_2009.gif) :
:![[thin space (1/6-em)]](https://www.rsc.org/images/entities/char_2009.gif) 9, v/v) buffer solution, RHOQ exhibited 550-fold fluorescence enhancement at 594 nm upon addition of Hg2+, with a fast response and a low detection limit (9.67 × 10⁻⁸ M). The 1
9, v/v) buffer solution, RHOQ exhibited 550-fold fluorescence enhancement at 594 nm upon addition of Hg2+, with a fast response and a low detection limit (9.67 × 10⁻⁸ M). The 1![[thin space (1/6-em)]](https://www.rsc.org/images/entities/char_2009.gif) :
:![[thin space (1/6-em)]](https://www.rsc.org/images/entities/char_2009.gif) 1 binding mode of RHOQ with Hg2+ was established using Job's plot, UV-Vis, and fluorescence spectroscopic titration methods. Furthermore, RHOQ was successfully applied for the detection of Hg2+ in living cells with good membrane permeability.
1 binding mode of RHOQ with Hg2+ was established using Job's plot, UV-Vis, and fluorescence spectroscopic titration methods. Furthermore, RHOQ was successfully applied for the detection of Hg2+ in living cells with good membrane permeability.
1 Introduction
The mercury ion is a highly toxic heavy metal that poses severe health risks to humans and wildlife. It is a global environmental pollutant that can enter the food chain through various sources, including industrial activities, mining, and natural processes. Mercury ions can accumulate in the body and cause various health issues, such as neurological disorders, kidney damage, and cardiovascular diseases. When inorganic Hg2+ entered living organisms, it would transform to lipophilic and higher toxic methylmercury (CH3Hg+) and ethylmercury (CH3CH2Hg+).1 Therefore, detecting and monitoring mercury ions in the environment and food chain is crucial to prevent their harmful effects on human health and the ecosystem.However, traditional detection methods for mercury ions, such as atomic absorption spectroscopy (AAS), atomic emission spectrometry (AES), electrochemistry, and inductively coupled plasma-atomic emission spectroscopy (ICP-OES), require sophisticated and time-consuming pretreatment and equipment, making real-time onsite detection challenging.2–7 To overcome these limitations, fluorescent probes have emerged as a simple and cost-effective detection method with high sensitivity and selectivity, real-time monitoring capabilities, and easy procedures.8 Fluorescent probes have found applications in various fields, including environmental monitoring, food safety, live cell imaging, and medical diagnosis.9
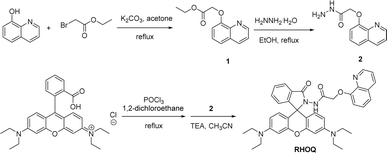
To date, many fluorescent probes based on various fluorophores have been developed for the detection of mercury ions in vitro and in vivo.10–15 Among of them, rhodamine-based fluorophore has been widely used due to its commercial available, good photostability, relatively long absorption and emission wavelengths and simple structural derivatization.16–30 Rhodamine derivatives exhibit very weak fluorescence in the spirocyclic form and strong fluorescence in the ring-opening form, triggered by specific analyte chelation. Hence, a new fluorescent probe, RHOQ, was developed for highly selective Hg2+ detection based on the ring close/opening transformation of the rhodamine platform (Scheme 1). Compared with recently reported fluorescent probe for Hg2+ (Table S1†), probe RHOQ demonstrated faster response, lower detection limit and higher fluorescence enhancement ratio. Furthermore, RHOQ can successfully monitor Hg2+ in living HeLa cells with low cytotoxicity.
2 Experimental
2.1 Reagents and instrumentation
High-purity solvents and chemicals were purchased from Sigma-Aldrich Inc. with analytical grade. Metal ions including Ag+, Li+, Ca2+, Co2+, Cu2+, Fe2+, Hg2+, Ni2+, Pb2+, Zn2+, and Fe3+ were purchased as perchlorates, K+, Na+, and Mg2+ were purchased as chlorides.Bruker Avance-III 400 MHz spectrometer was used to collect 1H-NMR and 13C-NMR spectra with TMS internal reference at 400 and 100 MHz, respectively. Bruker Autoflex mass spectrometer (MALDI-TOF) was used to record high-resolution mass spectrum (HRMS). PerkinElmer LS50B (Waltham, MA, USA) and Cary UV-300 spectrometer were used to collect fluorescence spectra and UV-Vis spectra, respectively. Orion 420A pH/mV/temperature benchtop meter was used for pH measurements.
2.2 Synthesis of probe RHOQ
![[thin space (1/6-em)]](https://www.rsc.org/images/entities/char_2009.gif) :
:![[thin space (1/6-em)]](https://www.rsc.org/images/entities/char_2009.gif) EA = 1
EA = 1![[thin space (1/6-em)]](https://www.rsc.org/images/entities/char_2009.gif) :
:![[thin space (1/6-em)]](https://www.rsc.org/images/entities/char_2009.gif) 1) to give compound 1 (2.42 g, 95%) as a yellow oil. 1H-NMR (400 MHz, CDCl3) δ (ppm): 8.96 (1H, dd, J = 4.1 Hz, J = 1.7 Hz), 8.15 (1H, dd, J = 8.3 Hz, J = 1.7 Hz), 7.47–7.41 (3H, m), 6.97 (1H, dd, J = 6.7 Hz, J = 2.2 Hz), 4.98 (2H, s), 4.28 (2H, q, J = 7.3 Hz), 1.27 (3H, t, J = 7.3 Hz). 13C-NMR (100 MHz, CDCl3) δ (ppm): 168.83, 153.68, 149.57, 140.18, 135.93, 129.57, 126.36, 121.82, 120.90, 109.39, 66.19, 61.42, 14.18.
1) to give compound 1 (2.42 g, 95%) as a yellow oil. 1H-NMR (400 MHz, CDCl3) δ (ppm): 8.96 (1H, dd, J = 4.1 Hz, J = 1.7 Hz), 8.15 (1H, dd, J = 8.3 Hz, J = 1.7 Hz), 7.47–7.41 (3H, m), 6.97 (1H, dd, J = 6.7 Hz, J = 2.2 Hz), 4.98 (2H, s), 4.28 (2H, q, J = 7.3 Hz), 1.27 (3H, t, J = 7.3 Hz). 13C-NMR (100 MHz, CDCl3) δ (ppm): 168.83, 153.68, 149.57, 140.18, 135.93, 129.57, 126.36, 121.82, 120.90, 109.39, 66.19, 61.42, 14.18.![[thin space (1/6-em)]](https://www.rsc.org/images/entities/char_2009.gif) :
:![[thin space (1/6-em)]](https://www.rsc.org/images/entities/char_2009.gif) EA = 1
EA = 1![[thin space (1/6-em)]](https://www.rsc.org/images/entities/char_2009.gif) :
:![[thin space (1/6-em)]](https://www.rsc.org/images/entities/char_2009.gif) 5) to give compound RHOQ (420 mg, 65%) as a white solid. 1H-NMR (400 MHz, CD3CN) δ (ppm): 10.78 (1H, br. s), 8.23–8.14 (m, 2H), 7.87–7.85 (m, 1H), 7.61–7.48 (m, 4H), 7.28–7.20 (m, 2H), 7.04–7.02 (m, 1H), 6.59–6.58 (m, 2H), 6.32–6.24 (m, 4H), 4.65 (s, 2H), 3.33 (q, J = 6.9 Hz, 8H), 1.11 (t, J = 7.0 Hz, 12H).13C-NMR (100 MHz, CD3CN) δ (ppm): 167.00, 163.52, 154.22, 153.34, 151.77, 148.60, 135.80, 132.85, 129.28, 128.95, 128.13, 126.55, 123.45, 122.40, 121.40, 107.37, 104.12, 96.78, 65.28, 43.62, 11.56. HRMS (ESI): m/z [M + H+] calcd for C39H40N5O4+: 641.3002; found: 642.3053; m/z [M + Na+] calcd for C39H39N5O4Na+: 664.2894; found: 664.1235; m/z [M + K+] calcd for C39H39N5O4K+: 680.2634; found: 679.9705.
5) to give compound RHOQ (420 mg, 65%) as a white solid. 1H-NMR (400 MHz, CD3CN) δ (ppm): 10.78 (1H, br. s), 8.23–8.14 (m, 2H), 7.87–7.85 (m, 1H), 7.61–7.48 (m, 4H), 7.28–7.20 (m, 2H), 7.04–7.02 (m, 1H), 6.59–6.58 (m, 2H), 6.32–6.24 (m, 4H), 4.65 (s, 2H), 3.33 (q, J = 6.9 Hz, 8H), 1.11 (t, J = 7.0 Hz, 12H).13C-NMR (100 MHz, CD3CN) δ (ppm): 167.00, 163.52, 154.22, 153.34, 151.77, 148.60, 135.80, 132.85, 129.28, 128.95, 128.13, 126.55, 123.45, 122.40, 121.40, 107.37, 104.12, 96.78, 65.28, 43.62, 11.56. HRMS (ESI): m/z [M + H+] calcd for C39H40N5O4+: 641.3002; found: 642.3053; m/z [M + Na+] calcd for C39H39N5O4Na+: 664.2894; found: 664.1235; m/z [M + K+] calcd for C39H39N5O4K+: 680.2634; found: 679.9705.2.3 Spectroscopic measurements
Various cation solutions including LiCl, NaCl, KCl, CaCl2, MgCl2 (100 mM), and AgClO4·H2O, Cd(ClO4)2·6H2O, Co(ClO4)2·6H2O, Cu(ClO4)2·6H2O, Fe(ClO4)2, Fe(ClO4)3, Hg(ClO4)2·3H2O, Ni(ClO4)2·6H2O, Pb(ClO4)2·3H2O, Zn(ClO4)2·6H2O (10 mM) were prepared in double-distilled water. Probe RHOQ was dissolved in MeOH to prepare 1.0 mM stock solution. All the absorption and fluorescence spectra measurements were conducted in MeOH–H2O solution (1![[thin space (1/6-em)]](https://www.rsc.org/images/entities/char_2009.gif) :
:![[thin space (1/6-em)]](https://www.rsc.org/images/entities/char_2009.gif) 9, v/v, 40 mM HEPES, pH 7.4). In the fluorescence experiments, the excitation wavelength was set at 543 nm, and the excitation/emission slit widths were set at 5/5 nm, respectively.
9, v/v, 40 mM HEPES, pH 7.4). In the fluorescence experiments, the excitation wavelength was set at 543 nm, and the excitation/emission slit widths were set at 5/5 nm, respectively.
2.4 Cytotoxicity assay
The cellular toxicity of probe RHOQ was tested by MTT assay. HeLa cells were seeded into 96 well plates at a density of 4000 cells per well at 37 °C with 5% CO2 for 24 h, and then incubated with 0.1% DMSO and different concentration of probe solution (5, 10, 20, 30 μM), respectively. Subsequently, 20 μL of MTT solution was added to each well followed by incubation for an additional 4 h. The absorbance of each well was measured at 490 nm.2.5 Cell culture and imaging
Probe RHOQ (1.0 mM) was prepared in DMSO solution. HeLa cells were cultured in Minimum Essential Medium (MEM) with 10% fetal bovine serum (FBS) and 1% antibiotics at 37 °C in an atmosphere of 5% CO2 and 95% humidity. The HeLa cells were plated on coverslips and washed 3 times with phosphate buffered saline (PBS) followed by incubating with the probe solution (10 μM) in DMSO for 30 min at 37 °C, and then washed with PBS three times. After incubating with Hg(ClO4)2 solution (10 μM) in PBS for 30 min at 37 °C, the cells were washed with PBS three times again.3 Results and discussion
3.1 The synthesis of RHOQ
The synthetic route of probe RHOQ was outlined in Scheme 1. Intermediate 1 was obtained by reacting 8-hydroxyquinoline with ethyl bromoacetate with a high yield. Subsequently, the reaction of 1 with hydrazine under reflux conditions gave compound 2 with an easy work-up operation. Finally, the condensation of rhodamine B with compound 2 in CH3CN yielded the target probe RHOQ. All chemical structures were confirmed by 1H and 13C NMR spectroscopy, as well as high resolution mass spectroscopy (detailed in the Experimental section and ESI†).3.2 Selectivity of RHOQ
After the synthesis of the probe, the selectivity of RHOQ (10 μM) towards various metal ions, including Na+, K+, Li+, Mg2+, Ca2+, Mg2+, Ag+, Cu2+, Co2+, Ni2+, Cd2+, Zn2+, Hg2+, Fe2+ and Fe3+, was investigated in a MeOH–Tris buffer (20 mM, pH = 7.4, 1![[thin space (1/6-em)]](https://www.rsc.org/images/entities/char_2009.gif) :
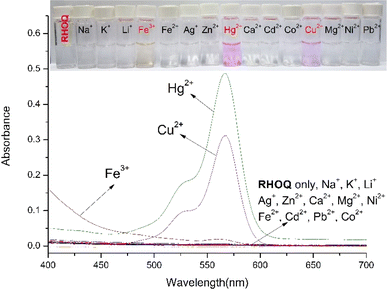
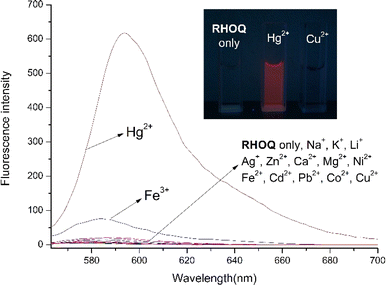
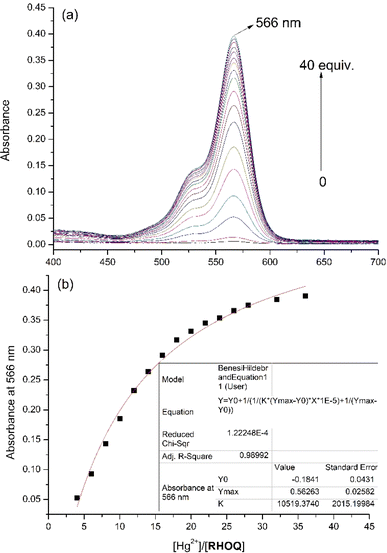
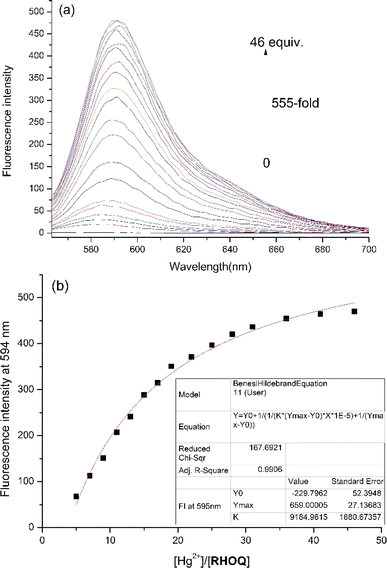
:![[thin space (1/6-em)]](https://www.rsc.org/images/entities/char_2009.gif) 9, v/v) solution using UV-Vis and fluorescence spectroscopy. The absorption spectrum of RHOQ exhibited negligible absorbance in the range from 400 to 700 nm because RHOQ mainly exists in spirolactam form. Upon the addition of Hg2+, a strong absorption peak at 566 nm with a characteristic broad shoulder band centered at about 521 nm appeared (Fig. 1), suggesting the conversion of the spirolactam form to the ring-opening amide form of RHOQ. As shown in the inset of Fig. 1, the addition of Hg2+ to the solution of RHOQ induced a prominent colour changed from colourless to magenta. In addition, similar phenomenon was also observed upon the addition of Cu2+, while other metal ions did not trigger any changes. In the fluorescence experiments, the addition of Hg2+ induced a significant fluorescence enhancement (550-fold) at 594 nm, while Fe3+ caused a relatively small fluorescence change (15-fold) with a small hypsochromic shift (fluorescence maximum at 584 nm), and other metal ions induced negligible changes (Fig. 2). Consistent with the results of fluorescent experiments, only the addition of Hg2+ to the solution of RHOQ can emit distinct red fluorescence under the irradiation of UV lamp (inset of Fig. 2).
9, v/v) solution using UV-Vis and fluorescence spectroscopy. The absorption spectrum of RHOQ exhibited negligible absorbance in the range from 400 to 700 nm because RHOQ mainly exists in spirolactam form. Upon the addition of Hg2+, a strong absorption peak at 566 nm with a characteristic broad shoulder band centered at about 521 nm appeared (Fig. 1), suggesting the conversion of the spirolactam form to the ring-opening amide form of RHOQ. As shown in the inset of Fig. 1, the addition of Hg2+ to the solution of RHOQ induced a prominent colour changed from colourless to magenta. In addition, similar phenomenon was also observed upon the addition of Cu2+, while other metal ions did not trigger any changes. In the fluorescence experiments, the addition of Hg2+ induced a significant fluorescence enhancement (550-fold) at 594 nm, while Fe3+ caused a relatively small fluorescence change (15-fold) with a small hypsochromic shift (fluorescence maximum at 584 nm), and other metal ions induced negligible changes (Fig. 2). Consistent with the results of fluorescent experiments, only the addition of Hg2+ to the solution of RHOQ can emit distinct red fluorescence under the irradiation of UV lamp (inset of Fig. 2).
3.3 Interference effect of RHOQ
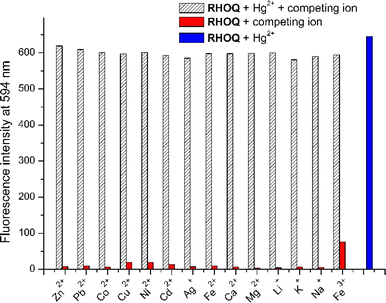
After investigating the selectivity of RHOQ for various cations, the potential interference effect of other cations on the selectivity of RHOQ for Hg2+ detection was examined. As shown in Fig. 3, the presence of high concentrations of various cations (40 equiv.) did not interfere with Hg2+ detection of RHOQ. Especially, the presence of Cu2+, known as a paramagnetic fluorescence quencher, did not affect the detection of Hg2+ by the RHOQ. Similarly, absorbance measurements also showed no significant changes in the presence of various competing ions (Fig. S8†). These results confirmed that RHOQ has a highly potential application in the detection of Hg2+ in living organisms. The selectivity and interference effect of RHOQ for Hg2+ detection was confirmed, indicating its potential application in detecting Hg2+ in living organisms.3.4 Titration experiments of RHOQ
Additionally, UV/Vis and fluorescence titration of RHOQ in MeOH–Tris buffer (20 mM, pH = 7.4, 1![[thin space (1/6-em)]](https://www.rsc.org/images/entities/char_2009.gif) :
:![[thin space (1/6-em)]](https://www.rsc.org/images/entities/char_2009.gif) 9, v/v) upon the addition of Hg2+ were conducted. After the addition of Hg2+ (40 equiv.), the binding of RHOQ with Hg2+ reached equilibrium, as evidenced by both absorbance and fluorescence measurement. Nonlinear fitting of the titration curves using the Benesi–Hildebrand equation (eqn (1))31,32 assuming a 1
9, v/v) upon the addition of Hg2+ were conducted. After the addition of Hg2+ (40 equiv.), the binding of RHOQ with Hg2+ reached equilibrium, as evidenced by both absorbance and fluorescence measurement. Nonlinear fitting of the titration curves using the Benesi–Hildebrand equation (eqn (1))31,32 assuming a 1![[thin space (1/6-em)]](https://www.rsc.org/images/entities/char_2009.gif) :
:![[thin space (1/6-em)]](https://www.rsc.org/images/entities/char_2009.gif) 1 stoichiometry for the RHOQ–Hg2+ complex yielded association constant Kass of about 1.05 × 10⁵ L mol−1 (R2 = 0.990) and 9.18 × 10³ L mol−1 (R2 = 0.990) from UV/Vis (Fig. 4) and fluorescence (Fig. 5) titration, respectively.
1 stoichiometry for the RHOQ–Hg2+ complex yielded association constant Kass of about 1.05 × 10⁵ L mol−1 (R2 = 0.990) and 9.18 × 10³ L mol−1 (R2 = 0.990) from UV/Vis (Fig. 4) and fluorescence (Fig. 5) titration, respectively.
 | (1) |
3.5 pH effect of RHOQ
The pH-dependent emission measurements revealed that RHOQ exhibited high stability and non-fluorescence in the pH range from 4.0–10.0 (Fig. 6). A slight fluorescence enhancement of RHOQ below pH 4.0 may be attributed to the well-known spirolactam ring opening in strong acidic condition. On the other hand, the addition of Hg2+ to the solution of RHOQ induced a significant fluorescence enhancement in acidic or weak alkaline conditions (pH < 8.0), while a dramatic decrease in fluorescence intensity was observed at pH higher than 8.2. This result may be ascribed to the formation of insoluble Hg(OH)2 in alkaline conditions, leading to the conversion of the ring-opening RHOQ–Hg2+ complex back to the original spirolactam compound. These findings support the suitability of RHOQ for the detection of Hg2+ in living cells.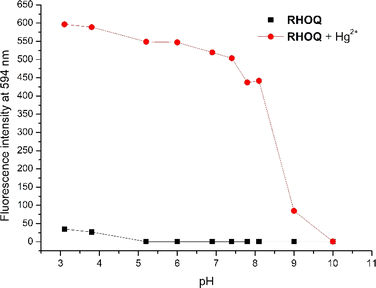 | ||
Fig. 6 Plot of fluorescence intensity at 594 nm of RHOQ (10 μM) in MeOH–Tris buffer (20 mM, 1![[thin space (1/6-em)]](https://www.rsc.org/images/entities/char_2009.gif) : :![[thin space (1/6-em)]](https://www.rsc.org/images/entities/char_2009.gif) 9, v/v) in the presence (red dot) and absence (black square) of Hg2+ (40 equiv.) as a function of pH. 9, v/v) in the presence (red dot) and absence (black square) of Hg2+ (40 equiv.) as a function of pH. | ||
3.6 Reversibility and time-dependent response of RHOQ
The reversibility of probe for metal ion detection is a crucial characteristic for practical applications. To test the reversibility of RHOQ, an aqueous solution of Na2EDTA (disodium ethylenediaminetetraacetate) was introduced to the solution of RHOQ (10 μM) and Hg2+ (Fig. 7). The fluorescence intensity of RHOQ–Hg2+ complex decreased significantly and approached the original intensity of RHOQ. These outcomes can also be attributed to the spirolactam ring opening/closing interconversion, which aligns with the findings obtained from the pH-dependent experiments.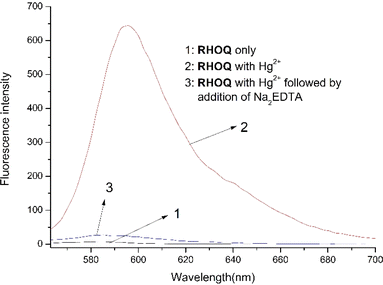 | ||
Fig. 7 Fluorescence spectra of RHOQ (10 μM) upon addition of Hg2+ (40 equiv.) followed by the addition of Na2EDTA in MeOH–Tris buffer (20 mM, pH = 7.4, 1![[thin space (1/6-em)]](https://www.rsc.org/images/entities/char_2009.gif) : :![[thin space (1/6-em)]](https://www.rsc.org/images/entities/char_2009.gif) 9, v/v). 9, v/v). | ||
We also investigated the time-dependent responses of RHOQ to Hg2+ (Fig. 8). Upon the addition of Hg2+, the solution of RHOQ showed an instantaneous color change to red, with stable maximum fluorescence intensity for at least 30 minutes, demonstrating the suitability of RHOQ for real-time Hg2+ detection.
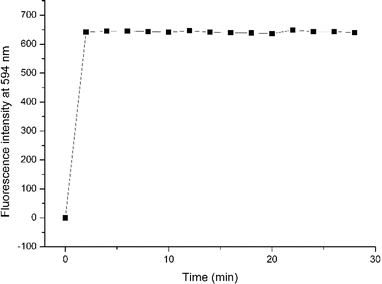 | ||
Fig. 8 Time-dependent fluorescence intensity at 594 nm of RHOQ (10 μM) in MeOH–Tris buffer (20 mM, pH = 7.4, 1![[thin space (1/6-em)]](https://www.rsc.org/images/entities/char_2009.gif) : :![[thin space (1/6-em)]](https://www.rsc.org/images/entities/char_2009.gif) 9, v/v) upon the addition of Hg2+ (40 equiv.). 9, v/v) upon the addition of Hg2+ (40 equiv.). | ||
3.7 Binding mode of RHOQ and Hg2+
To elucidate the possible binding mode between RHOQ and Hg2+, Job's plot experiments were conducted using fluorescent method. The result clearly indicated that the maximum fluorescence intensity was located at a mole fraction around 0.5 for Hg2+ (Fig. 9), confirming a 1![[thin space (1/6-em)]](https://www.rsc.org/images/entities/char_2009.gif) :
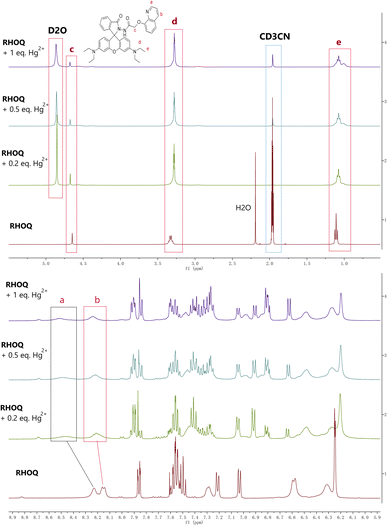
:![[thin space (1/6-em)]](https://www.rsc.org/images/entities/char_2009.gif) 1 binding stoichiometry between RHOQ and Hg2+. This result is consistent with the non-linear fitting of titration curve using the Benesi–Hildebrand equation. In order to investigate the binding mode of RHOQ and Hg2+, 1H NMR titration experiments were conducted. Upon addition of solution of Hg(ClO4)2 in D2O to the solution of RHOQ in CD3CN, the proton peaks corresponding to Ha, Hb and Hc shifted to lower field (Fig. 10). This observation implied that Hg2+ coordinated with N atom on quinoline group and O atom on carbonyl group (–COCH2O–). According to these results, we proposed a possible fluorescence OFF–ON mechanism of RHOQ upon addition of Hg2+, Fe3+ and Cu2+, respectively (Scheme 2). As we know, rhodamine B or its derivatives generally exist in five-membered spirolactam form with non-fluorescent behaviour. While in the presence of specific metal cations, the coordination of metal cation with oxygen atom on the spirolactam moiety of rhodamine B derivatives triggers the opening of spirolactam form to give a strong red fluorescence. To the probe RHOQ, the introduction of another amide group and 8-hydroxyquinoline moiety provides specific coordination sites for Hg2+, thus the selectivity of probe RHOQ to Hg2+ was enhanced.
1 binding stoichiometry between RHOQ and Hg2+. This result is consistent with the non-linear fitting of titration curve using the Benesi–Hildebrand equation. In order to investigate the binding mode of RHOQ and Hg2+, 1H NMR titration experiments were conducted. Upon addition of solution of Hg(ClO4)2 in D2O to the solution of RHOQ in CD3CN, the proton peaks corresponding to Ha, Hb and Hc shifted to lower field (Fig. 10). This observation implied that Hg2+ coordinated with N atom on quinoline group and O atom on carbonyl group (–COCH2O–). According to these results, we proposed a possible fluorescence OFF–ON mechanism of RHOQ upon addition of Hg2+, Fe3+ and Cu2+, respectively (Scheme 2). As we know, rhodamine B or its derivatives generally exist in five-membered spirolactam form with non-fluorescent behaviour. While in the presence of specific metal cations, the coordination of metal cation with oxygen atom on the spirolactam moiety of rhodamine B derivatives triggers the opening of spirolactam form to give a strong red fluorescence. To the probe RHOQ, the introduction of another amide group and 8-hydroxyquinoline moiety provides specific coordination sites for Hg2+, thus the selectivity of probe RHOQ to Hg2+ was enhanced.
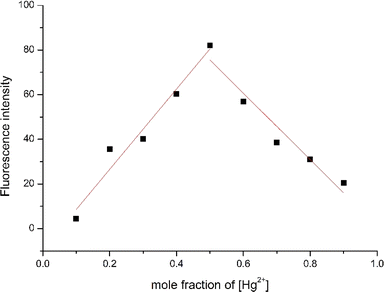 | ||
Fig. 9 Job's plot by fluorescence method of the complex between RHOQ and Hg2+ in MeOH–Tris buffer (20 mM, pH = 7.4, 1![[thin space (1/6-em)]](https://www.rsc.org/images/entities/char_2009.gif) : :![[thin space (1/6-em)]](https://www.rsc.org/images/entities/char_2009.gif) 9, v/v). Total concentration of RHOQ and Hg2+ is 50 μM. 9, v/v). Total concentration of RHOQ and Hg2+ is 50 μM. | ||
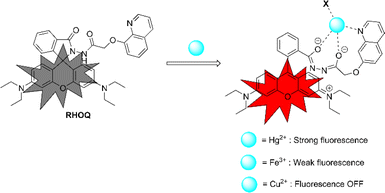 | ||
| Scheme 2 Proposed binding mechanism of RHOQ upon addition of Hg2+, Fe3+ and Cu2+, respectively. (X = coordinating anion or solvent). | ||
Additionally, when Cu2+ was added to RHOQ solution, we observed an absorption spectrum similar to that of Hg2+, but no fluorescence was produced (Fig. 1 and 2). This phenomenon can be attributed to the relatively high binding affinity of Cu2+ for RHOQ and its well-known paramagnetic nature.36,37 Fortunately, the high concentration of Cu2+ did not interfere with the sensing of Hg2+ by RHOQ. Due to the higher binding affinity of Hg2+ for RHOQ compared to Cu2+, Hg2+ would replace Cu2+ in the RHOQ–Cu2+ complex to form a new RHOQ–Hg2+ complex, thereby regenerating the fluorescence. Similarly, the much lower binding affinity of Fe3+ for RHOQ resulted in significantly low absorbance and fluorescence intensity.
3.8 Cytotoxicity and bioimaging application of RHOQ
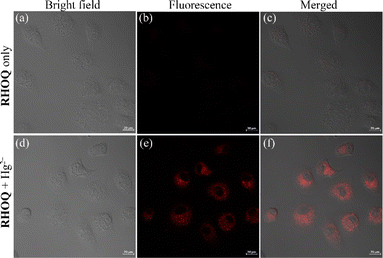
Building on the above experimental results, further studies were conducted in biological environments using HeLa cells. The cytotoxicity of RHOQ was evaluated using MTT assays before cell imaging (Fig. S10†). Living HeLa cells were incubated with different concentrations of probe RHOQ (0–30 μM) for 24 h at 37 °C, and the results suggested that the cell viability had negligible change, which indicated that RHOQ was low cytotoxicity to living cells.To test the capability of RHOQ to detection Hg2+ in living cells, HeLa cells were incubated with probe RHOQ (10 μM) at 37 °C for 30 min. Negligible fluorescence was found in the range of 580–640 nm (Fig. 11a–c). Upon further incubation of Hg(ClO4)2 for 30 min, a strong red fluorescence was observed (Fig. 11d–f), indicating that the intracellular uptake of Hg2+ resulted the spirolactam ring opening of RHOQ and fluorescence enhancement. These results showed that RHOQ has good cell membrane permeability and can be utilized for the detection of Hg2+ in living cells.
4 Conclusions
In summary, a highly Hg2+-selective rhodamine-based turn-on fluorescent probe RHOQ, was designed and investigated for Hg2+ detection. The probe exhibited a visual color change to Hg2+ and Cu2+, while only the presence of Hg2+ triggers intense fluorescence enhancement of RHOQ due to the formation of spirolactam ring-opening form of RHOQ. Common alkali, alkali earth and transition metal ions did not cause any interference to the fluorescence detection of Hg2+. With fast response, a wide applicable pH range, and a low detection limit (9.67 × 10⁻⁸ M), RHOQ holds promise for the sensitive and quantitative detection of Hg2+ in aqueous solutions. Additionally, MTT assays confirmed that RHOQ has low cytotoxicity toward living cells and can be utilized for the detection of Hg2+ in living cells. These results manifest that RHOQ has a good application prospect in the detection of Hg2+.Data availability
The data supporting this article have been included as part of the ESI.†Author contributions
Lei Zhang: investigation, formal analysis, resources, writing-original draft, funding acquisition. Jun Guo: investigation, formal analysis, resources. Qihua You: conceptualization, methodology, writing-review & editing, supervision.Conflicts of interest
There are no conflicts to declare.Acknowledgements
This work was supported by the Key R&D Program of Xinzhou Science and Technology Project (No. 20220301), and Scientific Research Project of Xinzhou Normal University (Grant No. 00001022).Notes and references
- P. A. Nogara, M. Farina, M. Aschner and J. B. T. Rocha, Chem. Res. Toxicol., 2019, 32, 1459–1461 Search PubMed.
- M. Zaib, M. M. Athar, A. Saeed and U. Farooq, Biosens. Bioelectron., 2015, 74, 895–908 CrossRef PubMed.
- J. Sardans, F. Montes and J. Peñuelas, Soil Sediment Contam., 2011, 20, 447–491 CrossRef.
- F. X. Han, W. D. Patterson, Y. Xia, B. B. M. Sridhar and Y. Su, Water, Air, Soil Pollut., 2006, 170, 161–171 CrossRef.
- R. S. Reimers, W. D. Burrows and P. A. Krenkel, J. - Water Pollut. Control Fed., 1973, 45, 814–828 Search PubMed.
- N. Kallithrakas-Kontos and S. Foteinis, Curr. Anal. Chem., 2016, 12, 22–36 CrossRef.
- H. Morita, H. Tanaka and S. Shimomura, Spectrochim. Acta, Part B, 1995, 50, 69–84 CrossRef.
- T. Samanta and R. Shunmugam, Mater. Adv., 2021, 2, 64–95 RSC.
- M. Vendrell, D. Zhai, J. C. Er and Y.-T. Chang, Chem. Rev., 2012, 112, 4391–4420 Search PubMed.
- F. Bu, B. Zhao, W. Kan, L. Ding, T. Liu, L. Wang, B. Song, W. Wang and Q. Deng, J. Photochem. Photobiol., A, 2020, 387, 112165 CrossRef CAS.
- H. Lv, G. Yuan, G. Zhang, Z. Ren, H. He, Q. Sun, X. Zhang and S. Wang, Dyes Pigm., 2020, 172, 107658 CrossRef CAS.
- S. Subedi, L. N. Neupane, H. Yu and K.-H. Lee, Sens. Actuators, B, 2021, 338, 129814 CrossRef CAS.
- X. Wu, N. Duan, Y. Li, S. Yang, H. Tian and B. Sun, J. Photochem. Photobiol., A, 2020, 388, 112209 CrossRef.
- N. Xiao, H. Xu, Y. Liu, Y. Tian, R. Tan, Y. Peng and Y.-W. Wang, Tetrahedron Lett., 2023, 120, 154435 CrossRef CAS.
- Y. Yu, C. Liu, B. Tian, X. Cai, H. Zhu, P. Jia, Z. Li, X. Zhang, W. Sheng and B. Zhu, Dyes Pigm., 2020, 177, 108290 CrossRef CAS.
- B. Sen, M. Mukherjee, S. Pal, K. Dhara, S. K. Mandal, A. R. Khuda-Bukhsh and P. Chattopadhyay, RSC Adv., 2014, 4, 14919–14927 RSC.
- S. O. Aderinto, Y. Xu, H. Peng, F. Wang, H. Wu and X. Fan, J. Fluoresc., 2017, 27, 79–87 CrossRef CAS.
- Y. Wang, H. Ding, S. Wang, C. Fan, Y. Tu, G. Liu and S. Pu, RSC Adv., 2019, 9, 11664–11669 RSC.
- K. P. Carter, A. M. Young and A. E. Palmer, Chem. Rev., 2014, 114, 4564–4601 Search PubMed.
- D. Wu, M. Ma, M. Zhang, Y. Xiao, H. Yu, Y. Shao, X. Zhang, Z. Cheng and Y. Xiao, Dyes Pigm., 2022, 198, 110001 CrossRef CAS.
- H. Zhang, J. Song, S. Wang, Q. Song, H. Guo and Z. Li, Dyes Pigm., 2023, 216, 111380 CrossRef CAS.
- B. D. Vanjare, P. G. Mahajan, H.-I. Ryoo, N. C. Dige, N. G. Choi, Y. Han, S. J. Kim, C.-H. Kim and K. H. Lee, Sens. Actuators, B, 2021, 330, 129308 CrossRef CAS.
- B. Du, Q. Li, K. Huang and L. Liang, J. Mol. Struct., 2023, 1271, 134015 Search PubMed.
- K. Huang, Y. Liu, Q. Li, B. Yu, L. Liang and D. Qin, Spectrochim. Acta, Part A, 2022, 281, 121651 CrossRef CAS PubMed.
- Y. Zhao, Y. Sun, X. Lv, Y. Liu, M. Chen and W. Guo, Org. Biomol. Chem., 2010, 8, 4143–4147 RSC.
- B. Du, Q. Li, K. Huang, Q. Wang and L. Liang, J. Photochem. Photobiol., A, 2023, 436, 114419 CrossRef.
- Y. Wang, H. Ding, S. Wang, C. Fan, Y. Tu, G. Liu and S. Pu, RSC Adv., 2019, 9, 11664–11669 RSC.
- Z.-Q. Xu, X.-J. Mao, Y. Wang, W.-N. Wu, P.-D. Mao, X.-L. Zhao, Y.-C. Fan and H.-J. Li, RSC Adv., 2017, 7, 42312–42319 RSC.
- C. Kan, X. Wang, L. Wu, X. Shao, H. Xing, M. You and J. Zhu, Anal. Methods, 2021, 13, 3987–3993 RSC.
- B. Li, F. Tian and Y. Hua, RSC Adv., 2022, 12, 21129–21134 RSC.
- Y. Shiraishi, S. Sumiya, Y. Kohno and T. Hirai, J. Org. Chem., 2008, 73, 8571–8574 CrossRef CAS.
- Q.-H. You, H.-B. Huang, Z.-X. Zhuang, X.-R. Wang and W.-H. Chan, Bull. Korean Chem. Soc., 2016, 37, 1772–1777 CrossRef CAS.
- J. M. An, S. Kang, E. Huh, Y. Kim, D. Lee, H. Jo, J. F. Joung, V. J. Kim, J. Y. Lee, Y. S. Dho, Y. Jung, J. K. Hur, C. Park, J. Jung, Y. Huh, J.-L. Ku, S. Kim, T. Chowdhury, S. Park, J. S. Kang, M. S. Oh, C.-K. Park and D. Kim, Chem. Sci., 2020, 11, 5658–5668 RSC.
- Q.-H. You, P.-S. Chan, W.-H. Chan, S. C. K. Hau, A. W. M. Lee, N. K. Mak, T. C. W. Mak and R. N. S. Wong, RSC Adv., 2012, 2, 11078–11083 RSC.
- G. Bao, B. Zhou and Y. Han, Tetrahedron Lett., 2022, 100, 153887 CrossRef CAS.
- Q.-H. You, P.-S. Chan, W.-H. Chan, S. C. K. Hau, A. W. M. Lee, N. K. Mak, T. C. W. Mak and R. N. S. Wong, RSC Adv., 2012, 2, 11078–11083 RSC.
- N. Kumari, N. Dey and S. Bhattacharya, RSC Adv., 2014, 4, 4230–4238 RSC.
Footnote |
| † Electronic supplementary information (ESI) available. See DOI: https://doi.org/10.1039/d4ra06115b |
| This journal is © The Royal Society of Chemistry 2024 |

