 Open Access Article
Triphenylamine-based dicyano fluorophore for the selective detection of hydrazine vapor using cellulose acetate nanofibrous sheet†
Boonkasem Choemvarasata,
Pipattra Mayurachayakul a,
Kornkanya Pratumyota,
Mongkol Sukwattanasinittb and
Nakorn Niamnont
 *a
*a
aSupramolecular Chemistry Research Unit, Department of Chemistry, Faculty of Science, King Mongkut's University of Technology Thonburi (KMUTT), Pracha Uthit Road, Bang Mod, Thung Khru, Bangkok 10140, Thailand. E-mail: nakorn.nia@kmutt.ac.th
bOrganic Synthesis Research Unit, Department of Chemistry, Faculty of Science, Nanotec-CU Center of Excellence on Food and Agriculture, Chulalongkorn University, Bangkok, 10330, Thailand
First published on 21st November 2024
Abstract
A novel triphenylamine-based dicyano fluorophore (compound 2) was successfully synthesized using a Suzuki cross-coupling reaction, followed by a Knoevenagel condensation catalyzed with baker's yeast. Later, compound 2 was combined with the hydrazine vapor of an electrospun nanofiber sheet, depending on its solid condition. In addition, the electrospinning technique was used to create a nanofiber sheet made of cellulose acetate (CA) combined with compound 2. The resulting sheet had an average diameter of 250 ± 41 nm. The nanofiber sheet had a remarkable ability to detect and respond to hydrazine vapor in an aqueous solution. The concentration range of 0–0.08% w/v was accurately determined by analyzing fluorescence images using ImageJ software. The mechanism was confirmed by conducting a 1H-NMR titration. The probe could function effectively across various pH levels from 4 to 11. It also provided an impressive detection limit as low as 0.005% (w/v). In addition, it showed high selectivity for hydrazine among 36 common interferents. Through careful analysis, it was discovered that the nanofibrous mat could detect and identify hydrazine. This was achieved through a visual detection method, whereby the mat exhibited a fluorescence turn-off effect when exposed to UV light with a wavelength of 365 nm. Thus, using a nanofibrous mat is a highly effective and appropriate technique for detecting hydrazine vapor in water in various environments and industries.
Introduction
Hydrazine (N2H4) is an essential fundamental component in the fine chemical sector, serving as a critical component for producing pharmaceuticals, insecticides, petroleum, catalysts, reducing agents, pharmaceutical raw materials, jet engine fuels, and rocket fuels.1–3 Despite its significant economic significance, the profound toxicity of hydrazine results in irreversible harm to both humans and the environment.4–7 Extended exposure to hydrazine may induce irritation of the nasal and respiratory tracts, potentially resulting in the manifestation of symptoms, including vertigo, migraine, nausea, hepatotoxicity, and potentially coma.8–10 Hydrazine has recently been identified as a probable carcinogen, as established by the US-EPA at a level of 10 parts per billion (ppb) or 0.31 μM.11 Therefore, developing an effective and sensitive method for detecting trace amounts of hydrazine is critical.Several conventional techniques, including chromatography/mass spectrometry,12 electrocatalysis13 and chemiluminescence,14,15 are presently employed to detect N2H4. Nevertheless, these methods are limited in their capacity to perform biological imaging or analysis in real-time, necessitating complex methodologies, costly apparatus, and extended monitoring.16,17 In contrast to these approaches, fluorescent sensors are attracting increasing interest due to their simplicity, cost-effectiveness, adaptability, and non-intrusive characteristics. Furthermore, these sensors provide the significant advantages of real-time and in situ analysis.18–20 As of now, a wide range of fluorophores have been established with the explicit intention of detecting hydrazine. Many different kinds of functional groups, such as acetate,21,22 4-bromobutyrate,23 1,4-cyclohexadiene ring,24 ethyl cyanoacetate,20,25 phthalimide,26,27 salicylaldehyde,28,29 the β-diketone group30 and malononitrile,31,32 have been utilized to recognize hydrazine. The adaptability and availability of malononitrile for hydrazine recognition offer significant benefits. The strong electron-withdrawing group of the nitrile group enhances the malononitrile unit's hydrazine identification efficiency and selectivity. By facilitating activation of the adjacent C![[double bond, length as m-dash]](https://www.rsc.org/images/entities/char_e001.gif) C bond, this group exposes the adjacent C
C bond, this group exposes the adjacent C![[double bond, length as m-dash]](https://www.rsc.org/images/entities/char_e001.gif) C bond to nucleophilic addition and subsequent N2H4 elimination.
C bond to nucleophilic addition and subsequent N2H4 elimination.
Chemical reaction of the malononitrile unit to N2H4 produces hydrazone. The presence of hydrazone causes disturbances in the intramolecular charge-transfer (ICT) mechanism, resulting in variations in optical signals, spanning from a red- to blue-shift.32 Malononitrile-based probes also allow a straightforward design, which enhances their versatility and enables their use in a wide range of applications.33,34 Ongoing research on the design of fluorescence probes is expected to increase their performance, thereby broadening their technological and scientific applicability. It is essential to highlight, however, that most fluorophores were investigated in the past in solution systems, and required the use of hazardous organic solvents in water media, because most the organic fluorescent probes were quenched in an aqueous solution or in the solid state through an aggregation-caused quenching (ACQ) effect. However, electrospun nanofibers can effectively solve the ACQ issue.35–37 Electrospinning is a technique used to produce nanofibers from various polymers using a high-voltage electric field to draw charged threads of polymer solutions into thin fibers. Incorporating probes into electrospun nanofibers can provide a more dispersed and stable state when applied to fluorescent probes.29,35–37
Electrospinning, a method that generates nanofibers directly from various polymers and composite materials by employing high voltage, is an adaptable and fundamental process.38,39 As a result of their inherently high surface-to-volume ratio, nanofibers are highly suitable for use as scaffolds in sensor applications.40–42 The present inquiry revolves around the utilization of electrospinning to generate a novel triphenylamine-based dicyano fluorophore, henceforth denoted as compound 2, which is then mixed with cellulose acetate (CA) to precisely engineer a sensor probe to selectively detect hydrazine in its vapor phase. Compound 2, comprising a malononitrile group functioning as a hydrazine probe, was specially designed and efficiently synthesized with this specific aim in mind. Additionally, triphenylamine was utilized as the fluorophore and as an electron-donating group to enhance the ICT process. The substrate CA was chosen because of its non-toxic nature and biodegradability, as shown in previous scientific investigations of the electrospinning-based production of nanofibrous materials.43
The present study aimed to achieve substantial progress in hydrazine detection by employing a comprehensive methodology to fabricate nanofibrous materials via electrospinning. Compound 2, combined with an electrospun nanofiber sheet provides numerous advantages, including orange emission stability across a broad pH range, high selectivity and sensitivity, and a significant Stokes shift. The nanofiber sheets were tested for qualitative hydrazine detection in actual water samples, whereby by using a smartphone, standard curves were plotted that enabled the accurate quantification of hydrazine in real water samples.
Experimental
Materials and solvents
4-(Diphenylamino)phenylboronic acid and 4-bromobenzaldehyde were obtained from Tokyo Chemical Industry (TCI). Cellulose acetate powder, tetrakis(triphenylphosphine)palladium(0), malononitrile, and hydrazine monohydrate (99%) were purchased from Sigma-Aldrich. High-quality solvents of analytical reagent grade, including diethyl ether, tetrahydrofuran (THF), dimethylsulfoxide (DMSO), dimethylformamide (DMF), acetone, chloroform, ethanol (EtOH), methanol (MeOH), and acetonitrile (MeCN), were purchased from RCI Labscan. The extra reagents were obtained from Sigma-Aldrich, Merck, or RCI Labscan without specific selection criteria and were not further purified unless otherwise specified. All the reactions were conducted in a nitrogen environment. Additionally, reaction progress was monitored by F254 thin-layer chromatography (TLC), and the components were visualized under UV light (365 nm). Commercial-grade solvents, including hexane, dichloromethane (DCM), and ethyl acetate (EtOAc), were distilled before extraction and the chromatography experiments. All the liquid solutions were made using pure Type II water.Analytical instruments
NMR spectra for the dicyano derivative based on triphenylamine were obtained using a Bruker Avance III HD spectrometer set to 400 MHz for the 1H-NMR and 100 MHz for the 13C-NMR analyses. Tetramethylsilane was utilized as the internal reference. The number of absorption signals in the 1H-NMR spectra was categorized as follows: s/singlet; d/doublet; t/triplet; sd/singlet of doublet; dd/doublet of doublet; dt/doublet of triplet; td/triplet of doublet; tt/triplet of triplets; m/multiplet. Infrared spectroscopy using KBr pellets was performed on a Nicolet 8700 instrument (Thermo Fisher Scientific). High-resolution electrospray ionization mass spectroscopy (HRMS) was performed utilizing a Bruker MaXis instrument with ethyl acetate as the solvent in the positive ionization mode. Melting points were measured using a Thomas Hoover capillary instrument, and no adjustments were made to the obtained values. Fluorescent spectra were measured using a Hitachi F-2500 fluorescence spectrophotometer. UV-vis absorption spectra were obtained using a PerkinElmer Ltd Lambda 35/dias 300 UV-vis spectrophotometer. The morphology of the electrospun nanofibrous sheets was analyzed using a JSM-6301F SEM analyzer (JEOL).Synthesis of compound 1
4-(Diphenylamino)phenylboronic acid (1.0144 g, 4.06 mmol) was mixed with 4-bromobenzaldehyde (0.8260 g, 4.505 mmol), tetrakis(triphenylphosphine)palladium(0) (0.6072 g, 0.63 mmol), and potassium carbonate (1.089 g, 7.75 mmol) in a solution containing 30 mL of tetrahydrofuran and 3 mL of DI water. After stirring for 12 h at 70 °C under nitrogen gas, the mixture was treated with 1 M hydrochloric acid (40 mL) and then extracted with ethyl acetate (2 × 30 mL) and deionized water (50 mL). The organic layer was separated and dehydrated using anhydrous sodium sulfate. The solvent was evaporated and purified using a silica gel column by changing the pure hexane to a mixture of hexane/CH2Cl2 (3/2) to obtain compound 1 (0.4585 g, 72% yield). 1H-NMR (400 MHz, CDCl3) δ 10.03 (1H, s), 7.93 (d, J = 8.0 Hz, 2H), 7.73 (d, J = 8.0 Hz, 2H), 7.52 (d, J = 8.0 Hz, 2H), 7.31–7.26 (m, 4H), 7.16–7.14 (m, 6H), 7.09–7.05 (m, 2H).44Synthesis of compound 2
Compound 1 (0.5015 g, 1.4 mmol) and malononitrile (0.1822 g, 2.9 mmol) were mixed in 20 mL of ethanol, and 500 mg of baker's yeast was added as a catalyst. After 4 h stirring at ambient temperature, the reaction mixture was filtered with Celite to eliminate the yeast following the specified reaction time. Ethanol was isolated from the filtrate using vacuum distillation and further refined by crystallization. Compound 2 was obtained by purifying the product, resulting in 0.4734 mg of the final product 2 with an 85% yield. 1H-NMR (400 MHz, CDCl3) δ 7.96 (d, J = 8.0 Hz, 2H), 7.75 (s, 1H), 7.73 (2H, m), 7.52 (d, J = 8.0 Hz, 2H), 7.32–7.28 (m, 4H), 7.17–7.07 (m, 8H); 13C-NMR (100 MHz, CDCl3) δ 159.05, 149.03, 147.13, 146.84, 131.54, 129.48, 129.17, 127.93, 127.08, 125.17, 123.81, 122.66, 114.12, 113.01; HRMS (ESI): m/z [M + H]+ calcd. For: C28H20N3: 398.1652, found: 398.1641.Investigation of the photophysical characteristics of compound 2 in solvents with various polarities
The stock solution (1 mM) of compound 2 was dissolved in solvents of varying polarity, including hexane, diethyl ether, CHCl3, EtOAc, THF, CH3CN, DMSO, ethanol, and methanol, to a give a final concentration of 10 μM, and were then allowed to stand for 10 min at room temperature. The solutions were then subjected to UV-vis absorption analysis from 270 nm to 700 nm, and fluorescent spectroscopy analysis from 450 nm to 800 nm using the highest absorption wavelength as the excitation wavelength.29Optical spectra of compound 2 following reaction with hydrazine
Compound 2 (1 mM) was dissolved in DMSO to create a stock solution. Dilution was carried out on several samples of compound 2, each produced separately with or without the hydrazine solution in DSMO to give a final concentration of 10 μM, and the samples were then allowed to stand for 10 min at room temperature. The samples were then subjected to UV-vis absorption analysis from 270 nm to 700 nm. Also, the fluorescence spectra were measured from 380 nm to 800 nm with the excitation wavelength set at the maximum absorption wavelength.29 All the experiments were conducted in triplicate to ensure reliability and consistency of the results.Theoretical calculations
The molecular geometry in its lowest energy state was optimized using density functional theory (DFT) and Gaussian 09W software, using the B3LYP/6-31 G(d,p) basis set. GaussView 6.0 was used to represent the molecular orbitals graphically, offering a thorough insight into the electronic arrangement and distribution inside the optimized molecular structure.45–47Fabrication of a nanofibrous sheet of compound 2
Compound 2 at a concentration of 0.01% w/v was dissolved in a solution containing 1% v/v Tween 80 and a combination of acetone and DMF in a 2![[thin space (1/6-em)]](https://www.rsc.org/images/entities/char_2009.gif) :
:![[thin space (1/6-em)]](https://www.rsc.org/images/entities/char_2009.gif) 1 ratio at room temperature. CA powder at a 17% weight/volume was added and the solution was then agitated for 1 h until the polymer solution became homogeneous. The compound 2-CA polymer solution was injected into a syringe with a needle for the electrospinning process. The specific parameters were as follows: electric voltage of 17 kV, solution feed rate of 2 mL per hour, and needle tip positioned 12 cm away from the collector wheel. After electrospinning, nanofiber sheets of compound 2 were taken from the collector wheel and put in a vacuum oven at 60 °C for 6 h to remove any residual solvent. Gold layers were added to the nanofibrous sheet by sputter-coating. The particle shape was then studied with a JEOL (JSM-6301F) SEM machine set to an accelerating voltage of 20 kV.35–37,43
1 ratio at room temperature. CA powder at a 17% weight/volume was added and the solution was then agitated for 1 h until the polymer solution became homogeneous. The compound 2-CA polymer solution was injected into a syringe with a needle for the electrospinning process. The specific parameters were as follows: electric voltage of 17 kV, solution feed rate of 2 mL per hour, and needle tip positioned 12 cm away from the collector wheel. After electrospinning, nanofiber sheets of compound 2 were taken from the collector wheel and put in a vacuum oven at 60 °C for 6 h to remove any residual solvent. Gold layers were added to the nanofibrous sheet by sputter-coating. The particle shape was then studied with a JEOL (JSM-6301F) SEM machine set to an accelerating voltage of 20 kV.35–37,43
Hydrazine vapor quantitative detection by the nanofibrous sheet of compound 2
Fluorescent images were obtained to analyze the change in fluorescent intensity of compound 2 after exposure of the nanofibrous sheets (cut into pieces measuring 2.0 cm by 2.0 cm) to hydrazine vapor to determine the hydrazine concentration in a particular phase. The images of compound 2's nanofibrous sheets were captured using a portable UV lamp stimulated at a wavelength of 365 nm before exposure to hydrazine vapor. Then, the sheets were placed over the fixed-volume hydrazine vials for 6 min. The fixed-volume vials contained hydrazine solutions with different concentrations (0, 0.01, 0.02, 0.04, 0.06, and 0.08% w/v), which were prepared 30 min before use to generate saturated-hydrazine in the vials. Subsequently, further were captured using the same portable UV light operating at an excitation wavelength of 365 nm. The photos were taken using the Pro Camera app on an iPhone, and were taken with the lowest ISO and medium white balance settings. The program version 1.48 of the picture software was used to transform the digital color data in the digital photos into grayscale. A correlation was established between the hydrazine concentration in the water solution and the ratio of the grayscale values obtained from the fluorescent image intensities before (I0) and after (I) exposure to hydrazine vapor. All the experiments were conducted in triplicate to ensure the reliability and consistency of the results.Selective and competitive studies of the compound 2 nanofibrous sheets
Images of the nanofibrous sheets of compound 2 were taken before and after exposure to different analytes (0.08% w/v) and hydrazine (0.08% w/v) using a portable UV lamp with an excitation of 365 nm for 6 min at room temperature. ImageJ version 1.48 software was used to transform the digital color data from the photographs into grayscale. The correlation between the grayscale value of the different fluorescent image intensities (I–I0) before (I0) and after (I) exposure to various analytes was plotted graphically. For the selectivity determination, solutions of various analytes were used, including metal ions and different chemical compounds (K(I), Na(I), Mg(II), Ca(II), Cu(II), Zn(II), Al(III), Fe(III), F−, Cl−, Br−, I−, NO3−, HPO42−, SO42−, acetone, DMF, aniline, chlorobenzene, DMSO, hexane, IPA, methanol, N,N-diethylaniline, TEA, N,N-dimethylformamide, NH4OH, N-methylaniline, THF, DI water, EtOH, fluorobenzene, ethylene glycol, H2O2, iso-propanol, and AcOH).Hydrazine detection through compound 2 utilizing 1H-NMR titration
1H-NMR titration was used to study the reaction progress between compound 2 and hydrazine. Stock solutions of compound 2 at a concentration of 20 mM were first dissolved in DMSO-d6. Each sample was diluted to obtain several samples of compound 2 (2 mM), each with varying quantities of hydrazine (0 and 2.0 equiv.) in DMSO-d6, synthesized separately. The samples were concentrated to a final concentration of 5 mM and then left to stand for 4 min at room temperature. The data were analyzed using 1H-NMR spectroscopy, and the spectra were merged into a stacked plot using Mnova software.Real sample detection
Real sample analyses were performed with wastewater, river water, tap water, drinking water, and Agaricus bisporus mushrooms. River water, industrial and military pollutants, and potential byproducts from disinfection processes and distribution networks can all contaminate tap water. Hydrazine, which is commonly utilized for eliminating halogens in wastewater treatment, can contaminate drinking water sources affected by wastewater or the effluents of wastewater treatment plants. For these sample tests, a nanofibrous sheet of compound 2 was fumigated using tap water and concentrations of standard hydrazine solution (0.070% w/v). Images of compound 2's nanofibrous sheet were taken before and after exposure to different materials using a portable UV lamp emitting light at 356 nm for 6 minutes at room temperature. ImageJ version 1.48 was used to convert the digital color data in the digital pictures to grayscale. All the experiments were conducted in triplicate to ensure the reliability and consistency of the results. Finally, the relative standard deviation (RSD%) and recovery percentages were computed.Results and discussion
Design and characterization of compound 2
Compound 2 consists of triphenylamine, benzene and malononitrile moieties. Triphenylamine acts as a donor (D) group, which has three benzenes around the central nitrogen atom and is a non-planar propeller structure. Owing to its non-planarity, it prevents aggregation-caused quenching (ACQ) and gives a strong fluorescent emission. Benzene connects the triphenylamine and malononitrile moieties and acts as a bridge (π). Malononitrile has two dicyano groups that are electron-withdrawing groups; the resulting malononitrile acts as an acceptor (A) for hydrazine at the C![[double bond, length as m-dash]](https://www.rsc.org/images/entities/char_e001.gif) C bond, which then changes to hydrazone. These show that compound 2 was designed via a D–π–A concept.
C bond, which then changes to hydrazone. These show that compound 2 was designed via a D–π–A concept.
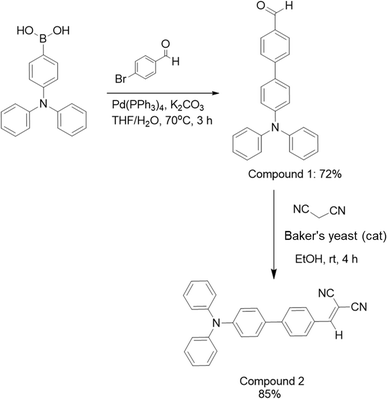
Compound 2 was synthesized in two steps using a Suzuki cross-coupling reaction and baker's yeast to help the Knoevenagel condensation. First, 4-(diphenylamine)phenylboronic acid and 4-bromobenzaldehyde were reacted via a Suzuki cross-coupling reaction to generate compound 1 (72%). Next, the compound 1 and malononitrile were mixed with baker's yeast, which produced compound 2 in a good yield (85%) via a Knoevenagel condensation, as shown in Scheme 1. All the structures were confirmed by their 1H-NMR, 13C-NMR, and HRMS spectra, as shown in Fig. S1–S4.†
Photophysical properties of compound 2 in various solvents with different polarities
The absorption spectra showed that the solvent polarity did not significantly impact the absorption spectra in various solvents. Fig. 1 displays the emission spectra of compound 2 normalized in solvents with different polarities. Compound 2 had polarity-sensitive properties in its emission spectra, as seen by the significant shift in the 100–120 nm emission spectra across the different solvents. The findings showed a change in the molecules' molecular orientation from being less polar in their ground states to more polar in their excited states (Fig. 1a). This occurred due to a twisted internal charge transfer after the excitation of the molecules. Charged particles may remain stable in liquids with high polarity when separated, allowing their excited states to persist. This may result in a bathochromic change. The Stokes shifts were plotted against the orientation polarizability parameter (Δf) using the Lippert–Mataga (LM) connection29,48 to understand how the compounds' photophysical characteristics varied with the solvent polarity. To comprehend the variation in the molecules' dipole moments from their ground to excited states, potentially associated with the solvatochromism of compounds, understanding the functioning of the slopes of the LM plots is essential. Compound 2 had the most significant solvatochromic features in the series due to its high slope values with all the tested solvents, as shown in Fig. 1b. The findings suggested that distinct polar excited states may be included in the structure by introducing electron-donating polycyclic hydrocarbon units, such as pyrene. This might result in the development of fluorescent probes exhibiting high polarity sensitivity. The correlation between the solvent polarity and emission color suggests that compound 2 has the potential to be used as a fluorescent probe for environmental detection.Optical spectral responses of compound 2 toward hydrazine and the detection mechanism
We examined the fluorescence and UV-Vis absorption spectra of compound 2 to determine whether it could be used to detect hydrazine. The experiment was performed both with and without the addition of hydrazine, as illustrated in Fig. 2. Fig. 2a shows that compound 2 exhibited two distinct absorption bands in DMSO, namely at 445 and 290 nm. Working with planar triphenylamine derivatives enables one to observe absorption bands due to excited-state intramolecular proton transfer (ESIPT). A maximal absorption wavelength of 340 nm emerged after adding hydrazine, which reduced the π-conjugation system. The color transition of the solution changed from orange to colorless, allowing the use of calorimetry to detect hydrazine with the naked eye. Compound 2 was excited at a wavelength of 445 nm, and emitted light with a peak wavelength of 605 nm upon the addition of hydrazine. As shown in Fig. 2b, the fluorescence spectra gradually diminished as they approached 455 nm. This occurred due to the transformation of aldehyde and hydrazine into hydrazone. When subjected to ultraviolet radiation at a wavelength of 365 nm, the fluorescence evolved from orange to blue (Fig. 2b, inset). In the context of the ratio-based fluorescence detection of hydrazine, it is advantageous to ascertain the reason behind the rapid formation of compound 2–hydrazine at room temperature.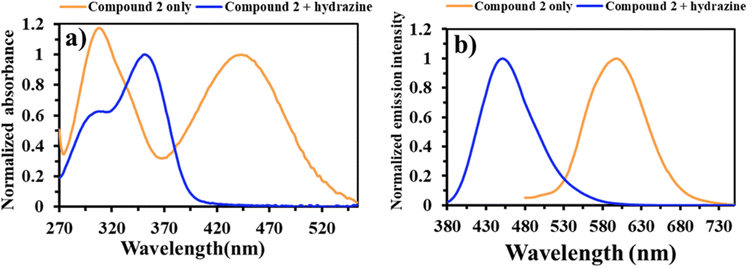 | ||
| Fig. 2 Changes in the normalized absorption (a) and emission spectra (b) for compound 2 (10 μM) before (orange line) and after (blue line) the addition of N2H4 (10 μM) in DMSO. | ||
Morphology of the nanofibrous sheet of compound 2
Fig. 3 displays the standard scanning electron microscopy (SEM) image of the nanofibrous sheet created by combining compound 2 (0.01% w/v) with CA through the electrospinning process. The images how that when compound 2 was added to the nanofibers, it did not impact their morphology. However, the nanofibers came together to form a non-woven mat with a random orientation, resulting in gaps between them. Thus, the nanofibers formed by the mixture of compound 2 and CA displayed a uniform and sleek surface, free from any polymer beads. According to Fig. 3, the nanofibers had an average diameter of 268 ± 53 nm. This nanoarchitecture strategy utilized a basic electrospinning technique to create a three-dimensional (3D) structure. With its expanded surface areas, the porous nanofiber film could be anticipated to offer remarkable sensitivity and rapid reaction times, making it suitable for various sensing applications.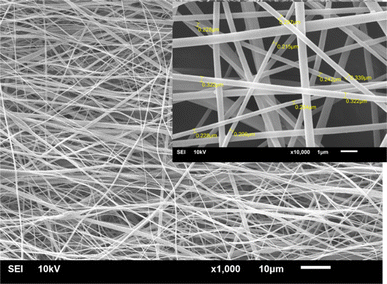 | ||
| Fig. 3 SEM images showing the combination of compound 2 with a nanofibrous sheet fabricated from CA. | ||
Hydrazine vapor quantitative detection by the nanofibrous sheet of compound 2
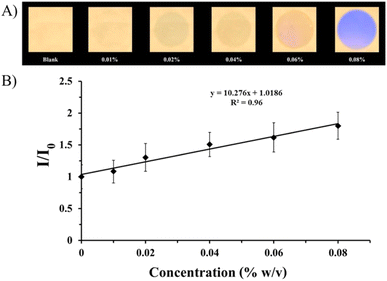
To expedite and optimize the detection of hydrazine, we used the electrospinning technique to create a nanofibrous sheet composed of compound 2. This sheet was then cut into smaller pieces measuring 2.0 cm × 2.0 cm. The nanofibrous sheet of compound 2 was then positioned at the entrance of a vial containing hydrazine solution in water and was thereafter exposed to fumigation for 6 min at room temperature. As shown in Fig. 4A, the intensity of the fluorescent emissions from the nanofibrous sheet decreased from a strong green light to a non-fluorescent signal depending on the quantity of hydrazine in the aqueous solution. A smartphone was used to acquire the photos of the fluorescent images arising under the illumination of a portable UV lamp with an excitation wavelength of 365 nm to differentiate against hydrazine. The ImageJ software (version 1.48) was then used to transform the digital color information from the digital pictures into grayscale values. Finally, a calibration curve was prepared by plotting the ratio of grayscale values (I/I0) before (I0) and after (I) exposure to hydrazine vapor at various concentrations of hydrazine (0.01, 0.02, 0.04, 0.06, and 0.08% w/v) in aqueous solution, as shown in Fig. 4B. The concentration varied in a straight line between 0.01% and 0.08% weight/volume. The limit of detection (LOD) for hydrazine was found to be 0.005% w/v using the usual approach (3s/K, where s is the standard deviation of the blank and K is the slope of the calibration). This value was lower than reported in prior tests, indicating that it was the optimum result.Vapor phase selectivity and interference tests for the nanofibrous sheet of compound 2
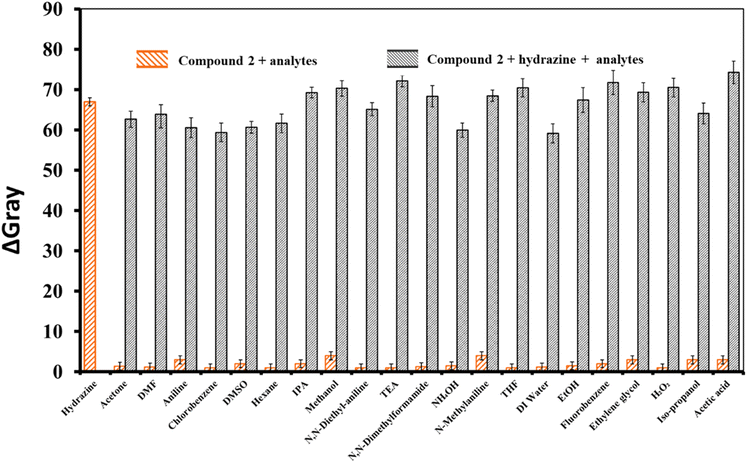
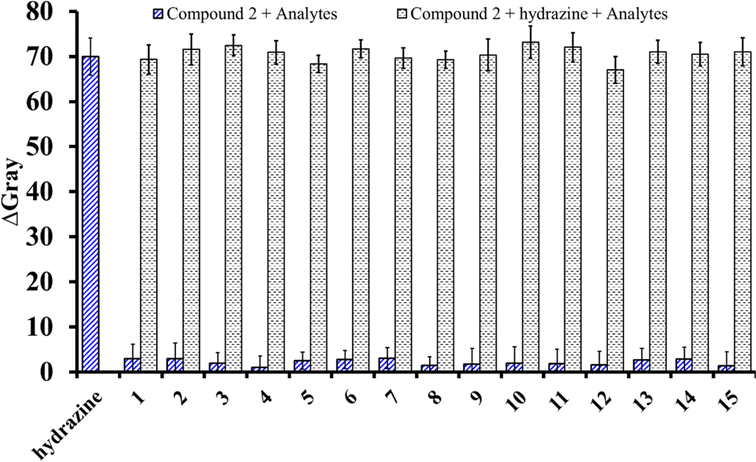
The nanofibrous sheet of compound 2 was tested for selectivity toward hydrazine vapor using 22 different compounds, namely hydrazine, acetone, DMF, aniline, chlorobenzene, DMSO, hexane, IPA, methanol, N,N-diethylaniline, TEA, N,N-dimethylformamide, NH4OH, N-methylaniline, THF, DI water, EtOH, fluorobenzene, ethylene glycol, H2O2, iso-propanol, and AcOH.The results suggest that the emissions of compound 2 were relatively stable in the fluorescent mode when exposed to different amines, volatile organic compounds, acids, and base analytes, without substantial changes under identical circumstances. In addition, anti-interference investigations were performed with the sensor based on compound 2 by introducing 10 equivalent ions of various types. To compare the fluorescence intensities of the peaks for compound 2 with these species and hydrazine, they were sequentially measured, and the corresponding results are shown in Fig. 5a. The sensor of compound 2 exhibited comparable fluorescence reactions to hydrazine vapor, irrespective of the presence or absence of the different interferents. It was observed that the fluorescence intensity did not impact the fluorescence characteristics of the system compared to systems including various cations and anions (no. 1–15: NH2NH2, K(I), Na(I), Mg(II), Ca(II), Cu(II), Zn(II), Al(III), Fe(III), (F−), (Cl−), (Br−), (I−), (NO3−), (HPO42−), and (SO42−)) in an aqueous medium. Compound 2 exhibited a noteworthy rise in emissions only in the presence of hydrazine vapor. The specific response of the nanofibrous sheet of 2 to hydrazine vapor could also be detected by the naked eye, as shown in Fig. 5b. Moreover, interference investigations were carried out on supplementary competing anions to confirm the probe's ability to detect hydrazine in the presence of several other compounds.
Sensing mechanism of compound 2 for hydrazine detection
The interaction between hydrazine and compound 2 was studied through a series of experimental investigations. Fig. 6a displays the chemical composition of the resulting product after adding NH2NH2. In addition, Fig. 6b shows the 1H-NMR titration spectra of compound 2 (2 mM) in DMSO-d6, with added equivalents (0 and 2 equiv.). Compound 2 exhibited a benzylic proton at 8.54 ppm (a-H), which was found to be in a deshielded position. This deshielding effect was attributed to the electron-withdrawing group of dicyano in the absence of hydrazine. With the addition of an excessive amount of hydrazine, it was observed that the benzylic proton (a-H) was absent, indicating that it had been substituted by hydrazine, leading to the formation of an imine group. Furthermore, novel chemical shifts for the C![[double bond, length as m-dash]](https://www.rsc.org/images/entities/char_e001.gif) CH and –NH2 groups were detected at 7.75 (a′-H) and 6.80 ppm (–NH2), respectively.
CH and –NH2 groups were detected at 7.75 (a′-H) and 6.80 ppm (–NH2), respectively.
The method we propose for detecting hydrazine using a sensor based on compound 2 is detailed in Scheme 2. The dicyano group in compound 2 acts as an electrophile due to its electron-withdrawing solid nature, while the amino group in hydrazine functions as a nucleophile because of its electron-donating ability. This unique interaction allows hydrazine to react quickly with the carbon atom, which is electron-poor and connected to the dicyano group. Subsequently, the carbon reacts with NH2NH2 to form an imine. Finally, a two-step procedure involving the removal of malononitrile leads to the formation of the compound 2–N2H4. This method provides a novel and practical approach for hydrazine detection.
Theoretical calculations
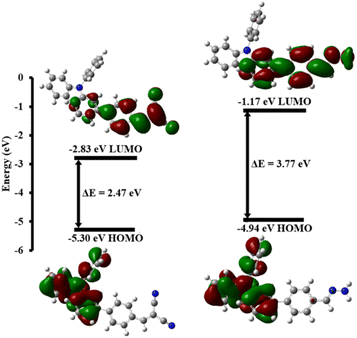
Using theoretical calculations with density functional theory and the B3LYP/6-31 G(d,p) basis set, we explored the blue-shift in the fluorescence response of compound 2 upon exposure to hydrazine. The calculations were carried out using the Gaussian 09W software package, as depicted in Fig. 7. Compound 2 and its compound 2–hydrazine complex displayed significant differences in their electronic distributions before and during their reaction with hydrazine.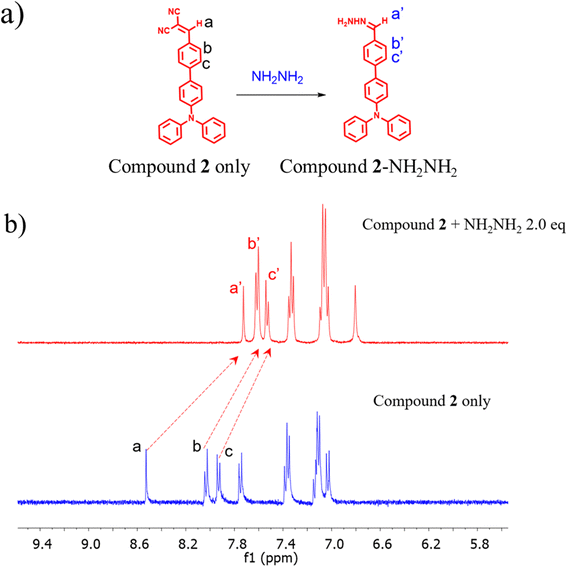 | ||
| Fig. 7 (a) Chemical structure of the product (compound 2 + NH2NH2) in the presence of hydrazine and (b) 1H-NMR titration of compound 2 in the absence and presence of hydrazine in DMSO-d6. | ||
The electron density in compound 2 was mainly in the triphenylamine group on the highest occupied molecular orbital (HOMO) before transitioning to the dicyano group on the lowest unoccupied molecular orbital (LUMO). Furthermore, the electron densities were distributed across the π-conjugated system on the highest occupied molecular orbital (HOMO) of the hydrazone product (compound 2–hydrazine complex), while they moved toward the imine moiety on the lowest unoccupied molecular orbital (LUMO). In addition, the energy difference between the highest occupied molecular orbital (HOMO) and the lowest unoccupied molecular orbital (LUMO) of the compound 2–hydrazine complex was determined to be 3.77 eV, while the energy gap for compound 2 alone was measured at 2.47 eV. There was thus a significant imbalance in energy levels between compound 2–HZ and compound 2, resulting in a noticeable shift toward shorter wavelengths (blue-shift) in the absorption and emission spectra when compound 2 was exposed to hydrazine (Fig. 8).
Analysis of real water samples
The nanofibrous sheet of compound 2 was employed to monitor hydrazine in tap water samples. Each sample was spiked with a determined volume of hydrazine (0.070% w/v). Every sample was tested three times and the findings are reported in Table 1. This technique demonstrated an acceptable recovery (<10% error), thus suggesting that it is reliable for detecting hydrazine in actual samples, and indicating the nanofibrous sheet of compound 2 has the potential for use as a new option for selectively detecting hydrazine vapor.| Real samples | Spike (% w/v) | Found (% w/v) | Recovery (%) | % RSD |
|---|---|---|---|---|
| Wastewater | 0.070 | 0.073 ± 0.007 | 104.29 | 9.6 |
| River water | 0.070 | 0.074 ± 0.009 | 105.71 | 12.2 |
| Tap water | 0.070 | 0.072 ± 0.007 | 102.86 | 9.7 |
| Drinking water | 0.070 | 0.065 ± 0.006 | 93.86 | 9.2 |
| Fresh champignon mushroom | 0.070 | 0.077 ± 0.008 | 110.58 | 10.4 |
Comparison of the sensor based on compound 2 with some previously reported sensors
Table 2 shows a comparison, including the sensitivity and selectivity, of the hydrazine sensor developed in this work based on compound 2 and some other hydrazine sensors previously described in the published literature. Compound 2 demonstrated outstanding results in terms of selectivity and sensitivity. It only took 6 min to detect hydrazine, compared to the 10 min to 24 h required by other earlier sensors. Additionally, the detection limit (LOD) of compound 2 on a cellulose acetate nanofibrous sheet was found to be 0.005% w/v, which indicated that compound 2 had a lower LOD than some previous sensors. Table 2 further demonstrates that, in comparison to other aggregation-induced emission (AIE) groups, such as the pyrene moiety, the cellulose acetate nanofibrous sheet containing triphenylamine offered higher sensitivity and selectivity. Thus, this work contributes an advancement in the development of hydrazine-detecting sensors.| Molecular sensors | Mode of detection | Matrix material | LOD | Detection time | Ref. |
|---|---|---|---|---|---|
| Bromo-ester/coumarin | Turn-on fluorescent | Filter paper | 0.50% w/v | 10 min | 49 |
| Bromo-ester/naphthalimide | Turn-on fluorescent | TLC plate | 5.00% w/v | 1 h | 50 |
| Dicyanomethane/tetraphenylethylene | Turn-on fluorescent | Filter paper | 10.00% w/v | 10 min | 51 |
| Salicylaldehyde/benzothiazole | Fluorescent color changes | Filter paper | 10.00% w/v | 10 min | 52 |
| Coumarin/naphthalimide | Fluorescent changes | Filter paper | 0.05% w/v | 10 min | 53 |
| Dicyano/naphthalene | Turn-on fluorescent | Filter paper | 0.00002% w/v | 24 h | 54 |
| Dicyano/pyrenylbenzylidene | Fluorescent changes | Cellulose acetate nanofibrous | 0.02% w/v | 10 min | 55 |
| Salicylaldehyde/triphenylamine | Fluorescent changes | Cellulose acetate nanofibrous | 0.03% w/v | 10 min | 28 |
| Dicyano/triphenylamine | Fluorescent changes | Cellulose acetate nanofibrous | 0.005% w/v | 6 min | This work |
Conclusions
This study highlights the successful creation of a new fluorophore (compound 2) and its integration with a CA electrospun nanofibrous sheet for accurately detecting hydrazine in the vapor phase. The nanofibrous sheet showcased various capabilities, serving as a fluorescence quencher and demonstrating selectivity toward hydrazine. Using ImageJ software, we conveniently employed fluorescence image analysis to examine the intensity changes of the nanofibrous sheet. This allowed us to effectively determine the concentration of the target hydrazine through the obtained fluorescent images. Compared to other solid-state fluorogenic methods for detecting hydrazine gases, the proposed nanofibrous sheet presents a convenient and beneficial technique for effectively detecting chemicals in environmental settings. The nanofibrous sheet of compound 2 had a detection limit of 0.005% w/v for hydrazine vapor. Compound 2 also demonstrated excellent selectivity and sensitivity to hydrazine, resulting in a detection mode where the ICT procedure was reduced by hydrazine. Finally, satisfactory results were obtained using compound 2 to detect hydrazine in actual water samples. We expect that compound 2 and its nanofibrous sheet could be applied for hydrazine detection in environmental pollution monitoring, especially for the detection of hydrazine in water or air. Future research should enhance the hydrazine detection sensitivity, selectivity, and provide further validation, as well as do further exploration studies for real-time monitoring with portable devices, and conduct long-term stability and reproducibility studies to assess performance over time and under varying conditions.Data availability
The data supporting this article have been included as part of the ESI.†Conflicts of interest
The authors declare that they have no known competing financial interests or personal relationships that could have influenced the work reported in this paper.Acknowledgements
This project is funded by the National Research Council of Thailand (NRCT, N42A661000), King Mongkut's University of Technology Thonburi's Postdoctoral Fellowship Under Research Project ID 1839, and supported by King Mongkut's University of Technology Thonburi (KMUTT), Thailand Science Research and Innovation (TSRI), and the National Science, Research and Innovation Fund (NSRF) Fiscal Year 2025, Grant Number FF6800382.Notes and references
- A. Furst, R. C. Berio and S. Hooton, Chem. Rev., 1965, 65, 51–68 CrossRef CAS.
- J. R. Dilworth, Coord. Chem. Rev., 1976, 21, 29–62 CrossRef CAS.
- X. Y. Zhang, Y. S. Yang, W. Wang, Q. C. Jiao and H. L. Zhu, Coord. Chem. Rev., 2020, 417, 213367 CrossRef CAS.
- S. Mu, H. Gao, C. Li, S. Li, Y. Wang, Y. Zhang, C. Ma, H. Zhang and X. Liu, Talanta, 2021, 221, 121606 CrossRef CAS PubMed.
- D. Li, Q. Wang, N. Rao, Y. Zhang, Y. Le, L. Liu, L. Li, L. Huang and L. Yan, J. Mol. Struct., 2021, 1239, 130521 CrossRef CAS.
- S. K. Manna, D. Kuilya, M. Mondal, D. Mandal, A. Rout, S. Pramanik and S. Mondal, J. Mol. Struct., 2024, 1302, 137476 CrossRef CAS.
- X. X. Shi, Z. Z. Wang, X. L. Sun, Y. L. Wang, H. X. Liu, F. Wang, G. F. Hao and G. F. Yang, Green Chem., 2023, 25, 2170–2219 RSC.
- J. K. Niemeier and D. P. Kjell, Org. Process Res. Dev., 2013, 17, 1580–1590 CrossRef CAS.
- J. K. Morris, N. J. Wald and A. L. Springett, PLoS One, 2015, 10, e0138884 CrossRef PubMed.
- J. White, S. A. Weinstein, L. D. Haro, R. Bédry, A. Schaper, B. H. Rumack and T. Zilker, Toxicon, 2019, 157, 53–65 CrossRef CAS PubMed.
- U.S. Environmental Protection Agency (EPA), Integrated Risk Information System (IRIS) on Hydrazine/Hydrazine Sulfate, National Center for Environmental Assessment, Office of Research and Development, Washington, DC, 1999 Search PubMed.
- J. A. Oh and H. S. Shin, J. Chromatogr. A, 2015, 1395, 73–78 CrossRef CAS PubMed.
- H. Ganesha, S. Veeresh, Y. S. Nagaraju and H. Devendrappa, RSC Adv., 2023, 13, 34891–34903 RSC.
- A. Safavi, G. Absalan and F. Bamdad, Anal. Chim. Acta, 2008, 610, 243–248 CrossRef CAS PubMed.
- J. Wang, T. Xie, Q. Deng, Y. Wang, Q. Zhu and S. Liu, New J. Chem., 2019, 43, 3218–3225 RSC.
- F. Yu, P. Li, P. Song, B. Wang, J. Zhao and K. Han, Chem. Commun., 2012, 48, 2852–2854 RSC.
- B. Shi, S. Qi, M. Yu, C. Liu, Z. Li, L. Wei and Z. Ni, Spectrochim. Acta, Part A, 2018, 188, 208–212 CrossRef CAS PubMed.
- Y. Jiang, Y. Chen, Q. Yang, S. Zhu and J. Shen, J. Mol. Struct., 2022, 1256, 132509 CrossRef CAS.
- Y. P. Zhang, X. Yang, F. Yang, Y. S. Yang, X. X. Li and H. R. Zhang, J. Mol. Struct., 2024, 1312, 138498 CrossRef CAS.
- L. Chen, B. Lv, Z. Wang, L. Sun, X. Sun, J. Li and W. Gu, Dyes Pigm., 2023, 220, 111680 CrossRef CAS.
- Y. Jung, N. K. Park, J. S. Kang and D. Kim, Sensors, 2019, 19, 4525 CrossRef CAS PubMed.
- J. Cheng, Y. Luo, Y. Hao, H. Han, X. Hu, Y. Yang, X. Long, J. He, P. Zhang, R. Zeng, M. Xu and S. Chen, Spectrochim. Acta, Part A, 2024, 305, 123463 CrossRef CAS PubMed.
- Z. Ran, H. R. Xu, K. Li, K. K. Yu, J. Yang and X. Q. Yu, RSC Adv., 2016, 6, 111016–111019 RSC.
- J. Liu, T. Li, S. Wang, Q. Qi, H. Song, Z. Li, L. Yang and W. Huang, RSC Adv., 2020, 10, 5572–5578 RSC.
- Z. Li, M. Ren, L. Wang and W. Lin, Anal. Methods, 2018, 10, 4016–4019 RSC.
- S. D. Hiremath, R. U. Gawas, D. Das, V. G. Naik, A. A. Bhosle, V. P. Murali, K. K. Maiti, R. Acharya, M. Banerjee and A. Chatterjee, RSC Adv., 2021, 11, 21269–21278 RSC.
- S. Hu, J. Wang, M. Luo, Z. Wu, Y. Hou and X. Chen, Anal. Bioanal. Chem., 2021, 413, 5463–5468 CrossRef CAS PubMed.
- A. Karawek, P. Mayurachayakul, T. Santiwat, M. Sukwattanasinitt and N. Niamnont, J. Photochem. Photobiol., A, 2021, 404, 112879 CrossRef CAS.
- L. Xiao, J. Tu, S. Sun, Z. Pei, Y. Pei, Y. Pang and Y. Xu, RSC Adv., 2014, 4, 41807–41811 RSC.
- R. Chen, G.-J. Shi, J.-J. Wang, H.-F. Qin, Q. Zhang, S. Chen, Y. Wen, J.-B. Guo, K.-P. Wang and Z. Q. Hu, Spectrochim. Acta, Part A, 2021, 252, 119510 CrossRef CAS PubMed.
- J. T. Hou, B. Wang, S. Wang, Y. Wu, Y.-X. Liao and W. X. Ren, Dyes Pigm., 2020, 178, 108366 Search PubMed.
- J. Huang, Y. Zhou, W. Wang, J. Zhu, X. Li, M. Fang, Z. Wu, W. Zhu and C. Li, Spectrochim. Acta, Part A, 2023, 286, 122011 Search PubMed.
- A. V. Kulinich, E. K. Mikitenko and A. A. Ishchenko, Spectrochim. Acta, Part A, 2017, 171, 317–324 CrossRef CAS PubMed.
- Z. Yang, T. Zhong, B. Cao, D. Liao, X. Hu, S. Zhao and J. Qin, Mater. Today Chem., 2024, 35, 101890 Search PubMed.
- B. W. Davis, N. Niamnont, C. D. Hare, M. Sukwattanasinitt and Q. Cheng, ACS Appl. Mater. Interfaces, 2010, 2, 1798–1803 CrossRef CAS PubMed.
- B. W. Davis, N. Niamnont, R. Dillon, C. J. Bardeen, M. Sukwattanasinitt and Q. Cheng, Langmuir, 2011, 27, 6401–6408 CrossRef CAS PubMed.
- T. Santiwat, N. Sornkaew, K. Srikittiwanna, M. Sukwattanasinitt and N. Niamnont, J. Photochem. Photobiol., A, 2023, 434, 114258 CrossRef CAS.
- W. Rongthong, N. Niamnont, C. Srisuwannaket, N. Paradee and W. Mingvanish, J. Pharm. Sci., 2021, 110, 2405–2415 CrossRef CAS PubMed.
- C. M. Chiu, J. Nootem, T. Santiwat, C. Srisuwannaket, K. Pratumyot, W. C. Lin, W. Mingvanish and N. Niamnont, Fibers, 2019, 7, 76 CrossRef CAS.
- Y. Long, H. Chen, Y. Yang, H. Wang, Y. Yang, N. Li, K. Li, J. Pei and F. Liu, Macromolecules, 2009, 42, 6501–6509 CrossRef CAS.
- Y. Yang, H. Wang, K. Su, Y. Long, Z. Peng, N. Li and F. Liu, J. Mater. Chem., 2011, 21, 11895–11900 Search PubMed.
- M. Wang, G. Meng, Q. Huang and Y. Qian, Environ. Sci. Technol., 2012, 46, 367–373 CrossRef CAS PubMed.
- J. Nootem, P. Chalorak, K. Meemon, W. Mingvanish, K. Pratumyot, L. Ruckthong, C. Srisuwannaket and N. Niamnont, RSC Adv., 2018, 8, 37151–37158 Search PubMed.
- Z. Xu, Y. Luo, X. Yang, Y. Ren, G. Liu and M. X. Zhang, J. Photochem. Photobiol., A, 2023, 444, 115002 CrossRef CAS.
- A. D. Becke, J. Chem. Phys., 1993, 98, 5648–5652 CrossRef CAS.
- J. Tirado-Rives and W. L. Jorgensen, J. Chem. Theory Comput., 2008, 4, 297–306 CrossRef CAS PubMed.
- M. J. Frisch, G. W. Trucks, H. B. Schlegel, G. E. Scuseria, M. A. Robb, J. R. Cheeseman, G. Scalmani, V. Barone, B. Mennucci, G. A. Petersson, H. Nakatsuji, M. Caricato, X. Li, H. P. Hratchian, A. F. Izmaylov, J. Bloino, G. Zheng, J. L. Sonnenberg, M. Hada, M. Ehara, K. Toyota, R. Fukuda, J. Hasegawa, M. Ishida, T. Nakajima, Y. Honda, O. Kitao, H. Nakai, T. Vreven, J. A. Montgomery Jr, J. E. Peralta, F. Ogliaro, M. Bearpark, J. J. Heyd, E. Brothers, K. N. Kudin, V. N. Staroverov, T. Keith, R. Kobayashi, J. Normand, K. Raghavachari, A. Rendell, J. C. Burant, S. S. Iyengar, J. Tomasi, M. Cossi, N. Rega, J. M. Millam, M. Klene, J. E. Knox, J. B. Cross, V. Bakken, C. Adamo, J. Jaramillo, R. Gomperts, R. E. Stratmann, O. Yazyev, A. J. Austin, R. Cammi, C. Pomelli, J. W. Ochterski, R. L. Martin, K. Morokuma, V. G. Zakrzewski, G. A. Voth, P. Salvador, J. J. Dannenberg, S. Dapprich, A. D. Daniels, O. Farkas, J. B. Foresman, J. V. Ortiz, J. Cioslowski and D. J. Fox, Gaussian 09, Revision D.01, Gaussian, Inc., Wallingford CT, 2013 Search PubMed.
- C. Duangkamol, P. Muangsopa, S. Rattanopas, P. Wongsuwan, T. Khrootkaew, P. Chueakwon, N. Niamnont, K. Chansaenpak and A. Kamkaew, Dyes Pigm., 2023, 216, 111365 CrossRef CAS.
- X. Jiang, M. Shangguan, Z. Lu, S. Yi, X. Zeng, Y. Zhang and L. Hou, Tetrahedron, 2020, 76, 130921 CrossRef CAS.
- Y. Hao, Y. Zhang, K. Ruan, W. Chen, B. Zhou, X. Tan, Y. Wang, L. Zhao, G. Zhang, P. Qu and M. Xu, Sens. Actuators, B, 2017, 244, 417–424 CrossRef CAS.
- R. Zhang, C.-J. Zhang, Z. Song, J. Liang, R. T. K. Kwok, B. Z. Tang and B. Liu, J. Mater. Chem. C, 2016, 4, 2834–2842 Search PubMed.
- L. Xiao, J. Tu, S. Sun, Z. Pei, Y. Pei, Y. Pang and Y. Xu, RSC Adv., 2014, 4, 41807–41811 RSC.
- L. Cui, C. Ji, Z. Peng, L. Zhong, C. Zhou, L. Yan, S. Qu, S. Zhang, C. Huang, X. Qian and Y. Xu, Anal. Chem., 2014, 86, 4611–4617 CrossRef CAS PubMed.
- C. Zeng, Z. Xu, C. Song, T. Qin, T. Jia, C. Zhao, L. Wang, B. Liu and X. Peng, J. Hazard. Mater., 2023, 445, 130415 Search PubMed.
- P. Mayurachayakul, J. Thianchai, N. Attakul, K. Pratumyot, M. Sukwattanasinitt, K. Srikittiwanna and N. Niamnont, New J. Chem., 2024, 48, 16095–16106 Search PubMed.
Footnote |
| † Electronic supplementary information (ESI) available. See DOI: https://doi.org/10.1039/d4ra06129b |
| This journal is © The Royal Society of Chemistry 2024 |

