DOI:
10.1039/D4RA06299J
(Paper)
RSC Adv., 2024,
14, 34868-34882
LC-MS/MS characterization of pirtobrutinib impurities and product degradation: stability studies
Received
31st August 2024
, Accepted 14th October 2024
First published on 1st November 2024
Abstract
This study examined the fragmentation, degradation pathways and DPs of pirtobrutinib, which have not been previously reported in the literature. The main goal of the current work is to develop, validate, and characterize forced degradation products using LC-MS/MS. An isocratic HPLC methodology was developed for the quantitative measurement of pirtobrutinib at a λmax of 219 nm. The procedure used was straightforward, well defined, proven, and selective. The samples were subjected to isocratic elution using an Agilent Eclipse C18 column (150 × 4.6 mm, 3.5 μ). The mobile phase was supplied at a flow rate of 1.0 mL per minute in a 30![[thin space (1/6-em)]](https://www.rsc.org/images/entities/char_2009.gif) :
:![[thin space (1/6-em)]](https://www.rsc.org/images/entities/char_2009.gif) 70 v/v ratio, containing 0.1% formic acid and acetonitrile. A linear response was observed within the 0.0–150 μg mL−1 concentration range. It was found that the limits of quantitation and detection for pirtobrutinib were 0.1 and 0.3, respectively. The method was assessed for system suitability, linearity, precision, accuracy, and robustness in accordance with standard ICH guidelines. It was found that the results were within acceptable limits. A variety of stress conditions, such as acids, alkalis, hydrolysis, oxidation, reduction as well as photo- and thermal degradations, were applied to the drug to test the method's efficiency and stability. Acidic, alkaline, peroxide, and reduction conditions showed significant degradation. Degradation products produced during the forced degradation studies were analyzed and characterized using mass spectrometry (MS/MS). Thus, the proposed method can also be used for the quantitation of pirtobrutinib in the presence of its degradation products.
70 v/v ratio, containing 0.1% formic acid and acetonitrile. A linear response was observed within the 0.0–150 μg mL−1 concentration range. It was found that the limits of quantitation and detection for pirtobrutinib were 0.1 and 0.3, respectively. The method was assessed for system suitability, linearity, precision, accuracy, and robustness in accordance with standard ICH guidelines. It was found that the results were within acceptable limits. A variety of stress conditions, such as acids, alkalis, hydrolysis, oxidation, reduction as well as photo- and thermal degradations, were applied to the drug to test the method's efficiency and stability. Acidic, alkaline, peroxide, and reduction conditions showed significant degradation. Degradation products produced during the forced degradation studies were analyzed and characterized using mass spectrometry (MS/MS). Thus, the proposed method can also be used for the quantitation of pirtobrutinib in the presence of its degradation products.
1 Introduction
The anticancer drug pirtobrutinib is applied to mantle cell lymphoma; it is marketed under the brand name Jaypirca. It inhibits the ability of B cell lymphocytes to multiply and survive by blocking Bruton's tyrosine kinase (BTK).1 The medical use of pirtobrutinib was approved by the US FDA in January 2023 (ref. 2–4) and by the European Union in November 2023.5,6 The most frequent adverse effects include fatigue, bruising, edema, dyspnea, diarrhea, and musculoskeletal pain.7 The most frequent adverse effects of this medication for treating mild or chronic lymphocytic leukemia are bruises, exhaustion, coughing, musculoskeletal pain, COVID-19, diarrhea, pneumonia, stomach pain, dyspnea, bleeding, edema, nausea, pyrexia, and headaches.8–11 B cells, a subtype of lymphocytes are white blood cells responsible for producing antibodies. Cancer may result from abandoned progression of B cells. The enzyme known as BTK is essential for the survival and proliferation of B cells. Unlike the traditional BTK inhibitor ibrutinib, pirtobrutinib inhibits BTK using a different mode of action and blocking a genetic alteration (transformation at BTK's active site cysteine residue C481) that may decrease the susceptibility of some cancers to ibrutinib.12 The USA Food and Drug Administration (FDA) expanded the list of diseases for which pirtobrutinib was approved in December 2023 to include adults with chronic lymphocytic leukemia.13 The USA FDA approved the treatment of mantle cell lymphoma, which has grown resistant to traditional BTK inhibitors, with pirtobrutinib, which is produced by Eli Lilly and Company, in January 2023.14
Pirtobrutinib is a tiny compound that inhibits BTK in a highly selective non-covalent mode. Owing to its great selectivity, atrial fibrillation incidence has been linked to a decreased risk of discontinuation due to adverse functions.15 The cysteine 481 (Cys 481) amino acid is where imatinib and other BTK covalent inhibitors interact within the active region of BTK; however, pirtobrutinib's inhibitory action is unaffected by Cys 481 mutations. Although the exact mechanisms of resistance to covalent BTK inhibitors remain unknown, Cys 481 mutations appear to be the most common source of resistance.16–19 Fig. 1 shows that pirtobrutinib is chemically 5-amino-3-[4-[[(5-fluoro-2-methoxybenzoyl)amino]methyl]phenyl]-1-[(2S)-1,1,1-trifluoropropan-2-yl]pyrazole-4-carboxamide.
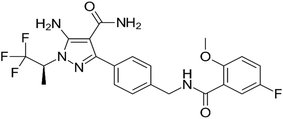 |
| | Fig. 1 Structure of pirtobrutinib. | |
Based on the thorough literature survey, it is found that no analytical methods are available for pirtobrutinib determination in the literature. Consequently, efforts were made to develop and validate a stability indicating RP-HPLC and LC-MS/MS characterization of the products of pirtobrutinib-forced degradation. Hence, this is the first analytical method developed for the determination of pirtobrutinib (PTB) drugs.
2 Materials and methods
2.1 Chemicals and reagents
We purchased formic acid, water (Milli Q or equivalent), and HPLC-grade acetonitrile from Merck, INDIA Ltd, Mumbai, INDIA. Anglo French Drug & Industries Ltd, Bangalore, India provided pharmaceutical quality pirtobrutinib (purity 98.9%) as a gift sample, which was used exactly as sent. Local markets were used for purchasing pharmaceutical formulations of pirtobrutinib, such as the 50 mg Jaypirca® tablets manufactured by Eli Lilly & Company.
2.2 Instrumentation
The chromatography procedure was conducted using a SCIEX QTRAP 5500 mass spectrometer in combination with a water 2695 HPLC system. The HPLC system was equipped with a high-speed autosampler, a column oven, and a degasser. Software Empower-2 is a powerful software application used for data analysis. Chromatographic separation of pirtobrutinib is carried out using an Agilent Eclipse C18 (150 × 4.6 mm, 3.5μ) in isocratic mode at room temperature. A 30![[thin space (1/6-em)]](https://www.rsc.org/images/entities/char_2009.gif) :
:![[thin space (1/6-em)]](https://www.rsc.org/images/entities/char_2009.gif) 70 ratio of acetonitrile to 0.1% formic acid was used as the mobile phase. Ten microliters of eluent were injected, and the run time was fixed for five minutes at 219 nm.
70 ratio of acetonitrile to 0.1% formic acid was used as the mobile phase. Ten microliters of eluent were injected, and the run time was fixed for five minutes at 219 nm.
2.3 Selection of analytical wavelength
Spectra of pirtobrutinib solution (25 μg mL−1) were obtained using a double beam UV-visible spectrophotometer (Shimadzu UV-1800).
2.4 Preparation of analytical solution
The working standard was prepared by weighing about 100 mg of pirtobrutinib, then it was transferred into a 100 mL cleaned, dry volumetric flask, and the mobile phase was added. After the working standard was sonicated to completely dissolve the PTB, the volume was increased using the same solvent to the desired level (Stock solution). After that, a 0.45-micron injection filter was used to filter it. Additionally, 5 mL of the aforementioned stock solutions were added to a 25 mL volumetric flask. These solutions were then diluted with diluent to the appropriate concentration (200 ppm of pirtobrutinib).
2.5 Preparation of sample solution
After precisely weighing 50 mg of finely ground tablets, they were added to a 250 mL volumetric flask. After adding 20 milliliters of the mobile phase Acetonitrile: 0.1% formic acid (30![[thin space (1/6-em)]](https://www.rsc.org/images/entities/char_2009.gif) :
:![[thin space (1/6-em)]](https://www.rsc.org/images/entities/char_2009.gif) 70 v/v) and sonicating the mixture, the volume was diluted with mobile phase to attain a concentration of 200 micrograms per milliliter. Before being injected into the HPLC system, the samples were filtered through a 0.45 μm membrane filter, and working solutions were made as required by diluting them with the same solvent.
70 v/v) and sonicating the mixture, the volume was diluted with mobile phase to attain a concentration of 200 micrograms per milliliter. Before being injected into the HPLC system, the samples were filtered through a 0.45 μm membrane filter, and working solutions were made as required by diluting them with the same solvent.
2.6 Specificity and forced degradation
The ability of the technique to quantify the analyte (PTB) response unambiguously in the presence of possible contaminants is known as specificity. In the presence of contaminants associated with the PTB process, the specificity of the devised LC technique was evaluated. To confirm this, chromatograms of the blank and standards spiked with the pirtobrutinib sample were inspected. In addition to assisting in determining the intrinsic stability of the molecule and the routes leading to degradation, investigations using forced degradation can be used to find potential drug candidates (DPs).
2.6.1 Acid degradation. 1 mL of the pirtobrutinib stock solution and one ml of 1 N HCl were added to a 10 mL volumetric flask, which was then allowed to stand at room temperature for thirty minutes. Finally, diluent was added until it reached the desired volume. The solution was injected into the HPLC apparatus.
2.6.2 Alkali degradation. The stock solution of 1 mL was mixed with one milliliter of 1 N NaOH and allowed to stand at room temperature for 30 minutes. The mixture was then diluted to volume using the diluent to obtain 10 mL of pirtobrutinib. The solution was injected into the HPLC system.
2.6.3 Peroxide degradation. 1 mL of pirtobrutinib stock solution was taken, and 1 mL of 10% H2O2 was added to it and allowed to stay at room temperature for 30 minutes. Then, the volume was further diluted with diluent in a 10 mL volumetric flask. The solution was injected into the HPLC system.
2.6.4 Reduction degradation. In a 10 mL volumetric flask, 1 mL of a 10% sodium bisulfite solution was added to 1 milliliter of pirtobrutinib stock solution. After that, the combination was allowed to stand for half an hour at room temperature before being diluted with diluent. The solution was injected into the HPLC system.
2.6.5 Hydrolysis degradation. 1 mL of the pirtobrutinib stock solution was taken in a 10 mL volumetric flask. Then, 1 mL of water was added and allowed to stand at room temperature for 30 minutes. Finally, the volume was further diluted with diluent. Then, the solution was injected into the HPLC system.
2.6.6 Thermal degradation. After being exposed to 150 mg of pirtobrutinib standard for six hours at 105 °C, the exposed standard was examined. From this exposed standard accurately weighed and transferred 100 mg of the sample after adding 70 mL of diluents and sonicating for 20 minutes, the pirtobrutinib exposed standard was placed into a 100 mL volumetric flask. The sample was then diluted to volume using a diluent. Diluents were used to further dilute it from 5 mL to 50 mL. The solution was injected into the HPLC system.
2.6.7 Photo degradation. 1 milliliter of the pirtobrutinib stock solution was transferred into a 10 milliliter volumetric flask and exposed to sunlight for six hours. Then, diluents were used to dilute it to a volume of 10 mL. This solution was injected into the HPLC system.
2.7 Method validation
According to ICH Q2 guidelines, the developed methodology was validated in terms of linearity, robustness, system suitability, method accuracy, specificity, intermediate precision, LOD, LOQ, and durability of forced degradation.
2.7.1 System suitability. System suitability parameters were computed to assess the system's performance. The USP plate count, USP tailing, and percentage RSD are among the parameters that can be calculated and found to be within the limit. Throughout the validation studies, the system suitability tests were carried out by injecting 100 mg of PTB solution, which contained 34.8 mg of all related substances.
2.7.2 Specificity. The ability to make an accurate assessment in the presence of an analyte, other contaminants, and substances, such as expedients possibly present in the sample and standard solution, is known as specificity. Chromatograms of the blank and pirtobrutinib-spiked standards were examined to verify this.
2.7.3 LOD and LOQ. The LOD and LOQ were found to be 3.3 σ/s and 10 σ/s, respectively, in accordance with ICH guidelines Q1. The LOD and LOQ values for PTB and its associated substances were determined using signal-to-noise ratios.
2.7.4 Linearity. An analytical method is said to be linear if the results it produces are directly correlated with the concentration of the analytes. By analysing a series of diluted solutions at various concentrations of the seven-standard solution, the linearity of the related substance method was established. Seven standard solution series were chosen to evaluate the linearity range.
2.7.5 Accuracy. How closely the test result matches the true value is known as accuracy. Three different concentration levels (low, medium, and high) were evaluated in triplicate to assess the PTB assay's accuracy. The accuracy of the related substance method was assessed by quantifying the impurities at known levels in the test sample, analyzing the results, and calculating the percentage recovered. At three different concentration levels 50, 100 and 150 μg mL−1, the recovery studies were conducted in triplicate for the pirtobrutinib sample.
2.7.6 Robustness. Analytical processes are considered robust when they can tolerate intentional but small adjustments to the method's parameters, showing their reliability under specific operating conditions. The robustness experiments involved injecting the standard solution into the HPLC system and altering the chromatographic parameters, including the organic phase (±10 percent) and flow rate (±0.2 mL min−1). Changes in the system suitability parameters, variations in the PTB assay, and impurity recoveries were evaluated. The components of the mobile phases remained constant in each of the previously altered experimental conditions.
2.7.7 Stability of solution and mobile phase. The PTB working solution's stability was determined by storing a sample solution at room temperature for 48 hours. After reanalyzing the sample solution for a full day, the assay was established and cross-checked against a new sample. The mobile phase study was demonstrated, and the RSD values of the peak areas were calculated by injecting the freshly prepared sample solution at different intervals (0, 12, and 24 hours).
3 Results and discussion
3.1 Method development and optimization of chromatographic conditions
To optimize the RP-HPLC system, an Agilent Eclipse C18 (150 × 4.6 mm, 3.5 μ) was initially used. It was found that a 30![[thin space (1/6-em)]](https://www.rsc.org/images/entities/char_2009.gif) :
:![[thin space (1/6-em)]](https://www.rsc.org/images/entities/char_2009.gif) 70 v/v ratio of acetonitrile to 0.1% formic acid was more appropriate for meeting system suitability requirements. Table 1 presents the optimized chromatographic conditions.
70 v/v ratio of acetonitrile to 0.1% formic acid was more appropriate for meeting system suitability requirements. Table 1 presents the optimized chromatographic conditions.
Table 1 Improved chromatographic situations
| Parameters |
Observation |
| Instrument used |
Waters alliance e-2695 HPLC |
| Injection volume |
10 μL |
| Mobile phase |
Acetonitrile: 0.1% formic acid (30![[thin space (1/6-em)]](https://www.rsc.org/images/entities/char_2009.gif) : :![[thin space (1/6-em)]](https://www.rsc.org/images/entities/char_2009.gif) 70 v/v) 70 v/v) |
| Column |
Agilent eclipse C18 (150 × 4.6 mm, 3.5 μ) |
| Detection wavelength |
219 nm |
| Flow rate |
1.0 mL min−1 |
| Runtime |
5 min |
| Temperature |
Ambient (25 °C) |
| Mode of separation |
Isocratic mode |
3.2 System suitability
The HPLC system was stabilized for 60 minutes to obtain a stable baseline. To verify the system's suitability, six replicate injection mixtures comprising 50 μg mL−1 of pirtobrutinib were tested and evaluated. The parameters of the system suitability were evaluated from six replication injections. The system suitability and results from the HPLC system in use are illustrated in Table 2.
Table 2 System suitability parameters for pirtobrutinib
| Sl. no |
1 |
2 |
3 |
4 |
| Parameter |
Retention time |
Plate count |
Tailing factor |
Resolution |
| Pirtobrutinib |
2.679 |
4255 |
1.01 |
— |
3.3 Specificity
Pirtobrutinib had a retention time of 2.679 minutes. The method used was therefore considered specific, as shown in Fig. 2 and 3.
 |
| | Fig. 2 Chromatogram of blank. | |
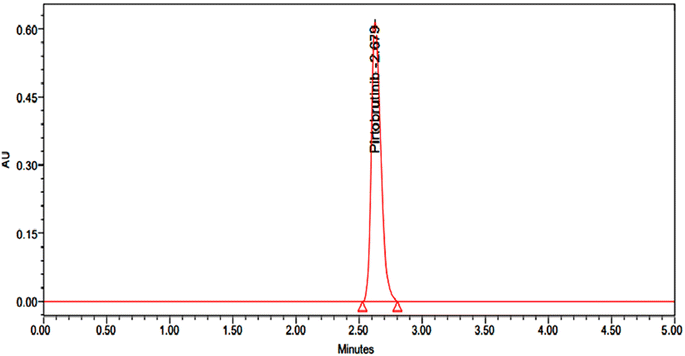 |
| | Fig. 3 Typical chromatogram of 50 μg mL−1 of pirtobrutinib. | |
3.4 Linearity
By preparing a series of linear solutions with pirtobrutinib at seven different concentrations, ranging from 0 to 150 μg mL−1, the linearity of the newly developed method was demonstrated. Throughout the pirtobrutinib concentration series, the calibration curves were linear. The correlation coefficient values of pirtobrutinib were 0.9999 from the calibration curve. Table 3 and Fig. 4 show the linearity values obtained.
Table 3 Results of linearity for pirtobrutiniba
| Sl. no. |
Pirtobrutinib |
| Conc. (μg mL−1) |
Peak area |
| y = mx + c, where ‘x’ is the concentration in μg mL−1 and ‘y’ is the area counts. |
| 1 |
0.00 |
0 |
| 2 |
25.00 |
834![[thin space (1/6-em)]](https://www.rsc.org/images/entities/char_2009.gif) 893 893 |
| 3 |
50.00 |
1![[thin space (1/6-em)]](https://www.rsc.org/images/entities/char_2009.gif) 669 669![[thin space (1/6-em)]](https://www.rsc.org/images/entities/char_2009.gif) 787 787 |
| 4 |
75.00 |
2![[thin space (1/6-em)]](https://www.rsc.org/images/entities/char_2009.gif) 504 504![[thin space (1/6-em)]](https://www.rsc.org/images/entities/char_2009.gif) 680 680 |
| 5 |
100.00 |
3![[thin space (1/6-em)]](https://www.rsc.org/images/entities/char_2009.gif) 336 336![[thin space (1/6-em)]](https://www.rsc.org/images/entities/char_2009.gif) 458 458 |
| 6 |
125.00 |
4![[thin space (1/6-em)]](https://www.rsc.org/images/entities/char_2009.gif) 156 156![[thin space (1/6-em)]](https://www.rsc.org/images/entities/char_2009.gif) 985 985 |
| 7 |
150.00 |
5![[thin space (1/6-em)]](https://www.rsc.org/images/entities/char_2009.gif) 009 009![[thin space (1/6-em)]](https://www.rsc.org/images/entities/char_2009.gif) 361 361 |
| Regression equation |
y = 333![[thin space (1/6-em)]](https://www.rsc.org/images/entities/char_2009.gif) 413.40x + 1137.21 413.40x + 1137.21 |
| Slope (m) |
333![[thin space (1/6-em)]](https://www.rsc.org/images/entities/char_2009.gif) 413.40 413.40 |
| Intercept (c) |
1137.21 |
| R2 |
0.99999 |
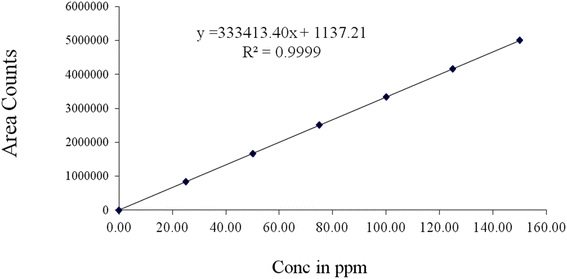 |
| | Fig. 4 Calibration curve for pirtobrutinib. | |
3.5 Accuracy
Recovery experiments, which were conducted at three distinct dilution levels (50, 100%, and 150%), determine pirtobrutinib accuracy. The assay was carried out, and the test solutions were injected as three preparations at each spike level in accordance with the test procedure. Table 4 and Fig. 5–7 show the results of recovery studies, which are within the range of 100–101.0%.
Table 4 Accuracy results of pirtobrutinib (n = 5) through HPLC technique
| Concentration (at specification level) |
Area |
Amount added (mg) |
Amount found (mg) |
% Recovery |
Mean% recovery |
| 50% |
1![[thin space (1/6-em)]](https://www.rsc.org/images/entities/char_2009.gif) 684 684![[thin space (1/6-em)]](https://www.rsc.org/images/entities/char_2009.gif) 579 579 |
50.00 |
5.03 |
100.8 |
100.83 |
1![[thin space (1/6-em)]](https://www.rsc.org/images/entities/char_2009.gif) 679 679![[thin space (1/6-em)]](https://www.rsc.org/images/entities/char_2009.gif) 845 845 |
50.00 |
5.02 |
100.6 |
1![[thin space (1/6-em)]](https://www.rsc.org/images/entities/char_2009.gif) 695 695![[thin space (1/6-em)]](https://www.rsc.org/images/entities/char_2009.gif) 483 483 |
50.00 |
5.07 |
101.1 |
| 100% |
3![[thin space (1/6-em)]](https://www.rsc.org/images/entities/char_2009.gif) 348 348![[thin space (1/6-em)]](https://www.rsc.org/images/entities/char_2009.gif) 458 458 |
100.00 |
10.1 |
100.2 |
100.3 |
3![[thin space (1/6-em)]](https://www.rsc.org/images/entities/char_2009.gif) 357 357![[thin space (1/6-em)]](https://www.rsc.org/images/entities/char_2009.gif) 376 376 |
100.00 |
10.04 |
100.4 |
3![[thin space (1/6-em)]](https://www.rsc.org/images/entities/char_2009.gif) 347 347![[thin space (1/6-em)]](https://www.rsc.org/images/entities/char_2009.gif) 302 302 |
100.00 |
10.03 |
100.1 |
| 150% |
5![[thin space (1/6-em)]](https://www.rsc.org/images/entities/char_2009.gif) 019 019![[thin space (1/6-em)]](https://www.rsc.org/images/entities/char_2009.gif) 771 771 |
150.00 |
15.04 |
100.3 |
100.9 |
5![[thin space (1/6-em)]](https://www.rsc.org/images/entities/char_2009.gif) 092 092![[thin space (1/6-em)]](https://www.rsc.org/images/entities/char_2009.gif) 322 322 |
150.00 |
15.21 |
101.2 |
5![[thin space (1/6-em)]](https://www.rsc.org/images/entities/char_2009.gif) 066 066![[thin space (1/6-em)]](https://www.rsc.org/images/entities/char_2009.gif) 740 740 |
150.00 |
15.18 |
101.2 |
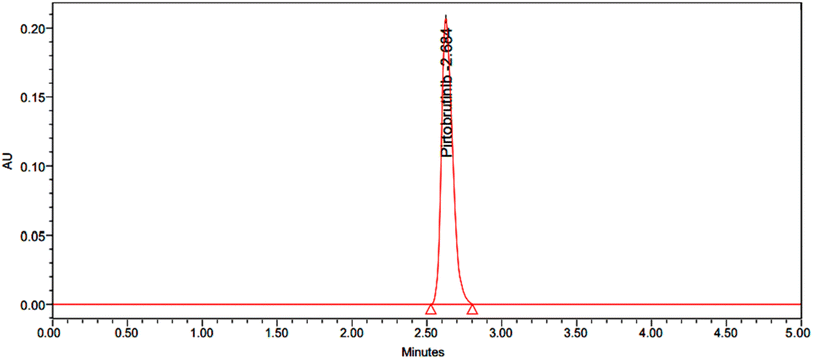 |
| | Fig. 5 Chromatogram with 50% accuracy. | |
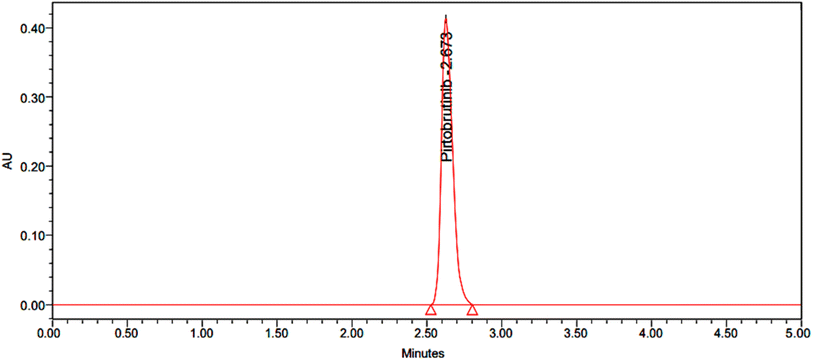 |
| | Fig. 6 Chromatogram with 100% accuracy. | |
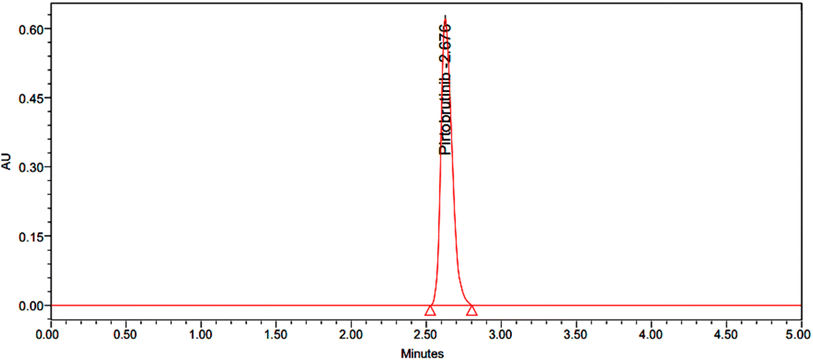 |
| | Fig. 7 Chromatogram with 150% accuracy. | |
3.6 System precision
To evaluate intra-day precision, six injections at three distinct levels (50, 100, and 150 μg mL−1) were administered on the same day (intra-day). The relative standard deviation (RSD) values were computed. To investigate inter-day variation (n = 3), the same methodology was used three times. Table 5 displays the results of the study. Six different test solutions were used to evaluate the method's precision.
Table 5 Results of the precision study (n = 3) using the proposed method
| Concentration of PTB injected in μg mL−1 |
Intra-day precision |
Inter-day precision |
| Mean area ± SD |
% RSD |
Mean area ± SD |
% RSD |
| 50 |
1![[thin space (1/6-em)]](https://www.rsc.org/images/entities/char_2009.gif) 679 679![[thin space (1/6-em)]](https://www.rsc.org/images/entities/char_2009.gif) 645 ± 31.04 645 ± 31.04 |
0.0362 |
1![[thin space (1/6-em)]](https://www.rsc.org/images/entities/char_2009.gif) 678 678![[thin space (1/6-em)]](https://www.rsc.org/images/entities/char_2009.gif) 785 ± 37.18 785 ± 37.18 |
0.0464 |
| 100 |
3![[thin space (1/6-em)]](https://www.rsc.org/images/entities/char_2009.gif) 368 368![[thin space (1/6-em)]](https://www.rsc.org/images/entities/char_2009.gif) 366 ± 51.05 366 ± 51.05 |
0.0352 |
3![[thin space (1/6-em)]](https://www.rsc.org/images/entities/char_2009.gif) 367 367![[thin space (1/6-em)]](https://www.rsc.org/images/entities/char_2009.gif) 455 ± 55.18 455 ± 55.18 |
0.0384 |
| 150 |
5![[thin space (1/6-em)]](https://www.rsc.org/images/entities/char_2009.gif) 053 053![[thin space (1/6-em)]](https://www.rsc.org/images/entities/char_2009.gif) 851 ± 96.01 851 ± 96.01 |
0.0331 |
5![[thin space (1/6-em)]](https://www.rsc.org/images/entities/char_2009.gif) 054 054![[thin space (1/6-em)]](https://www.rsc.org/images/entities/char_2009.gif) 962 ± 60.93 962 ± 60.93 |
0.0299 |
3.7 LOD and LOQ
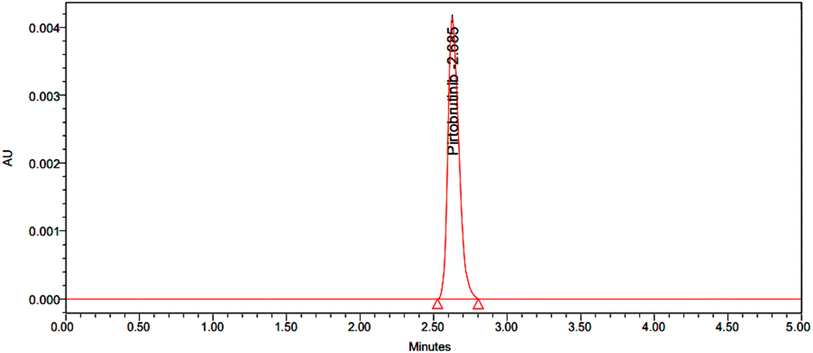
The calibration curve method was used to determine the LOD and LOQ independently. The developed HPLC method was then used to compute the LOD and LOQ of the compounds by continuously injecting reduced accumulations of standard solutions. Pirtobrutinib's LOD values were found to be 0.3 μg mL−1, and the LOQ values were 1 μg mL−1 (Fig. 8 and 9, respectively).
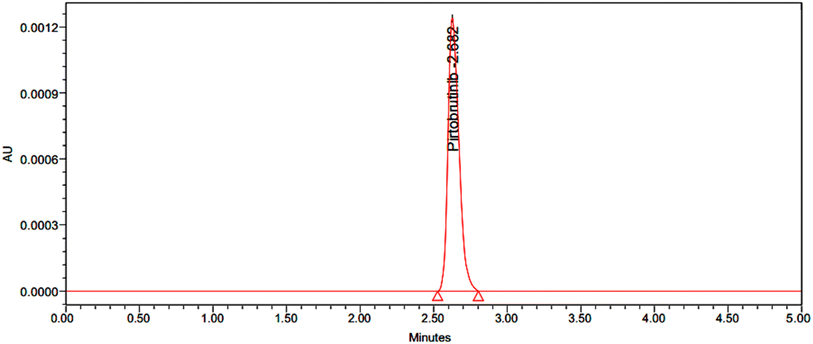 |
| | Fig. 8 Chromatogram for LOD. | |
 |
| | Fig. 9 Chromatogram for LOQ. | |
3.8 Robustness
In agreement with the ICH guidelines, slight yet deliberate modifications were employed to the method's parameters. For example, the flow rate (±0.2 mL min−1) and organic phase (±10%) were changed to verify the method's ability to remain unaffected. The results obtained are shown in Table 6.
Table 6 Results of robustness
| Condition |
Modification |
Mean peak area ± SD |
% RSD |
Mean Rt ± SD |
% RSD |
Mean theoretical plates ± SDa |
% RSD |
Meaning tailing factor ± SD |
% RSD |
| Mean value of three determinations. |
| Flow rate mL min−1 |
0.8 |
168![[thin space (1/6-em)]](https://www.rsc.org/images/entities/char_2009.gif) 589 ± 102.0 589 ± 102.0 |
0.69 |
2.579 ± 0.01 |
0.56 |
4215 ± 11 |
0.38 |
1.107 ± 0.003 |
0.35 |
| 1.0 |
1![[thin space (1/6-em)]](https://www.rsc.org/images/entities/char_2009.gif) 678 678![[thin space (1/6-em)]](https://www.rsc.org/images/entities/char_2009.gif) 855 ± 105.5 855 ± 105.5 |
0.55 |
2.678 ± 0.02 |
0.73 |
4265 ± 8 |
0.15 |
1.010 ± 0.002 |
0.32 |
| 1.2 |
1![[thin space (1/6-em)]](https://www.rsc.org/images/entities/char_2009.gif) 696 696![[thin space (1/6-em)]](https://www.rsc.org/images/entities/char_2009.gif) 493 ± 110.3 493 ± 110.3 |
0.71 |
2.766 ± 0.3 |
0.34 |
4098 ± 12 |
0.40 |
1.120 ± 0.001 |
0.29 |
| Organic phase |
27![[thin space (1/6-em)]](https://www.rsc.org/images/entities/char_2009.gif) : :![[thin space (1/6-em)]](https://www.rsc.org/images/entities/char_2009.gif) 73 73 |
1![[thin space (1/6-em)]](https://www.rsc.org/images/entities/char_2009.gif) 686 686![[thin space (1/6-em)]](https://www.rsc.org/images/entities/char_2009.gif) 589 ± 112.4 589 ± 112.4 |
0.27 |
2.589 ± 0.02 |
0.56 |
4067 ± 27 |
0.95 |
1.100 ± 0.005 |
0.27 |
30![[thin space (1/6-em)]](https://www.rsc.org/images/entities/char_2009.gif) : :![[thin space (1/6-em)]](https://www.rsc.org/images/entities/char_2009.gif) 70 70 |
1![[thin space (1/6-em)]](https://www.rsc.org/images/entities/char_2009.gif) 689 689![[thin space (1/6-em)]](https://www.rsc.org/images/entities/char_2009.gif) 734 ± 112.2 734 ± 112.2 |
0.33 |
2.688 ± 0.01 |
0.46 |
4219 ± 57 |
1.63 |
1.130 ± 0.006 |
0.31 |
33![[thin space (1/6-em)]](https://www.rsc.org/images/entities/char_2009.gif) : :![[thin space (1/6-em)]](https://www.rsc.org/images/entities/char_2009.gif) 67 67 |
1![[thin space (1/6-em)]](https://www.rsc.org/images/entities/char_2009.gif) 696 696![[thin space (1/6-em)]](https://www.rsc.org/images/entities/char_2009.gif) 394 ± 116.6 394 ± 116.6 |
0.75 |
2.776 ± 0.02 |
0.40 |
4437 ± 65 |
2.01 |
1.118 ± 0.003 |
0.60 |
3.9 Solution stability and mobile phase stability
Throughout the solution stability investigation, no appreciable shift in the chromatographic parameters was observed. During the solution stability and mobile phase stability studies, the PTB assay's RSD (%) results were within 1% at the specified time interval. Sample solution stability was determined by storing it for 24 hours at room temperature (25 °C). After 12 and 24 hours, the sample solution was examined again. The results of the assays for solution stability and mobile phase stability showed that both the drug standard solutions and the mobile phase solutions remained stable at room temperature for a maximum of 24 hours.
3.10 Forced degradation studies of pirtobrutinib
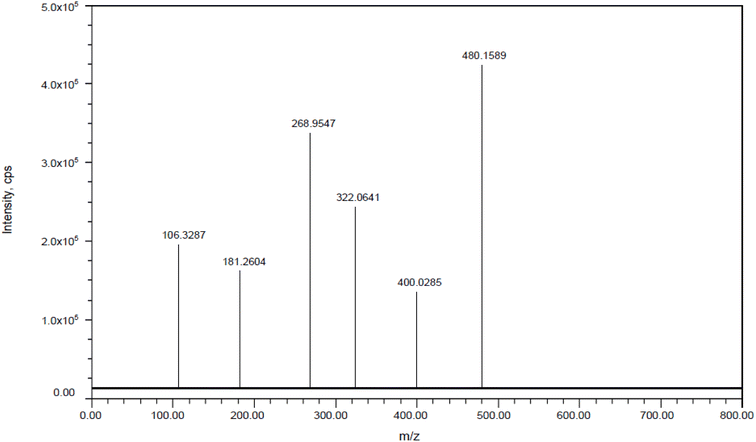
The proposed methodology can be considered a stability-indicating method used for stability studies through successful evaluations. In accordance with the ICH guidelines, a study on forced degradation, which includes acid, base, peroxide, reduction, heat, and hydrolysis degradation, was carried out. Even though degradation peaks could be identified in the chromatograms, it is clear that the drug was stable under some of the applied stress conditions. LC-MS was used to characterize the degradation samples (Table 7 and Fig. 10).
Table 7 Forced degradation results for pirtobrutinib
| Conditions |
Control |
Acid |
Alkali |
Peroxide |
Reduction |
Thermal |
Photolytic |
Hydrolysis |
| % Label claim |
0.1 |
12 |
13.2 |
14.4 |
10.5 |
3.6 |
3.1 |
1.5 |
| % Degradation |
99.9 |
87.9 |
86.7 |
85.5 |
89.4 |
96.3 |
96.8 |
98.4 |
 |
| | Fig. 10 Mass spectra of pirtobrutinib. | |
3.11 Characterization of degradation products and postulated degradation pathway
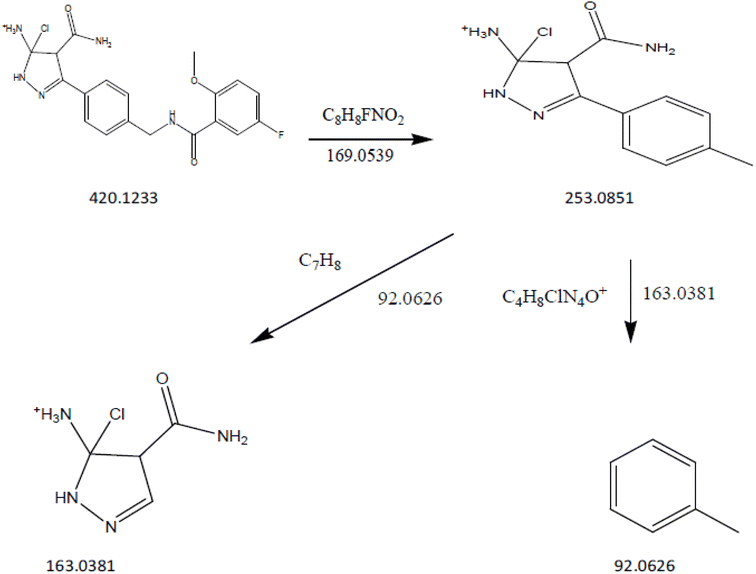
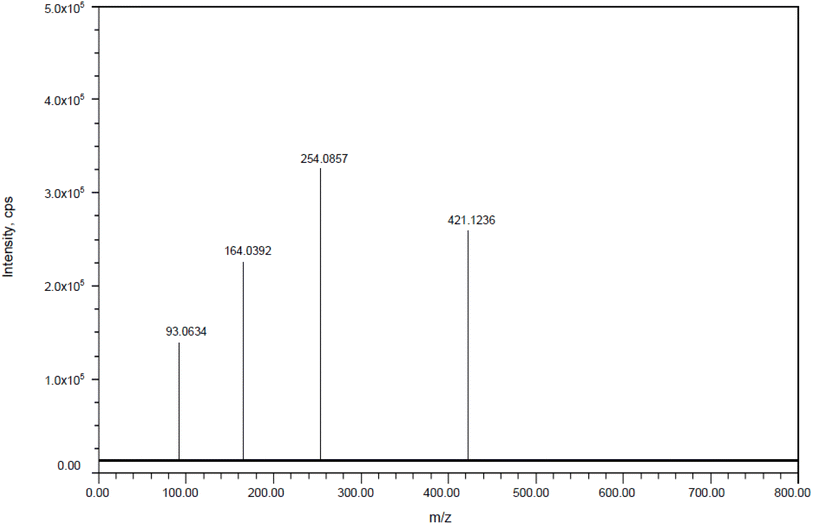
3.11.1 Collision-induced dissociation of pirtobrutinib. DP1: The fragmentation mechanism of DP1 is illustrated in Scheme 1, and the most intense [M + H]+ ion of m/z-420.1233 was detected under conditions of acid degradation in the ESI spectrum. DP1's MS/MS spectra showed abundant product ions at m/z-253.0851 (where C8H8FNO2 was lost from m/z-420.1233), m/z-92.0626 (where C4H8ClN4O+ was lost from m/z 253.0851), and m/z-163.0381 (where C7H8 was lost from m/z 253.0851), as shown in Fig. 11. The proposed scheme is validated by the MS/MS tests in conjunction with precise mass measurements.
 |
| | Scheme 1 Proposed fragmentation pathway of acid impurity (DP-1). | |
 |
| | Fig. 11 Mass spectra of acid impurity (DP-1). | |
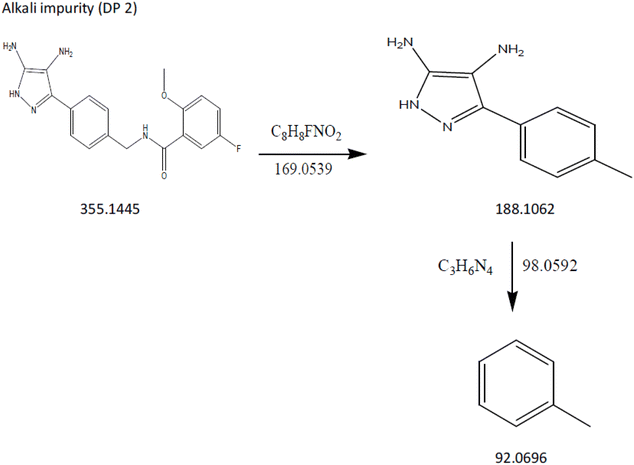
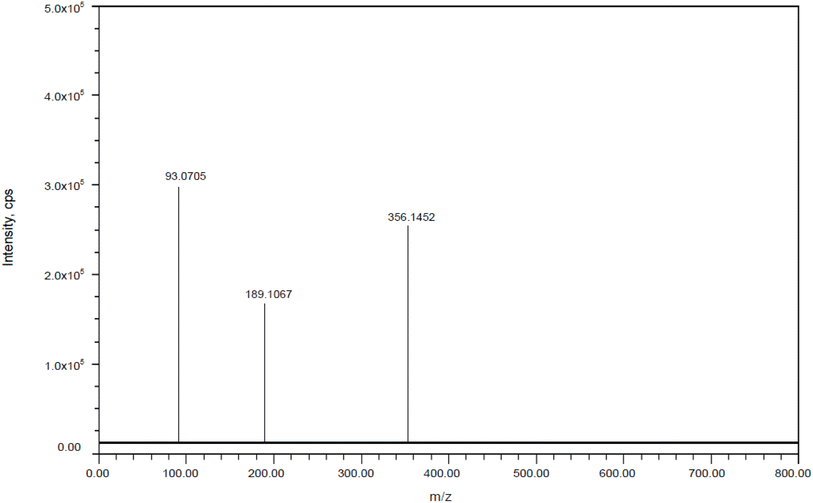
DP2: The ESI spectra revealed the most intense [M + H]+ ion of m/z-355.1445, which was detected under alkali degradation conditions. Scheme 2 illustrates the fragmentation mechanism of DP2. At m/z-188.1062 (loss of C8H8FNO2 from m/z-355.1445) and m/z-92.0696 (loss of C3H6N4 from m/z 188.1062), the MS/MS spectra of DP2 showed abundant product ions (Fig. 12). The proposed scheme is validated by the MS/MS tests in conjunction with precise mass measurements.
 |
| | Scheme 2 Fragmentation pathway of alkali impurity (DP-2). | |
 |
| | Fig. 12 Mass spectra of alkali impurity (DP-2). | |
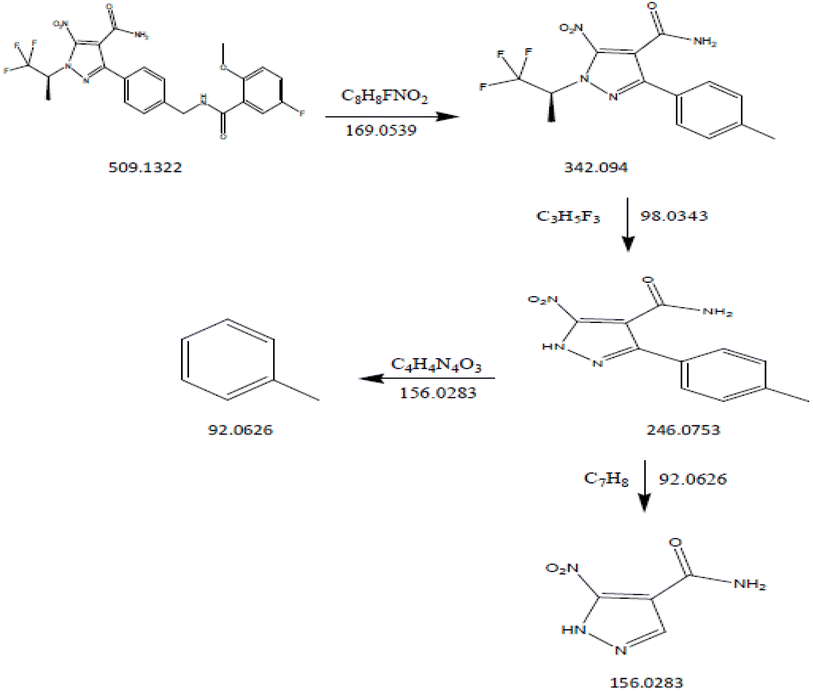
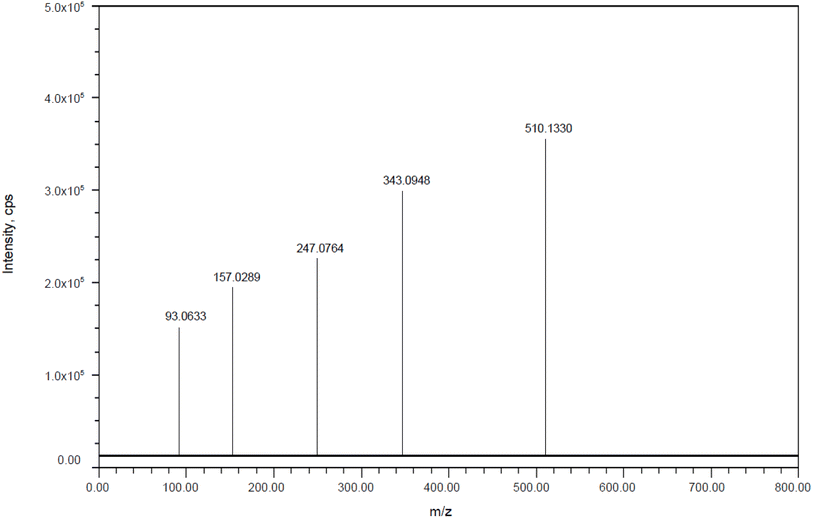
DP3: The fragmentation mechanism of DP3 is depicted in Scheme 3, and the most intense [M + H]+ ion of m/z-509.1322 was detected under the conditions of peroxide degradation in the ESI spectrum. Many product ions were observed in the DP3 MS/MS spectra at m/z-342.094 (where C8H8FNO2 was lost from m/z-509.1322), m/z-246.0753 (where C3H5F3 was lost from m/z 342.094), m/z-92.0626 (where C4H4N4O3 was lost from m/z 246.0753), and m/z-156.0283 (where C7H8 was lost from m/z 246.0753), as shown in Fig. 13. The proposed scheme was validated by the MS/MS tests in conjunction with precise mass measurements.
 |
| | Scheme 3 Fragmentation pathway of peroxide impurity (DP-3). | |
 |
| | Fig. 13 Mass Spectra of peroxide impurity (DP-3). | |
DP4: The fragmentation mechanism of DP4 is illustrated in Scheme 4. The most intense [M + H]+ ion of m/z-581.0968 was detected under the conditions of reduction degradation according to the ESI spectra. DP4's MS/MS spectra showed abundant product ions at m/z-414.0586 (loss of C8H8FNO2 from m/z-581.0968), m/z-318.0399 (loss of C3H5F3 from m/z 414.0586), m/z-92.0626 (loss of C4H5N4NaO4S from m/z 318.0399) and m/z-227.9929 (loss of C7H8 from m/z 318.0399), as shown in Fig. 14. The proposed scheme was validated by the MS/MS tests in conjunction with precise mass measurements Table 8.
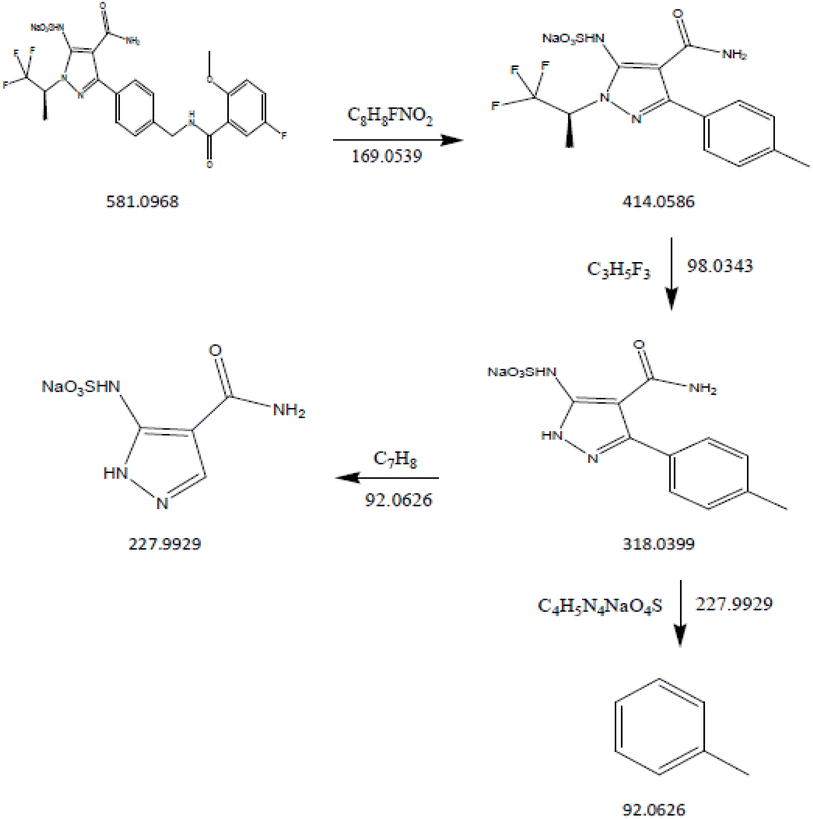 |
| | Scheme 4 Fragmentation pathway of thermal impurity (DP-4). | |
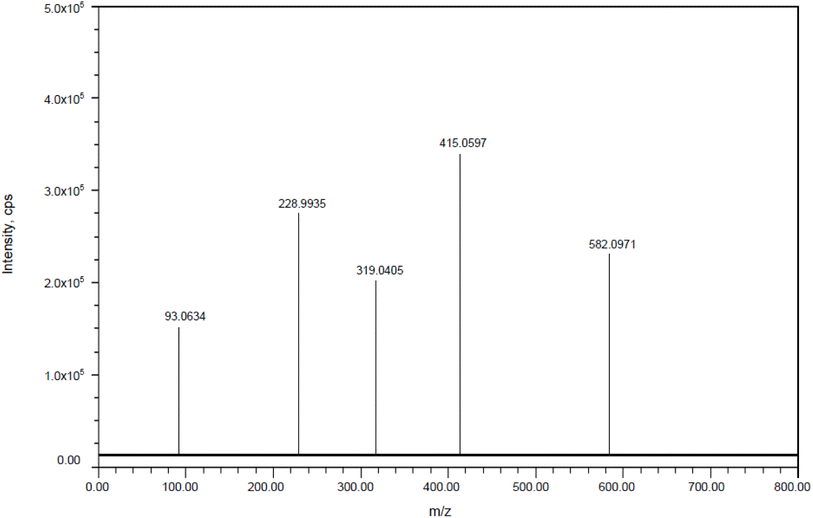 |
| | Fig. 14 Mass spectra of thermal impurity (DP-4). | |
Table 8 LC-MS/MS data of pirtobrutinib and its degradation products and some major fragments
| Pirtobrutinib |
Molecular formula |
Calculated mass |
Observed mass |
Error |
Major fragment ions |
| — |
C22H21F4N5O3 |
479.1581 |
479.1589 |
1.669595 |
105.3287, 180.2604, 267.9547, 321.0641, and 399.0285 |
| DP1 |
C19H20ClFN5O3+ |
420.1233 |
420.1236 |
0.714076 |
92.0634, 163.0392 and 253.0857 |
| DP2 |
C18H18FN5O2 |
355.1445 |
355.1452 |
1.971029 |
92.0705, and 188.10675 |
| DP3 |
C22H19F4N5O5 |
509.1322 |
509.1330 |
1.571301 |
96.0633, 156.0289, 246.0764, and 342.0948 |
| DP4 |
C22H20F4N5NaO6S |
581.0968 |
581.0971 |
0.516265 |
92.0634, 227.9935, 318.0405 and 414.0597 |
4 Conclusion
This is the first reported method for determining pirtobrutinib degradation pathways and their DPs. The present research findings offered details on the development and validation of a stability indicating RP-HPLC and LC-MS/MS characterization of pirtobrutinib's forced degradation products, which were found to be extremely selective, cost-effective, and specific. The degradation behaviour of pirtobrutinib was studied under various stress conditions, including acid, alkali, oxidation, reduction, hydrolysis, heat stress and photolysis, as per ICH guidelines Q1. It was found that the drug is stable under hydrolysis, photolysis, and thermal stress conditions but unstable under acidic, alkali, peroxide, and reduction conditions. Using exact mass measurements and LC-ESI-MS-MS studies, we were able to identify and characterize four DPs that were previously unknown. The developed method is a useful tool for assessing the quality of pirtobrutinib in samples and bulk because it is highly effective for separating drugs from potential degradants.
Data availability
The data that support the findings of this study are available from the corresponding author upon reasonable request.
Conflicts of interest
The authors declare that they have no known personal relationships or competing financial interests that could have appeared to impact the work described in this paper.
Acknowledgements
The authors extend their appreciation to BET®, University of Mysore and RIE (NCERT), Bhubaneswar for providing the necessary facilities to carry out the Research work. The authors would like to acknowledge the support provided by Researchers Supporting Project Number RSP2024R473, King Saud University, Riyadh, Saudi Arabia.
References
- FDA. 27 January 2023. Archived from the original on 28 January 2023.
- Eli Lilly. 27 January 2023. Archived from the original on 30 January 2023. Retrieved 31 January 2023 – via PR Newswire.
- S. J. Keam, Pirtobrutinib: First Approval, Drugs, 2023, 83(6), 547–553, DOI:10.1007/s40265-023-01860-1
 . PMID 37004673. S2CID 257912433. Archived from the original on 19 November 2023..
 - D. Telaraja, Y. L. Kasamon, J. S. Collazo, R. Leong, K. Wang, P. Li, E. Dahmane, Y. Yang, J. Earp, M. Grimstein, L. R. Rodriguez, M. R. Theoret and N. J. Gormley, FDA approval summary: Pirtobrutinib for relapsed or refractory mantle cell lymphoma, Clin. Cancer Res., 2023, 30, OF1–OF6, DOI:10.1158/1078-0432.CCR-23-1272
 .
. - U.S. Food and Drug Administration (FDA). 1 December 2023. Archived from the original on 3 December 2023.
- Jaypirca- Pirtobrutinib tablet, coated. Daily Med. 27 January 2023. Archived from the original on 11 February 2023.
- Jaypirca EPAR. European Medicines Agency (EMA). 20 November 2023. Archived from the original on 22 November 2023.
- Jaypirca Product information. Union Register of medicinal products. 31 October 2023. Archived from the original on 22 November 2023.
- FDA grants accelerated approval to pirtobrutinib for relapsed or refractory mantle cell lymphoma. FDA. 27 January 2023. Archived from the original on 28 January 2023.
- Public Domain This article incorporates text from this source, which is in the public domain.
- FDA grants accelerated approval to pirtobrutinib for chronic lymphocytic leukemia and small lymphocytic lymphoma. U.S. Food and Drug Administration (FDA). 1 December 2023. Archived from the original on 3 December 2023. Public Domain This article incorporates text from this source, which is in the public domain.
- U.S. FDA Approves Jaypirca (pirtobrutinib), the First and Only Non-Covalent (Reversible) BTK Inhibitor, for Adult Patients with Relapsed or Refractory Mantle Cell Lymphoma After At least Two Lines of Systemic Therapy, Including a BTK Inhibitor (Press release). Eli Lilly. 27 January 2023. Archived from the original on 30 January 2023. Retrieved 31 January 2023 – via PR Newswire.
- B. Aslan, G. Kismali, L. R. Iles, G. C. Manyam, M. L. Ayres, L. S. Chen, M. Gagea, M. T. S. Bertilaccio, W. G. Wierda and V. Gandhi, Pirtobrutinib inhibits wild-type and mutant Bruton's tyrosine kinase-mediated signaling in chronic lymphocytic leukemia, Blood Cancer J., 2022, 12(5), 80, DOI:10.1038/s41408-022-00675-9
 .
. - E. B. Gomez, K. Ebata, H. S. Randeria, M. S. Rosendahl, E. P. Cedervall, T. H. Morales, L. M. Hanson, N. E. Brown, X. Gong, J. Stephens, W. Wu, I. Lippincott, K. S. Ku, R. A. Walgren, P. B. Abada, J. A. Ballard, C. K. Allerston and B. J. Brandhuber, Preclinical characterization of pirtobrutinib, a highly selective, noncovalent (reversible) BTK inhibitor, Blood, 2023, 42(1), 62–72, DOI:10.1182/blood.2022018674
 .
. - International Conference on Harmonization, Validation of Analytical Procedures; Methodology, Federal Register, 1996, pp. 1–8 Search PubMed.
- J. L. Jensen, A. R. Mato, C. Pena, L. E. Roeker and C. C. Coombs, The potential of pirtobrutinib in multiple B-cell malignancies, Ther. Adv. Hematol., 2022, 13 DOI:10.1177/20406207221101697
 .
. - A. Alu, H. Lei, X. Han, Y. Wei and X. Wei, BTK inhibitors in the treatment of hematological malignancies and inflammatory diseases: mechanisms and clinical studies, J. Hematol. Oncol., 2022, 15(1), 138, DOI:10.1186/s13045-022-01353-w
 .
. - A. R. Mato, N. N. Shah, W. Jurczak, C. Y. Cheah, J. M. Pagel, J. A. Woyach, B. Fakhri, T. A. Eyre, N. Lamanna, M. R. Patel, A. Alencar, E. Lech-Maranda, W. G. Wierda, C. C. Coombs, J. N. Gerson, P. Ghia, S. Le Gouill, D. J. Lewis, S. Sundaram, J. B. Cohen, I. W. Flinn, C. S. Tam, M. A Barve, B. Kuss, J. Taylor, O. Abdel-Wahab, S. J. Schuster, M. L. Palomba, K. L. Lewis, L. E. Roeker, M. S. Davids, X. N. Tan, T. S. Fenske, J. Wallin, D. E. Tsai, N. C. Ku, E. Zhu, J. Chen, M. Yin, B. Nair, K. Ebata, N. Marella, J. R. Brown and M. Wang, Pirtobrutinib in relapsed or refractory B-cell malignancies (BRUIN): a phase 1/2 study, Lancet, 2021, 397, 892, DOI:10.1016/S0140-6736(21)00224-5
 .
. - E. Wang, X. Mi, M. C. Thompson, S. Montoya, R. Q. Notti, J. Afaghani, B. H. Durham, A. Penson, M. T. Witkowski, S. X. Lu, J. Bourcier, S. J. Hogg, C. Erickson, D. Cui, H. Cho, M. Singer, T. M. Totiger, S. Chaudhry, M. Geyer, A. Alencar, A. J. Linley, M. L. Palomba, C. C. Coombs, J. H. Park, A. Zelenetz, L. Roeker, M. Rosendahl, D. E. Tsai, K. Ebata, B. Brandhuber, D. M. Hyman, I. Aifantis, A. Mato, J. Taylor and O. Abdel-Wahab, Mechanisms of Resistance to Noncovalent Bruton's Tyrosine Kinase Inhibitors, N. Engl. J. Med., 2022, 386(8), 735, DOI:10.1056/NEJMoa2114110
 .
.
|
| This journal is © The Royal Society of Chemistry 2024 |
Click here to see how this site uses Cookies. View our privacy policy here.  Open Access Article
 *ab,
Hosakere D. Revanasiddappac,
Salah Jasim Mohammed
 d,
Hasan Sh. Majdi
 e,
Abdullah H. Alsabhanf and
Shareefraza J. Ukkund
 g
g
![[thin space (1/6-em)]](https://www.rsc.org/images/entities/char_2009.gif) :
:![[thin space (1/6-em)]](https://www.rsc.org/images/entities/char_2009.gif) 70 v/v ratio, containing 0.1% formic acid and acetonitrile. A linear response was observed within the 0.0–150 μg mL−1 concentration range. It was found that the limits of quantitation and detection for pirtobrutinib were 0.1 and 0.3, respectively. The method was assessed for system suitability, linearity, precision, accuracy, and robustness in accordance with standard ICH guidelines. It was found that the results were within acceptable limits. A variety of stress conditions, such as acids, alkalis, hydrolysis, oxidation, reduction as well as photo- and thermal degradations, were applied to the drug to test the method's efficiency and stability. Acidic, alkaline, peroxide, and reduction conditions showed significant degradation. Degradation products produced during the forced degradation studies were analyzed and characterized using mass spectrometry (MS/MS). Thus, the proposed method can also be used for the quantitation of pirtobrutinib in the presence of its degradation products.
70 v/v ratio, containing 0.1% formic acid and acetonitrile. A linear response was observed within the 0.0–150 μg mL−1 concentration range. It was found that the limits of quantitation and detection for pirtobrutinib were 0.1 and 0.3, respectively. The method was assessed for system suitability, linearity, precision, accuracy, and robustness in accordance with standard ICH guidelines. It was found that the results were within acceptable limits. A variety of stress conditions, such as acids, alkalis, hydrolysis, oxidation, reduction as well as photo- and thermal degradations, were applied to the drug to test the method's efficiency and stability. Acidic, alkaline, peroxide, and reduction conditions showed significant degradation. Degradation products produced during the forced degradation studies were analyzed and characterized using mass spectrometry (MS/MS). Thus, the proposed method can also be used for the quantitation of pirtobrutinib in the presence of its degradation products.![[thin space (1/6-em)]](https://www.rsc.org/images/entities/char_2009.gif) :
:![[thin space (1/6-em)]](https://www.rsc.org/images/entities/char_2009.gif) 70 ratio of acetonitrile to 0.1% formic acid was used as the mobile phase. Ten microliters of eluent were injected, and the run time was fixed for five minutes at 219 nm.
70 ratio of acetonitrile to 0.1% formic acid was used as the mobile phase. Ten microliters of eluent were injected, and the run time was fixed for five minutes at 219 nm.
![[thin space (1/6-em)]](https://www.rsc.org/images/entities/char_2009.gif) :
:![[thin space (1/6-em)]](https://www.rsc.org/images/entities/char_2009.gif) 70 v/v) and sonicating the mixture, the volume was diluted with mobile phase to attain a concentration of 200 micrograms per milliliter. Before being injected into the HPLC system, the samples were filtered through a 0.45 μm membrane filter, and working solutions were made as required by diluting them with the same solvent.
70 v/v) and sonicating the mixture, the volume was diluted with mobile phase to attain a concentration of 200 micrograms per milliliter. Before being injected into the HPLC system, the samples were filtered through a 0.45 μm membrane filter, and working solutions were made as required by diluting them with the same solvent.
![[thin space (1/6-em)]](https://www.rsc.org/images/entities/char_2009.gif) :
:![[thin space (1/6-em)]](https://www.rsc.org/images/entities/char_2009.gif) 70 v/v ratio of acetonitrile to 0.1% formic acid was more appropriate for meeting system suitability requirements. Table 1 presents the optimized chromatographic conditions.
70 v/v ratio of acetonitrile to 0.1% formic acid was more appropriate for meeting system suitability requirements. Table 1 presents the optimized chromatographic conditions.
![[thin space (1/6-em)]](https://www.rsc.org/images/entities/char_2009.gif) :
:![[thin space (1/6-em)]](https://www.rsc.org/images/entities/char_2009.gif) 70 v/v)
70 v/v)![[thin space (1/6-em)]](https://www.rsc.org/images/entities/char_2009.gif) 893
893![[thin space (1/6-em)]](https://www.rsc.org/images/entities/char_2009.gif) 669
669![[thin space (1/6-em)]](https://www.rsc.org/images/entities/char_2009.gif) 787
787![[thin space (1/6-em)]](https://www.rsc.org/images/entities/char_2009.gif) 504
504![[thin space (1/6-em)]](https://www.rsc.org/images/entities/char_2009.gif) 680
680![[thin space (1/6-em)]](https://www.rsc.org/images/entities/char_2009.gif) 336
336![[thin space (1/6-em)]](https://www.rsc.org/images/entities/char_2009.gif) 458
458![[thin space (1/6-em)]](https://www.rsc.org/images/entities/char_2009.gif) 156
156![[thin space (1/6-em)]](https://www.rsc.org/images/entities/char_2009.gif) 985
985![[thin space (1/6-em)]](https://www.rsc.org/images/entities/char_2009.gif) 009
009![[thin space (1/6-em)]](https://www.rsc.org/images/entities/char_2009.gif) 361
361![[thin space (1/6-em)]](https://www.rsc.org/images/entities/char_2009.gif) 413.40x + 1137.21
413.40x + 1137.21![[thin space (1/6-em)]](https://www.rsc.org/images/entities/char_2009.gif) 413.40
413.40![[thin space (1/6-em)]](https://www.rsc.org/images/entities/char_2009.gif) 684
684![[thin space (1/6-em)]](https://www.rsc.org/images/entities/char_2009.gif) 579
579![[thin space (1/6-em)]](https://www.rsc.org/images/entities/char_2009.gif) 679
679![[thin space (1/6-em)]](https://www.rsc.org/images/entities/char_2009.gif) 845
845![[thin space (1/6-em)]](https://www.rsc.org/images/entities/char_2009.gif) 695
695![[thin space (1/6-em)]](https://www.rsc.org/images/entities/char_2009.gif) 483
483![[thin space (1/6-em)]](https://www.rsc.org/images/entities/char_2009.gif) 348
348![[thin space (1/6-em)]](https://www.rsc.org/images/entities/char_2009.gif) 458
458![[thin space (1/6-em)]](https://www.rsc.org/images/entities/char_2009.gif) 357
357![[thin space (1/6-em)]](https://www.rsc.org/images/entities/char_2009.gif) 376
376![[thin space (1/6-em)]](https://www.rsc.org/images/entities/char_2009.gif) 347
347![[thin space (1/6-em)]](https://www.rsc.org/images/entities/char_2009.gif) 302
302![[thin space (1/6-em)]](https://www.rsc.org/images/entities/char_2009.gif) 019
019![[thin space (1/6-em)]](https://www.rsc.org/images/entities/char_2009.gif) 771
771![[thin space (1/6-em)]](https://www.rsc.org/images/entities/char_2009.gif) 092
092![[thin space (1/6-em)]](https://www.rsc.org/images/entities/char_2009.gif) 322
322![[thin space (1/6-em)]](https://www.rsc.org/images/entities/char_2009.gif) 066
066![[thin space (1/6-em)]](https://www.rsc.org/images/entities/char_2009.gif) 740
740![[thin space (1/6-em)]](https://www.rsc.org/images/entities/char_2009.gif) 679
679![[thin space (1/6-em)]](https://www.rsc.org/images/entities/char_2009.gif) 645 ± 31.04
645 ± 31.04![[thin space (1/6-em)]](https://www.rsc.org/images/entities/char_2009.gif) 678
678![[thin space (1/6-em)]](https://www.rsc.org/images/entities/char_2009.gif) 785 ± 37.18
785 ± 37.18![[thin space (1/6-em)]](https://www.rsc.org/images/entities/char_2009.gif) 368
368![[thin space (1/6-em)]](https://www.rsc.org/images/entities/char_2009.gif) 366 ± 51.05
366 ± 51.05![[thin space (1/6-em)]](https://www.rsc.org/images/entities/char_2009.gif) 367
367![[thin space (1/6-em)]](https://www.rsc.org/images/entities/char_2009.gif) 455 ± 55.18
455 ± 55.18![[thin space (1/6-em)]](https://www.rsc.org/images/entities/char_2009.gif) 053
053![[thin space (1/6-em)]](https://www.rsc.org/images/entities/char_2009.gif) 851 ± 96.01
851 ± 96.01![[thin space (1/6-em)]](https://www.rsc.org/images/entities/char_2009.gif) 054
054![[thin space (1/6-em)]](https://www.rsc.org/images/entities/char_2009.gif) 962 ± 60.93
962 ± 60.93![[thin space (1/6-em)]](https://www.rsc.org/images/entities/char_2009.gif) 589 ± 102.0
589 ± 102.0![[thin space (1/6-em)]](https://www.rsc.org/images/entities/char_2009.gif) 678
678![[thin space (1/6-em)]](https://www.rsc.org/images/entities/char_2009.gif) 855 ± 105.5
855 ± 105.5![[thin space (1/6-em)]](https://www.rsc.org/images/entities/char_2009.gif) 696
696![[thin space (1/6-em)]](https://www.rsc.org/images/entities/char_2009.gif) 493 ± 110.3
493 ± 110.3![[thin space (1/6-em)]](https://www.rsc.org/images/entities/char_2009.gif) :
:![[thin space (1/6-em)]](https://www.rsc.org/images/entities/char_2009.gif) 73
73![[thin space (1/6-em)]](https://www.rsc.org/images/entities/char_2009.gif) 686
686![[thin space (1/6-em)]](https://www.rsc.org/images/entities/char_2009.gif) 589 ± 112.4
589 ± 112.4![[thin space (1/6-em)]](https://www.rsc.org/images/entities/char_2009.gif) :
:![[thin space (1/6-em)]](https://www.rsc.org/images/entities/char_2009.gif) 70
70![[thin space (1/6-em)]](https://www.rsc.org/images/entities/char_2009.gif) 689
689![[thin space (1/6-em)]](https://www.rsc.org/images/entities/char_2009.gif) 734 ± 112.2
734 ± 112.2![[thin space (1/6-em)]](https://www.rsc.org/images/entities/char_2009.gif) :
:![[thin space (1/6-em)]](https://www.rsc.org/images/entities/char_2009.gif) 67
67![[thin space (1/6-em)]](https://www.rsc.org/images/entities/char_2009.gif) 696
696![[thin space (1/6-em)]](https://www.rsc.org/images/entities/char_2009.gif) 394 ± 116.6
394 ± 116.6. PMID 37004673. S2CID 257912433. Archived from the original on 19 November 2023..
.
.
.
.
.
.
.


