 Open Access Article
Creative Commons Attribution 3.0 Unported Licence
Ag–Co ferrite-based magnetic polymeric composite film: a breakthrough in cationic dye remediation for sustainable environment†
Nafisa Tabassuma,
Raamisa Anjuma,
Papia Haque*a,
Md. Sahadat Hossain b,
Mashrafi Bin Mobarak
 b,
Md. Saiful Quddus
 b,
Fariha Chowdhury
 c,
Lutfor Rahmanb,
Dipa Islamc,
Samina Ahmed
 *bd and
Monika Mahmud
 *b
*b
aDepartment of Applied Chemistry and Chemical Engineering, University of Dhaka, Dhaka-1000, Bangladesh. E-mail: papiahq@du.ac.bd
bInstitute of Glass and Ceramic Research and Testing (IGCRT), Bangladesh Council of Scientific and Industrial Research (BCSIR), Dr. Qudrat-i-Khuda Road, Dhanmondi, Dhaka-1205, Bangladesh. E-mail: shanta_samina@yahoo.com; monika0197@gmail.com
cBTRI, Bangladesh Council of Scientific and Industrial Research (BCSIR), Dr. Qudrat-i-Khuda Road, Dhanmondi, Dhaka-1205, Bangladesh
dBCSIR Laboratories Dhaka, Bangladesh Council of Scientific and Industrial Research (BCSIR), Dr. Qudrat-i-Khuda Road, Dhanmondi, Dhaka-1205, Bangladesh
First published on 15th November 2024
Abstract
The deployment of magnetically responsive and polymeric materials to remove dyes that are hazardous in aquatic environments has profoundly revolutionized environmental sustainability. This study focuses on removing the hazardous cationic Malachite Green (MG) dye from solutions, employing a novel magnetic composite film as an adsorbent, designated as Ag0.2Co0.8 Fe2O4 (ACFCeP). The composite was synthesized via solvent casting, incorporating Ag0.2Co0.8 Fe2O4 nanoparticles and CeO2 into a cellulose acetate/polyvinylpyrrolidone (CA/PVP) polymer matrix. The Ag0.2Co0.8Fe2O4 nanoparticles were synthesized by a co-precipitation method. Comprehensive characterization of the synthesized composite was conducted using techniques, such as Fourier transform infrared spectroscopy (FT-IR), X-ray diffraction (XRD), X-ray photoelectron spectroscopy (XPS), field emission scanning electron microscopy (FE-SEM), and vibrating sample magnetometer (VSM). The Ag-doped cobalt ferrite component retained a strong hysteresis loop within the final composite, even when blended with the CA/PVP polymer, preserving the robust magnetic properties that facilitate the easy removal of the composite post-treatment without secondary pollution. Additionally, the mesoporous structure of the composite effectively aids in the adsorption mechanism. The isothermal study shows that both linear Langmuir isotherm and Freundlich isotherm are well fitted with R2 values of 0.99 and 0.97, respectively. The linear Langmuir maximum adsorption capacity, qmax, is 45.66 mg g−1 at pH 7. The kinetic studies of the composite resemble the pseudo-second-order kinetic model, reaching adsorption equilibrium within 70 min for a 100 ppm MG dye concentration. The composite film exhibits excellent reusability, maintaining high removal efficiency over three cycles. Overall, the ACFCeP composite film showcases excellent dye removal capabilities, a fast adsorption rate, and satisfactory magnetic properties and offers a sustainable solution for environmental pollution, thus contributing to ecosystem preservation through efficient recycling and reuse in dye adsorption applications.
1 Introduction
In today's industrial landscape, dyes are ubiquitously harnessed across a diverse array of sectors—such as textiles, paper manufacturing, tanneries, plastics, paints, and agriculture—chiefly for their vibrant pigmentation attributes.1 This led to the development of 10![[thin space (1/6-em)]](https://www.rsc.org/images/entities/char_2009.gif) 000 different synthetic dyes and global annual synthetic dye production of 7 × 10⁵ tons, out of which the textile industries discharge 3600 tons of concentrated dye waste in the natural water resources.2 The persistent, non-biodegradable synthetic dyes are responsible for making the water unsuitable for drinking, while the demand for freshwater is expected to increase from the current 4500 billion cubic meters per year to 6900 billion cubic meters by 2030.2,3 Moreover, the presence of dyes significantly alters various aquatic environmental parameters like BOD and COD, causing damage to the aquatic food chain, photosynthesis and exerting detrimental effects on aquatic life.4–6 Additionally, dyes can cause a multitude of health issues, affecting the nervous system, skin, liver, kidneys, reproductive system, and enzymatic functions within the human body.6
000 different synthetic dyes and global annual synthetic dye production of 7 × 10⁵ tons, out of which the textile industries discharge 3600 tons of concentrated dye waste in the natural water resources.2 The persistent, non-biodegradable synthetic dyes are responsible for making the water unsuitable for drinking, while the demand for freshwater is expected to increase from the current 4500 billion cubic meters per year to 6900 billion cubic meters by 2030.2,3 Moreover, the presence of dyes significantly alters various aquatic environmental parameters like BOD and COD, causing damage to the aquatic food chain, photosynthesis and exerting detrimental effects on aquatic life.4–6 Additionally, dyes can cause a multitude of health issues, affecting the nervous system, skin, liver, kidneys, reproductive system, and enzymatic functions within the human body.6
Among synthetic dyes, Malachite green (MG) is extensively employed in aquaculture and other industries. Initially, it was effective as a parasiticide, fungicide, and antiprotozoan agent. However, subsequent research revealed that MG is highly toxic, with its toxicity escalating with increased temperature, time, and concentration.7 Consequently, treating wastewater containing MG dye is imperative to safeguard both aquatic and terrestrial life from its acute toxicity.
Several biological, physical and chemical methods exist for the treatment of wastewater, among which adsorption stands out as a physical process. It is highly effective, straightforward, cost-efficient, energy-conserving, and easy to operate.8 Ongoing research aims to develop superior, eco-friendly, and more efficient adsorbents for maximum dye removal. In pursuit of this goal, numerous composite adsorbents are being developed to combine the most beneficial properties into a single material.
Recently, magnetic nanoparticles, particularly spinel ferrite nanoparticles (MFe2O4; M can be Fe, Ni, Co, Mn, Zn, etc.), have gathered remarkable attention because of their high surface area, exceptional magnetic properties and active sites, resulting in enhanced adsorption capacity and broad applicability.9,10 Spinel ferrite (SF) has the chemical formula AB2O4, where A occupies the tetrahedral site (e.g., Pb, Mg, Cr, Mn) and B occupies the octahedral site (e.g., Fe, Al, Cu).11 The cations at both sites are connected to oxygen atoms tetrahedrally and octahedrally, respectively.9
Among the three types of spinel ferrites—normal, inverse, and mixed—CoFe2O4 is an inverse spinel ferrite. It is a significant SF as it is chemically stable and has intrinsic magnetic, electrical, and mechanical properties.12 Cobalt ferrite possesses a mesoporous structure with moderate saturation magnetization, making it suitable as both an adsorbent and a photocatalyst for pollutant removal.13–15 Studies have demonstrated that hydrothermally synthesized CoFe2O4 exhibits one of the highest adsorption capacities to remove Congo red dye from solutions.16,17 Post-adsorption, removing adsorbents from the solution is crucial to prevent further contamination. Conventional separation methods like filtration, sedimentation, or coagulation are laborious and expensive.18 In contrast, magnetic separation is simpler, more economical, and effective, as it uses an external magnetic field to remove the adsorbent from the effluent, ensuring no additional pollution in the treated water.
Recent advancements have seen techniques such as surface modification, metal ion doping and nanocomposite preparation to enhance the adsorption capacity of ferrite nanoparticles.19 Doping cobalt ferrite with various metals and non-metals has been shown to improve coercive force and specific surface area.20,21 Significant interest is placed on Ag nanoparticles due to their high conductive nature, good catalytic performance and wide range of antibacterial actions.22 Many works have proved the enhancement of the adsorption capacity for both cationic and anionic dyes after the addition of Ag nanoparticles to materials, including CoFe2O4.23–25
Moreover, as a rare earth metal oxide, cerium oxide is characterized by its cubic crystal structure and has demonstrated a remarkable ability to enhance dye adsorption capacity. This enhancement is attributed to its high surface area, affordability, water solubility, catalytic properties, and chemical reactivity.26–28 Thus, integrating cerium oxide into composite films can markedly boost their dye adsorption efficiency.
Other than the nanoparticles, natural polymers are gaining attention due to their biodegradability, non-toxicity, flexibility, and eco-friendliness.29 Cellulose acetate (CA) is one of these and has been found to have wide applicability as an adsorptive polymer matrix because of its biocompatibility, low cost, film-forming ability and simple preparation.30–32 It has been functionalized with different organic and inorganic materials and showed better performance in removing different dyes.33,34 A study has also reported the fabrication of ferrite in CA to adsorb methylene blue.35 The film formation ability of CA facilitates better adsorption by improving the surface area.32
Even synthetic polyvinylpyrrolidone (PVP), a non-ionic, biodegradable, non-toxic, hydrophilic polymer, is also known for its excellent film-forming properties.36–38 PVP binds with nanoparticles, preventing aggregation and providing stability and effectiveness.39–41 It also increases the dye adsorption capacity by creating a porous film.42
This research endeavors to engineer an innovative composite film that amalgamates Ag-doped cobalt ferrite, cerium oxide, cellulose acetate (CA), and polyvinylpyrrolidone (PVP). By proposing a heterostructured composite film, we aim to prevent the aggregation of powdered materials, thereby enhancing its efficacy. Comprehensive analyses, including XPS to observe the interactions and crosslinking, along with N2 gas adsorption–desorption for assessing the surface area and pore size, have been meticulously conducted. Furthermore, VSM was utilized to determine the magnetic responsiveness of the composite. Additionally, adsorption isotherms and kinetic models have been scrutinized to elucidate the adsorption method. Emphasizing the magnetic properties of cobalt ferrite, this study highlights its pivotal role in environmental pollution mitigation. The reusability of the composite across multiple cycles is also rigorously assessed, underscoring its potential for sustainable and eco-friendly applications in protecting our ecosystem.
2 Materials & methods
2.1 Materials
Ferric nitrate [Fe(NO3)3·9H2O], cobalt nitrate [Co(NO3)2·6H2O], silver nitrate (AgNO3) and sodium hydroxide (NaOH) were obtained from Merck, Germany. Hydrochloric acid (HCl), cellulose acetate, polyvinylpyrrolidone (PVP), cerium oxide (CeO2) and Malachite Green were purchased from Sigma-Aldrich. Acetone and N,N-dimethylformamide (DMF) were also purchased from Sigma-Aldrich to prepare the cellulose acetate and PVP solutions.2.2 Methods
| Co(NO3)2·6H2O + 2Fe(NO3)3·9H2O + NaOH → CoFe2O4 + 8NaOH + 8NaNO3 + 28H2O | (1) |
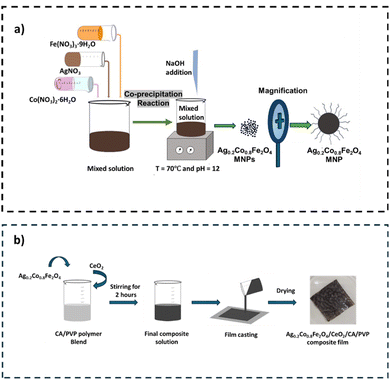
Ag0.2Co0.8Fe2O4 nanoparticles (AgxCo1−xFe2O4; x = 0.2) were synthesized in the same manner described previously by adding 0.4 M 50 mL Fe(NO3)3·9H2O and 0.16 M 50 mL Co(NO3)2·6H2O solution with 0.04 M 25 mL AgNO3 salt solutions. The preparation procedure is represented in Scheme 1a.
![[thin space (1/6-em)]](https://www.rsc.org/images/entities/char_2009.gif) :
:![[thin space (1/6-em)]](https://www.rsc.org/images/entities/char_2009.gif) 1, v/v) under continuous stirring for 30 min in a fume hood. Similarly, 2% polyvinylpyrrolidone (PVP) was dissolved in 10 mL of acetone/DMF (4
1, v/v) under continuous stirring for 30 min in a fume hood. Similarly, 2% polyvinylpyrrolidone (PVP) was dissolved in 10 mL of acetone/DMF (4![[thin space (1/6-em)]](https://www.rsc.org/images/entities/char_2009.gif) :
:![[thin space (1/6-em)]](https://www.rsc.org/images/entities/char_2009.gif) 1, v/v) and also stirred for 30 min in the fume hood. These two solutions were then mixed together and stirred continuously for 1 hour to ensure homogeneity. The stirring was conducted inside a fume hood to ensure the safe exhaustion of the evaporated solvent. Next, 12.5 wt% of Ag0.2Co0.8Fe2O4 (ACF) nanoparticles and 2 wt% of CeO2 powder (based on the total weight of solid polymers) were added to the CA/PVP mixture. A further stirring for 2 h was continued by placing the solution in a fume hood at room temperature. The resulting polymer solution, now containing finely dispersed ACF nanoparticles and cerium oxide, was carefully poured into a 60 mm diameter Petri dish. It was then naturally air dried at room temperature at 22 ± 5 °C and 35 ± 5% relative humidity in a well-ventilated area for 24 h. The remaining organic solvent slowly evaporated during this period, generating pores in the film. After 24 h, the dried Ag0.2Co0.8Fe2O4/CeO2/CA/PVP (ACFCeP) composite film was obtained by carefully peeling it off the Petri dish. The resulting film had a uniform thickness. As a comparison, a blank CA/PVP film (without ACF and CeO2) was also prepared to evaluate the dye removal efficiency of the composite. Scheme 1b illustrates the preparation process of the composite film.
1, v/v) and also stirred for 30 min in the fume hood. These two solutions were then mixed together and stirred continuously for 1 hour to ensure homogeneity. The stirring was conducted inside a fume hood to ensure the safe exhaustion of the evaporated solvent. Next, 12.5 wt% of Ag0.2Co0.8Fe2O4 (ACF) nanoparticles and 2 wt% of CeO2 powder (based on the total weight of solid polymers) were added to the CA/PVP mixture. A further stirring for 2 h was continued by placing the solution in a fume hood at room temperature. The resulting polymer solution, now containing finely dispersed ACF nanoparticles and cerium oxide, was carefully poured into a 60 mm diameter Petri dish. It was then naturally air dried at room temperature at 22 ± 5 °C and 35 ± 5% relative humidity in a well-ventilated area for 24 h. The remaining organic solvent slowly evaporated during this period, generating pores in the film. After 24 h, the dried Ag0.2Co0.8Fe2O4/CeO2/CA/PVP (ACFCeP) composite film was obtained by carefully peeling it off the Petri dish. The resulting film had a uniform thickness. As a comparison, a blank CA/PVP film (without ACF and CeO2) was also prepared to evaluate the dye removal efficiency of the composite. Scheme 1b illustrates the preparation process of the composite film.At equilibrium, the solutions were allowed to settle, and the MG-loaded composites were separated. The remaining equilibrium concentration of MG in the solutions was calculated by measuring the absorbance at 617 nm (λmax of MG) in a UV-vis spectrophotometer and via the calibration curve of MG.
The removal percentage of the dye was determined using the following formula:
 | (2) |
The amount of adsorbed Malachite Green per gram of the adsorbent (qe) was calculated according to the following equation:
 | (3) |
2.3 Material characterization
![[thin space (1/6-em)]](https://www.rsc.org/images/entities/char_2009.gif) 000 to 20
000 to 20![[thin space (1/6-em)]](https://www.rsc.org/images/entities/char_2009.gif) 000 Oe was applied at room temperature for the analysis.
000 Oe was applied at room temperature for the analysis.The linear and non-linear forms of Langmuir isotherms are represented by eqn (4) and (5), respectively.43
 | (4) |
 | (5) |
Freundlich isotherms in the linear and non-linear forms are presented by eqn (6) and (7), respectively.44
 | (6) |
 | (7) |
Dubinin–Radushkevich isotherm is used to determine whether the adsorption process undergoes physisorption or chemisorption. The linear and non-linear forms of the D–R isotherm are shown in eqn (8) and (9), respectively.45
ln![[thin space (1/6-em)]](https://www.rsc.org/images/entities/char_2009.gif) Qe = ln Qe = ln![[thin space (1/6-em)]](https://www.rsc.org/images/entities/char_2009.gif) Qm − βDRε2 Qm − βDRε2
| (8) |
| Qe = QmeβDRε2 | (9) |
 | (10) |
 | (11) |
Eqn (12) and (13) represent the linear and non-linear forms of Temkin equations, respectively.46
qe = A![[thin space (1/6-em)]](https://www.rsc.org/images/entities/char_2009.gif) ln ln![[thin space (1/6-em)]](https://www.rsc.org/images/entities/char_2009.gif) KT + A KT + A![[thin space (1/6-em)]](https://www.rsc.org/images/entities/char_2009.gif) ln ln![[thin space (1/6-em)]](https://www.rsc.org/images/entities/char_2009.gif) Ce Ce
| (12) |
qe = A![[thin space (1/6-em)]](https://www.rsc.org/images/entities/char_2009.gif) ln(KTCe) ln(KTCe)
| (13) |
 | (14) |
The dye adsorption rate is dependent on both the contact time and diffusion process between the adsorbate and the adsorbent.47 The adsorption process happens in two specific steps. In the first step, molecules migrate from the aqueous dye solution towards the adsorbent, and in the next step, diffusion on the adsorbent surface occurs.48 To understand the adsorption kinetics of the ACFCeP film, Lagergren pseudo-first-order equation, pseudo-second-order equation and Elovich model were assessed. The linear and non-linear pseudo-first-order equations are given in eqn (15) and (16), respectively.49
ln(qe − qt) = ln![[thin space (1/6-em)]](https://www.rsc.org/images/entities/char_2009.gif) qe + K1t qe + K1t
| (15) |
| qt = qe(1 − e−K1t) | (16) |
The linear and non-linear forms of the pseudo-second-order model are shown in eqn (17) and (18), respectively.50
 | (17) |
 | (18) |
Eqn (19) and (20) present the linear and non-linear Elovich kinetic models, respectively.51
 | (19) |
 | (20) |
3 Results and discussion
3.1 XRD and FTIR analysis
The XRD pattern of the synthesized cobalt ferrite (CF), Ag-doped cobalt ferrite (ACF), CA/PVP and Ag0.2Co0.8Fe2O4/CeO2/CA/PVP samples are displayed in Fig. 1a. The peaks were sharp and intense, indicating the crystalline structure and high purity of spinel CoFe2O4 (CF). The XRD pattern of cobalt ferrite showed its characteristic peak at 2θ = 35.52° of the (311) planes and resembled the crystalline FCC structure (JCPDS card no. 22-1086).11,52 The XRD pattern of Ag0.2Co0.8Fe2O4 (ACF) exhibits strong sharp peaks, presenting the crystallinity of ACF. The characteristic peak of Ag is also found at 2θ = 38.12°, corresponding to the (111) plane, confirming the presence of Ag.53 From the CA/PVP XRD pattern, a broad diffraction spectrum at 2θ = 18–22° is visible. This is due to the amorphous structure of the polymer blend and the replacement of hydroxide groups of cellulose by acetyl groups.54 From the diffraction pattern of the composite material ACFCeP, all the dominant peaks of Ag-doped cobalt ferrite are present. Besides that, the characteristic peak of CeO2 is observed at 2θ = 27.74° in the ACFCeP XRD pattern.55 The highly intense peaks indicate the crystallinity of the composite film after incorporating ACF and CeO2 in the amorphous CA/PVP polymer blend. The low intensity of the characteristic peak of cobalt ferrite at 2θ = 35.52° in the XRD of the composite material is because of the polymer matrix coating on cobalt ferrite particles, affecting the crystallinity of cobalt ferrite.56 The characteristic peak of Ag at 2θ = 38.12° has been shifted to 2θ = 37.95°. This change is due to expansion of the interplanar distance caused by the doping effect of CoFe2O4 nanoparticles and CeO2 as well as the capping effect of PVP present in the polymeric matrix. The interaction of the substituted CoFe2O4 nanoparticles and CeO2 with the Ag nanoparticles caused strain in the crystal structure.57,58 PVP, on the other hand, as a capping agent, can form coordinate bonds with silver through its carbonyl group, which affects the atomic arrangement on the nanoparticle surface and changes the lattice structure of Ag.59 These two effects combined altered the crystal structure of silver and are responsible for the small shift in peaks.60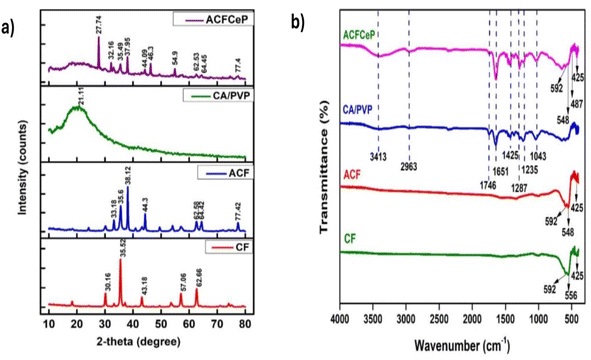 | ||
| Fig. 1 XRD pattern (a) and FTIR spectra (b) of cobalt ferrite, Ag-doped cobalt ferrite, CA/PVP blend and ACFCeP composite. | ||
The FTIR spectra of cobalt ferrite, Ag-doped cobalt ferrite, CA/PVP and the ACFCeP composite are demonstrated in Fig. 1b. In the spectrum of cobalt ferrite, the higher frequency absorption peak at 592 cm−1 and 556 cm−1 indicates the vibration of the tetrahedral metal oxide (M−O, M = Fe, Co) site and the lower frequency absorption peak at 425 cm−1 indicates the vibration of octahedral M−O of the spinel structure of cobalt ferrite.61,62 As Ag was doped in the cobalt ferrite, the characteristic peak of Ag–O is observed at 548 cm−1.63
In the CA/PVP blend, the stretching vibration of O–H at 3413 cm−1, bending of the C–H group at 1425 cm−1 and asymmetric stretching vibration of the C–H group at 2963 cm−1 resemble cellulose acetate.64,65 Moreover, the symmetric stretching of C![[double bond, length as m-dash]](https://www.rsc.org/images/entities/char_e001.gif) O from the COO− bond of CA is observed at 1746 cm−1.54 The CA/PVP spectrum also shows C–O stretching from the acetate group and stretching of the C–O–C group from cellulose at 1235 cm−1 and 1043 cm−1, respectively. The bands observed at 1287 cm−1 and 1651 cm−1 are attributed to the C–N stretching of the pyrrole structure and C
O from the COO− bond of CA is observed at 1746 cm−1.54 The CA/PVP spectrum also shows C–O stretching from the acetate group and stretching of the C–O–C group from cellulose at 1235 cm−1 and 1043 cm−1, respectively. The bands observed at 1287 cm−1 and 1651 cm−1 are attributed to the C–N stretching of the pyrrole structure and C![[double bond, length as m-dash]](https://www.rsc.org/images/entities/char_e001.gif) O stretching of the lactam ring from PVP, respectively.66
O stretching of the lactam ring from PVP, respectively.66
In the spectrum of the composite film, all the characteristic peaks of its components are present, indicating the successful preparation of the composite. Notably, in the ACFCeP composite, the peak observed at 487 cm−1 represents the Ce–O group from cerium oxide incorporated into the composite.67,68
3.2 XPS study
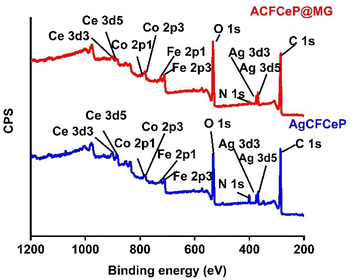
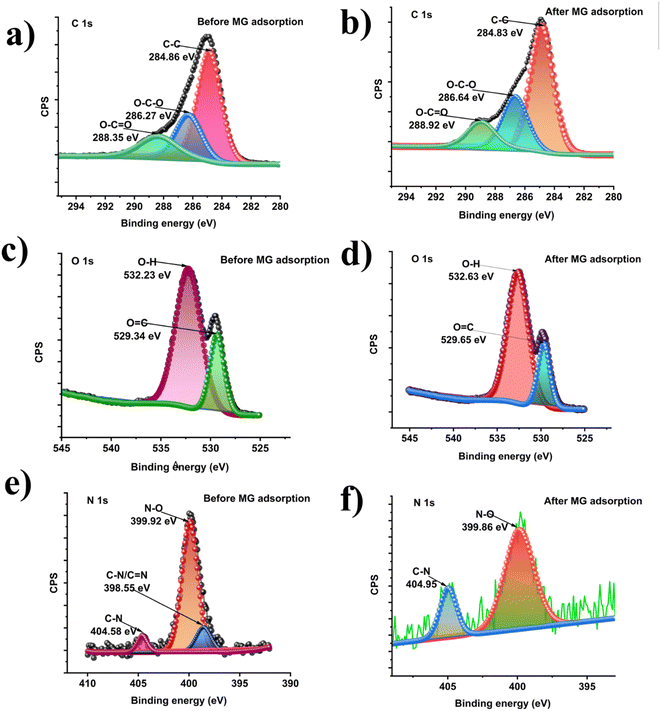
The XPS survey spectra of the as-prepared ACFCeP composite before and after MG adsorption are shown in Fig. 2. The presence of C, O, N, Ag, Fe, Co, and Ce on the survey spectra suggests that the composite was formed successfully (Table S1†).The major peaks observed around 285.92 eV, 532.87 eV, and 399.9 eV are attributed to the C 1s, O 1s and N 1s spectra, respectively.69 The C 1s of the composite were deconvoluted into three peaks placed at 284.86, 286.27, and 288.35, eV (Fig. 3a) allocated to C–C, O–C–O, and O–C![[double bond, length as m-dash]](https://www.rsc.org/images/entities/char_e001.gif) O, respectively.70,71 After adsorption, the binding energy shifted to 284.92, 286.64, and 288.82 eV (Fig. 3b) due to the π–π interaction of the dye with the aromatic ring of the composite polymers. The O 1s spectra of the composite show the functional O–H and O
O, respectively.70,71 After adsorption, the binding energy shifted to 284.92, 286.64, and 288.82 eV (Fig. 3b) due to the π–π interaction of the dye with the aromatic ring of the composite polymers. The O 1s spectra of the composite show the functional O–H and O![[double bond, length as m-dash]](https://www.rsc.org/images/entities/char_e001.gif) C groups at 532.23 eV and 529.34 eV (Fig. 3c).71,72 After dye adsorption, the O 1s is shifted to 532.63 and 529.65 eV (Fig. 3d) due to the electrostatic interaction of the dye with the composite. In Fig. 3e, N 1s spectra before MG adsorption are deconvoluted into three peaks at 399.92, 398.55, and 404.58 for N–O, C–N/C
C groups at 532.23 eV and 529.34 eV (Fig. 3c).71,72 After dye adsorption, the O 1s is shifted to 532.63 and 529.65 eV (Fig. 3d) due to the electrostatic interaction of the dye with the composite. In Fig. 3e, N 1s spectra before MG adsorption are deconvoluted into three peaks at 399.92, 398.55, and 404.58 for N–O, C–N/C![[double bond, length as m-dash]](https://www.rsc.org/images/entities/char_e001.gif) N, C–N bonds, respectively, whereas after MG adsorption (Fig. 3f), peaks appear at 399.86 and 404.95 and the peak at 398.55 disappeared (Table S2†).
N, C–N bonds, respectively, whereas after MG adsorption (Fig. 3f), peaks appear at 399.86 and 404.95 and the peak at 398.55 disappeared (Table S2†).
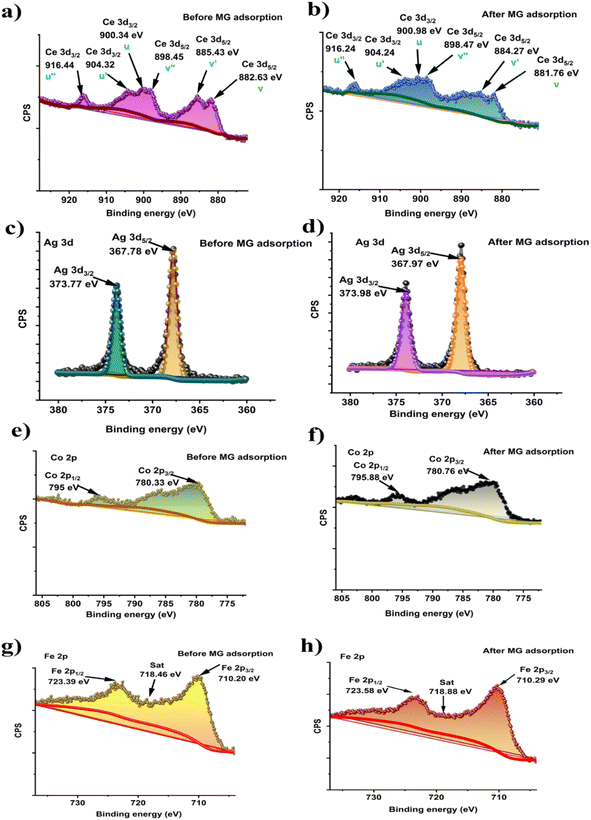
In dye adsorption, nitrogen atoms can donate electrons to the metal centres; therefore, their electron cloud distribution changes, which explains the disappearance of the peak at 398.55 eV. Similar peak disappearance after adsorption is also reported by P. Du et al.73 Also, the disappearance of the 398.55 eV peak after MG adsorption is likely due to the surface sensitivity of XPS, which detects only the topmost 10 nm. On the other hand, with a pore diameter of 14.85 nm, our prepared mesoporous composite allows dye molecules to adsorb deeper, which is beyond XPS detection. These may also explain the absence of a peak at 398.55 eV. Moreover, the atomic percentage of N 1s decreased from 4.24% to 1.19% after MG adsorption (Table S1†). The decrease in N 1s intensity after adsorption can be explained by the charge transfer mechanism between the nitrogen atoms in Malachite Green and the metals in the composite (i.e. Ce Ag, Co, Fe). The nitrogen atoms in the dimethylamino groups of Malachite Green possess lone pairs of electrons, which can act as electron donors. Meanwhile, Ce4+, with its high oxidation state and available empty 4f orbitals, can serve as an electron acceptor. This creates a charge transfer interaction, where nitrogen donates electron density to the empty 4f orbital of cerium. From the XPS spectrum of Ce 3d (Fig. 4a), it is observed that there are six distinctive peaks of Ce 3d divided into two groups of V and U types, linking to the two states Ce 3d5/2 and Ce 3d3/2.74 Before adsorption, the peaks denoted as V (882.63 eV), V″ (898.45 eV), U (900.34 eV), and U″ (916.44 eV) were attributed to Ce4+ and u′ (904.32) and v′ (885.43) for Ce3+.75,76 These peaks confirm that in the composite, both cerium Ce3+ and Ce4+ states are present. After adsorption, the Ce4+ binding energy shifted from 882.63 to 881.76 eV, 898.45 to 898.47 eV, 900.34 to 900.98 eV, and 916.44 to 916.24 eV, whereas the Ce3+ binding energy shifted from 885.46 to 884.27 eV and 904.32 to 904.24 eV (Fig. 4b). This shifting indicated the changes in the electronic environment around cerium, likely due to the co-ordination or charge transfer from the nitrogen loan pair of MG, which influences the reduction in the N 1s signal after adsorption. Moreover, the XPS peaks of Ag 3d appeared for the Ag 3d5/2 and Ag 3d3/2 states of Ag at 367.78 eV and 373.77 eV (Fig. 4c), respectively, confirming the doping of Ag into the composite.77 For silver (Ag), the peaks corresponding to the Ag 3d5/2 and Ag 3d3/2 states shift from 367.78 eV and 373.77 eV before adsorption to 367.97 eV and 373.98 eV after adsorption (Fig. 4d). The doublet peak at binding energies of 780.33 eV and 795 eV (Fig. 4e) represent Co 2p3/2 and Co 2p1/2 electronic states, respectively, of the Co 2p XPS spectra.78 For cobalt (Co), the Co 2p3/2 and Co 2p1/2 peaks shift from 780.33 eV and 795.00 eV before adsorption to 780.76 eV and 795.88 eV after adsorption (Fig. 4f), indicating the interaction between the MG molecules and the cobalt ions, which may involve electron donation from the dye to the metal centre. The Fe 2p XPS spectrum of the composite before adsorption reveals two primary peaks at 710.2 eV and 723.39 eV (Fig. 4g), corresponding to Fe 2p3/2 and Fe 2p1/2, respectively, which are characteristic of Fe3+ in ferrite materials.79,80 The satellite peak observed at approximately 718 eV further confirms the presence of Fe3+.81 After adsorption of MG, the iron (Fe) peaks for Fe 2p3/2 and Fe 2p1/2 shift from 710.2 eV and 723.39 eV to 710.29 eV and 723.59 eV (Fig. 4h). These shifts in the Fe 2p3/2 and 2p1/2 peaks suggests that there is no detectable reduction of Fe3+ to Fe2+ after dye adsorption, implying that Fe does not undergo redox changes during the adsorption process. This stability of the Fe oxidation states highlights the role of surface adsorption mechanisms rather than redox interactions between Fe and the dye. Overall, all shifts indicate a possible coordination interaction between the nitrogen atoms of MG and metal ions in the composite, suggesting that an inner sphere surface complexation occurs during the adsorption process.
3.3 Adsorption mechanism
In the composite, cellulose acetate (CA), polyvinylpyrrolidone (PVP), cerium oxide (CeO2), and Ag-doped cobalt ferrite interacted through coordination, hydrogen bonding, and electrostatic effects. The hydroxyl (–OH) and carbonyl (C![[double bond, length as m-dash]](https://www.rsc.org/images/entities/char_e001.gif) O) groups in CA formed hydrogen bonds with CeO2 and PVP and coordinated with metal ions in the ferrite. PVP contributed additional stability by coordinating through its nitrogen atoms with Ce and Ag ions and forming hydrogen bonds with CA's hydroxyl groups. CeO2, with its surface oxygen and Ce3+/Ce4+ ions, participates in both hydrogen bonding with the hydroxyl (–OH) group of CA and coordination with carbonyl groups in CA and PVP. Cerium in the composite also allowed possible electron transfer interactions with the N lone pair of PVP. Hence, it is observed from the XPS spectra of cerium that both Ce3+ and Ce4+ states are present before adsorption. Ag-doped cobalt ferrite further stabilized the composite through coordination between metal ions with the oxygen of CA and oxygen as well as nitrogen of PVP. Additionally, the Ag ions provided electrostatic interactions with the nitrogen atoms in PVP, contributing to the overall stability of the composite. These combined interactions create a cohesive, stabilized network within the composite structure.
O) groups in CA formed hydrogen bonds with CeO2 and PVP and coordinated with metal ions in the ferrite. PVP contributed additional stability by coordinating through its nitrogen atoms with Ce and Ag ions and forming hydrogen bonds with CA's hydroxyl groups. CeO2, with its surface oxygen and Ce3+/Ce4+ ions, participates in both hydrogen bonding with the hydroxyl (–OH) group of CA and coordination with carbonyl groups in CA and PVP. Cerium in the composite also allowed possible electron transfer interactions with the N lone pair of PVP. Hence, it is observed from the XPS spectra of cerium that both Ce3+ and Ce4+ states are present before adsorption. Ag-doped cobalt ferrite further stabilized the composite through coordination between metal ions with the oxygen of CA and oxygen as well as nitrogen of PVP. Additionally, the Ag ions provided electrostatic interactions with the nitrogen atoms in PVP, contributing to the overall stability of the composite. These combined interactions create a cohesive, stabilized network within the composite structure.
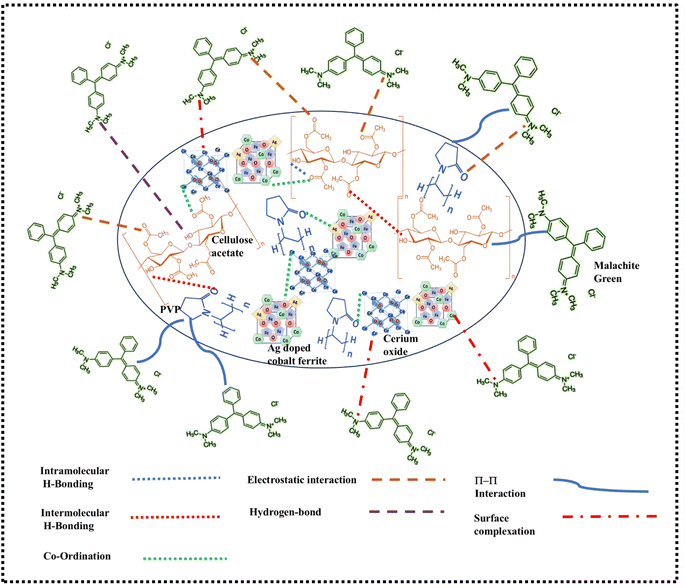
Adsorption is a surface phenomenon where adsorbates (ions or molecules) are held together by either van der Waals forces (physisorption) or chemical bonds (chemisorption). In this study, the adsorption of Malachite Green dye onto the surface of the ACFCeP composite can be attributed primarily to five main factors. (i) electrostatic interaction, (ii) H-bonding, (iii) surface complexation, (iv) pi–pi interaction, and (v) pore filling. (i) Electrostatic interactions: the electrostatic attraction between the positively charged Malachite Green (MG) molecules and the negatively charged functional groups (such as –OH groups in cellulose acetate and carbonyl groups in both PVP and cellulose acetate) plays a significant role in adsorption. These functional groups act as active binding sites for MG molecules.82 (ii) Hydrogen bonding: hydrogen bonding is another important interaction between the nitrogen-containing groups (dimethylamino groups) of MG and the hydrogen of the –OH group of cellulose acetate. This interaction enhances the adsorption process. (iii) Surface complexation and charge transfer: H. Zhu et al. reported that in surface complexation, the electron pair donor and electron acceptor interact to form various complexes.83 The XPS analysis reveals significant shifts in the binding energies of several metal ions before and after the adsorption of Malachite Green (MG), which supports the involvement of surface complexation and charge transfer interactions in the adsorption mechanism. This shift indicates a possible coordination interaction between the nitrogen atoms of MG and metal ions in the composite, suggesting that inner sphere surface complexation occurs during the adsorption process and the hypothesis of metal–dye complex formation (iv) π–π interactions: π–π stacking occurs between the aromatic rings of MG and the planar surfaces of cellulose acetate and PVP.84 These non-covalent interactions stabilize the dye molecules on the adsorbent surface.
Similar interactions were reported by A. A. Alqadami et al. where they observed electrostatic interactions, π–π stacking, and hydrogen bonding in the adsorption of Malachite Green onto Fe3O4@AMCA-MIL53(Al) composites.85 (v) Pore filling: the micropores in the ACFCeP composite structure may also contribute to the adsorption of MG by pore filling, where dye molecules are physically trapped within the porous network. From the BJH pore volume analysis, it is found that the composite possesses a pore volume of 0.0216 cm3 g−1, which also contributes to the dye adsorption mechanism. Scheme 2 presents the adsorption mechanism of the dye with the film.
Notably, no catalytic effect of MG on the ACFCeP film was observed in our experiments, as no reaction products indicative of catalytic degradation or chemical transformation of MG were detected in our analysis.
3.4 Morphological analysis
FE-SEM was used to analyze and observe the surface morphology of the samples. In Fig. 5a and b, the images of CF and ACF, respectively, show the sample possesses a very dense arrangement of uniformly distributed spherical-shaped nanoparticles. Also, both cobalt ferrite (CF) and Ag-doped cobalt ferrite (ACF) nanoparticles are visibly present in numerous agglomeration forms. The agglomeration of spherical particles observed in the SEM images can be attributed to van der Waals forces and particle–particle interactions, which are common in nanoscale materials.86 Fig. 5c illustrates the spherical CeO2 particles.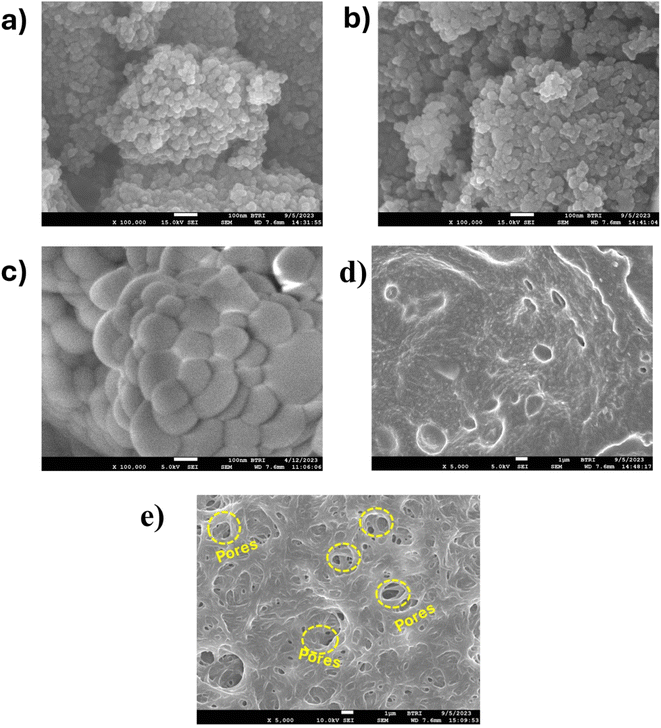 | ||
| Fig. 5 FE-SEM image of cobalt ferrite (a); Ag-doped cobalt ferrite (b); cerium oxide (c); CA/PVP polymer blend (d); ACFCeP composite (e). | ||
Comparing the FE-SEM image of CA/PVP in Fig. 5d and ACFCeP in Fig. 5e, many pores and cavities can be observed. The mixing of nanoparticles (ACF and CeO2) with the polymeric matrix (CA/PVP), along with the solvent evaporation process, likely contributed to the formation of pores and cavities within the composite structure.87,88 During solvent evaporation, voids can be formed as the solvent leaves the system, especially in the presence of nanoparticles, which can disturb the packing of the polymer chains and increase the porosity.
The EDX analysis of CF and ACF are shown in Fig. S1a and b.† Comparing the atomic percentages of CF and ACF given in Tables S3 and S4,† respectively, the decreased atom percentage of Co indicates that Co was mostly replaced by Ag in ACF.
3.5 Brunauer–Emmett–Teller (BET) specific surface area analysis
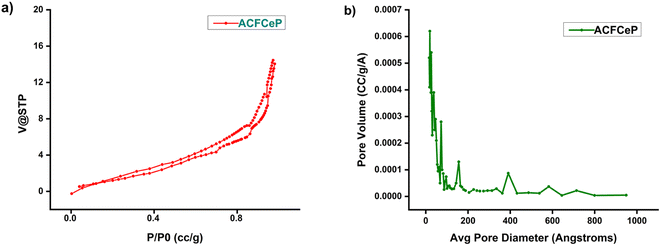
The surface area and porosity of an adsorbent have a significant effect on adsorption performance.89,90 The N2 gas adsorption and desorption isotherms of the prepared ACFCeP composite film are depicted in Fig. 6a and 4b.Table 1 shows the obtained BET surface area, pore size diameter and pore volume of the ACFCeP film. IUPAC (International Union of Pure and Applied Chemistry) classification was followed to determine the isotherms and pores of the film. According to IUPAC, pores with a diameter smaller than 2 nm are defined as micropores, mesopores with a diameter of 2–50 nm and macropores with a diameter greater than 50 nm.91 The BET analysis shows that the composite film exhibits a Type IV isotherm with an H4 type hysteresis loop.92 The specific surface area of the ACFCeP composite shows a moderate surface area of 5.824 m2 g−1, which is beneficial for the adsorption of organic dye molecules. The composite's pore volume is 0.0216 cm3 g−1, while the average pore diameter of 14.85 nm indicates the composite's mesoporous structure, which contributes to the diffusion of dye molecules into the composite film. Importantly, the molecular size of Malachite Green is 0.82 nm.93 Hence, it can fit into the pores of the ACFCeP composite during adsorption and can make the ACFCeP composite a suitable candidate for adsorption applications. Although the surface area is not particularly high, research by Chaukura et al. and N. El Badawi et al. shows that porous materials with similar surface areas can perform well in dye adsorption due to the accessibility of pores.94,95
| Specific surface area (m2 g−1) | 5.824 |
| Pore volume BJH (cm3 g−1) | 0.0216 |
| Average pore diameter (nm) | 14.85 (mesopores) |
3.6 Vibrating sample magnetometer (VSM) analysis
The magnetic properties of the CF, ACF and ACFCeP composite film were examined using VSM analysis. The sample's magnetic hysteresis (M−H) curves obtained at room temperature are shown in Fig. 7a–c. | ||
| Fig. 7 Magnetic hysteresis (M−H) curve of cobalt ferrite (CF) (a); Ag-doped cobalt ferrite (ACF) (b) and ACFCeP composite (c). | ||
Fig. 7 indicates the saturation magnetization (Ms) and remnant magnetization (Mr) of cobalt ferrite to be 82.9858 emu g−1 and 37.6368 emu g−1. A big hysteresis loop obtained from the M−H curve of cobalt ferrite (CF) suggests that it has ferrimagnetism.96 After silver doping, the hysteresis loop of Ag-doped cobalt ferrite (ACF) shows lower saturation magnetization and remanent magnetization, which are 29.8742 emu g−1 and 7.4171 emu g−1, respectively. The final ACFCeP composite exhibits a Ms of 3.7123 emu g−1 and Mr of 0.8467 emu g−1. Though ACFCeP shows lower magnetization values compared to pure cobalt ferrite, it also gives a visible hysteresis loop in the M−H curve, indicating the presence of magnetic properties in it.
3.7 Adsorption study of Malachite Green dye
To understand the relation between solution pH and MG dye adsorption process on ACFCeP, 50 mg of the composite was taken in a 50 ppm dye solution with pH ranging from 2 to 8, maintaining a contact time of 90 min. The result (Fig. 8a) shows that cationic MG dye adsorption is trivial in an acidic solution (pH 2). This happens as the H+ ion is present in high concentration, which replaces the MG dye molecule during adsorption. With increasing pH, the concentration of H+ ion decreases, and the removal percentage of the cationic MG dye increases. At pH 7, the removal% reaches the maximum at 93.3%. Fig. 8b shows that the ACFCeP composite film has a pHpzc of 6.7, which is below pH 7, indicating that the adsorbent surface is negatively charged and able to bind with the cationic MG dye.
Another important parameter is adsorbent dosage, which fixes the adsorbent's capacity for a certain initial dye concentration. For the batch experiment, ACFCeP adsorbents of weight 10–100 mg were taken separately in 30 mL of 50 ppm MG dye solutions, and the shaking speed was maintained at 200 rpm for 90 min.
The graph in Fig. 8c depicts that the adsorbent capacity of the ACFCeP film decreases with increasing adsorbent dosage. These may result from the aggregation or overlapping of adsorption sites and increased diffusion pathways.67 It is also visible that the removal percentage improved with the increasing quantity of adsorbents. The reason might be the accessibility to more active sites and the rise in surface area with the increasing adsorbent molecule.99 From the experiment, it is observed that the optimum adsorbent dose is 50 mg as it shows a maximum removal percentage of 94% with qe of 110 mg g−1, and further addition of the adsorbent does not influence the obtained values.
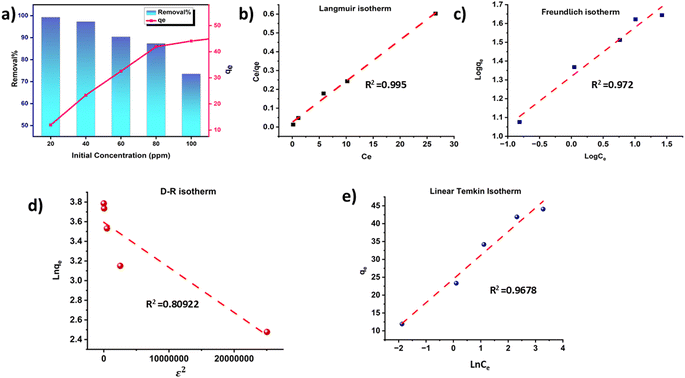
With increasing initial dye concentration, the percentage removal of the dye decreased but the adsorption capacity increased. This tendency indicates that a certain quantity of the adsorbent has almost a fixed amount of adsorption sites. So, the adsorbent cannot absorb dye molecules after the adsorption sites are occupied.100 Therefore, at lower initial dye concentrations, the composite adsorbent can adsorb the highest number of dye molecules. On the contrary, at higher initial dye concentrations, the active sites of the composite become saturated and the dye removal percentage decreases.
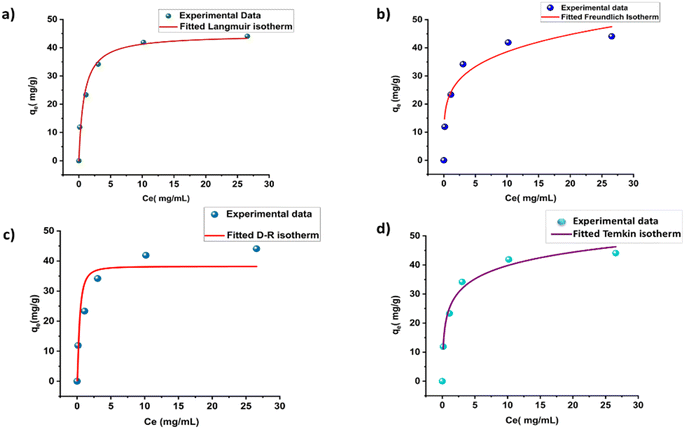
The relation between the adsorbate MG dye molecules and the ACFCeP surface is examined by the Langmuir, Freundlich, Dubinin–Radushkevich and Temkin isotherms, which are shown in Fig. 9b–e, respectively, in their linear forms. The non-linear forms of the corresponding isotherms are also demonstrated in Fig. 10a–d.
K and qmax values are measured from the slope and intercept of the linear plots of the Langmuir and D-R isotherms, respectively, using eqn (21) and (22). qmax is the theoretical maximum adsorption capacity, which is the highest adsorbate quantity that can be adsorbed per unit mass of the adsorbent (mg g−1).101 The equation shows a qmax value of 45.66 mg g−1 and 36.39 mg g−1 for Langmuir and D-R linear models, respectively.
| y = 0.0219x + 0.0252 | (21) |
| y = −0.00000005x + 3.5944 | (22) |
| y = 0.2606x + 1.318 | (23) |
| y = 6.633x + 24.514 | (24) |
The linear form of the Freundlich isotherm for the composite film is expressed by eqn (23), which gives the values of Kf and 1/n. As n is a function of the strength of adsorption, adsorption becomes more favorable with the increasing value of n.102 The value of n for good adsorption is between 2–10; for difficult adsorption, it is 1–2 and less than 1 for very poor adsorption.103 The value of n found in this study is 3.8 at room temperature, which indicates that adsorption is satisfactory in this case. The R2 value is found to be 0.972, which represents the moderate following of the Freundlich isotherm. The linear Temkin isotherm equation is shown in eqn (24). From eqn (11) and Table 2, the sign of b is positive, which indicates the process is endothermic.104 The data of all the non-linear isotherms are provided in Table S5.† The best-fitted isotherm model is indicated by the maximum value of the regression factor (R2). Among the linear and non-linear isotherms, the D–R isotherm was proven the most unfitted in both forms, with the lowest R2 values. Among all linear and non-linear models, both forms of the Langmuir isotherm and linear form of the Freundlich isotherm exhibited R2 values of 0.99 and 0.97, which is close to 1. Therefore, it can be said that the ACFCeP composite followed the linear Langmuir and Freundlich isotherms than the other isotherms. Furthermore, the adsorption capacity is also influenced by the pore volume, which can be observed from the calculation based on a pore volume of 0.0216 cm3 g−1 and the density of MG (1.2 g cm−3), suggesting an expected adsorption capacity of approximately 26 mg g−1. This calculation underscores the significance of pore volume in the adsorption process, as it directly impacts the capacity values.
| Isotherm model | Parameter | Value for ACFCeP composite |
|---|---|---|
| Langmuir | qmax (mg g−1) | 45.66 |
| K (L mg−1) | 0.869 | |
| R2 | 0.9956 | |
| Freundlich | Kf (mg g−1) | 20.79 |
| n | 3.8 | |
| R2 | 0.972 | |
| D–R | βDR | 4.60 × 10⁻⁸ |
| qmax (mg g−1) | 36.3924014 | |
| R2 | 0.80922 | |
| Temkin | A (unitless) | 6.63 |
| KT (L mg−1) | 40.3 | |
| b (kJ mol−1) | 373.69 | |
| R2 | 0.9678 |
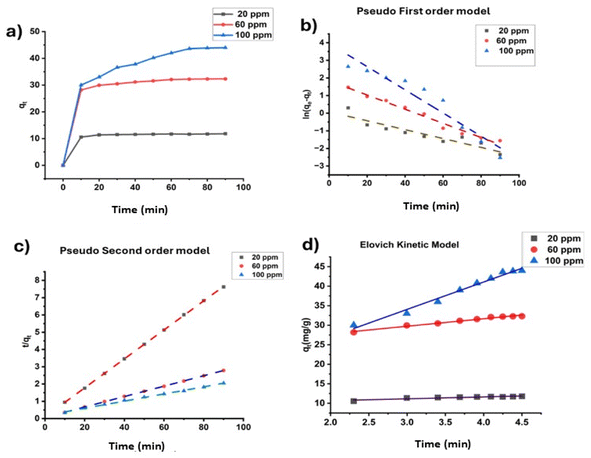
The relation between the contact time and adsorption capacity is shown in Fig. 11a for the three different concentrations. From the graph, it is visible that adsorption capacity rises rapidly in the first 10 min for all studied concentrations. Then, adsorption capacity becomes constant after 50 min for 20, 60 ppm and 70 min for 100 ppm. The plot suggests that with the increase in time, open sites for adsorption on the ACFCeP surface are decreased and at the plateau, the adsorption efficiency does not change anymore with any increase in adsorption time.106
To study the ACFCeP adsorption kinetics, MG dye solutions of different concentrations (20, 60, 100 ppm) are taken. The linear pseudo first order, pseudo second order and Elovich plots are shown in Fig. 11b–d, and the non-linear plots are demonstrated in Fig. 12a–c.
The adsorbent's adsorption capacity at equilibrium and rate constant are determined from the slope and intercept of each linear plot, respectively, and displayed in Table 3. The data for the non-linear plots are presented in Table S6.† The linear first order, second order and Elovich equations for three specific concentrations are displayed in Table S7.†
| Kinetic model and parameter | 20 ppm | 60 ppm | 100 ppm |
|---|---|---|---|
| Experimental qe (mg g−1) | 11.9081 | 32.5260 | 44.0642 |
![[thin space (1/6-em)]](https://www.rsc.org/images/entities/char_2009.gif) |
|||
| Pseudo first order (PFO) | |||
| qe (mg g−1) | 1.0796 | 6.2651 | 50.3702 |
| K1 (min−1) | 0.0252 | 0.0402 | 0.0658 |
| R2 | 0.8989 | 0.9794 | 0.9356 |
![[thin space (1/6-em)]](https://www.rsc.org/images/entities/char_2009.gif) |
|||
| Pseudo second order (PSO) | |||
| qe (mg g−1) | 11.9047 | 33.1125 | 48.3091 |
| K2 (g mg−1 min−1) | 0.0728 | 0.0137 | 0.0019 |
| R2 | 0.9999 | 0.9991 | 0.9914 |
![[thin space (1/6-em)]](https://www.rsc.org/images/entities/char_2009.gif) |
|||
| Elovich kinetics model | |||
| α (mg g−1 min−1) | 0.142450142 | 0.526316 | 2.083333 |
| β (g mg−1) | 44.6014365 | 551![[thin space (1/6-em)]](https://www.rsc.org/images/entities/char_2009.gif) 722.9 722.9 |
2.87000000 |
| R2 | 0.815 | 0.979 | 0.979 |
Comparing the R2 values, it is noticeable that pseudo second order kinetics and Elovich model both showed satisfactory R2 values in the non-linear forms but only the pseudo second order kinetic reached an R2 value close to 1 in the linear form for three different concentrations. Hence, it is suggested that the linear pseudo second order kinetics is more suitable than any other kinetic models for the adsorption of MG dye on the ACCFCeP film.
Fig. 13 shows that the dye removal percentage drops from 93.3% in the 1st cycle to 85% in the 3rd cycle. The removal percentage reduced gradually due to the partial desorption of dye molecules when regenerated after each cycle. Besides, blocking the pores by the dye molecules also contributes to a successive decrease in performance.107,108 So, experimentally, it is evident that the ACFCeP composite film has the potential for long-term reusability in industrial applications for removing organic dye molecules. Table 4 compares the adsorption capacities of the MG dye on various polymers and nanoparticle composites with the newly developed magnetic composite.
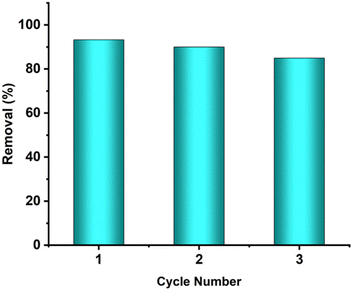 | ||
| Fig. 13 Demonstration of the reusability of the ACFCeP composite for removing MG up to three cycles. | ||
| Adsorbent | Qmax (mg g−1) | References |
|---|---|---|
| Chitin hydrogel | 33.57 | 109 |
| Graphene oxide (GO)-cellulose bead (GOCB) | 17.86 | 110 |
| Activated carbon-chitosan-SDS film | 4.80 | 8 |
| Zinc oxide-chitosan composite | 11.00 | 111 |
| ZnFe2O4-polyaniline-graphene oxide nanocomposite | 9.17 | 112 |
| Zeolite loaded PVA-CMC-sodium alginate membrane | 29.58 | 113 |
| Mn–Fe layered double hydroxides-polyethersulfone (PES) membrane | 13.49 | 114 |
| Magnetic activated carbon | 36.36 | 115 |
| Ag0.2Co0.8 Fe2O4/CeO2/cellulose acetate/polyvinylpyrrolidone (ACFCeP) composite film | 45.66 | This work |
| Magnetic nano copper ferrite, CuFe2O4 | 22 | 116 |
| Bentonite | 7.72 | 117 |
| Sugarcane dust | 4.88 | 118 |
4 Conclusions
In conclusion, this study introduces a straightforward synthesis method for an Ag0.2Co0.8Fe2O4/CeO2/CA/PVP (ACFCeP) composite film aimed at removing hazardous Malachite Green dye from industrial effluents. Through XPS analysis, it was revealed that the adsorption mechanism involves surface complexation via coordination of the metal present (Ag, Co, Fe, Ce) in the composite with the MG dye molecule. Also, other features like hydrogen bonding, electrostatic and π–π interactions are also responsible for adsorption as directed by changes in bond intensity. Moreover, the 14.8 nm mesoporous structure of the composite facilitates efficient dye removal by trapping the molecules within its pores. Additionally, the adsorption isotherm exhibited linear regression coefficients (R2) of 0.99 for the Langmuir model and 0.97 for the Freundlich model. Furthermore, batch adsorption experiments demonstrated a maximum adsorption capacity of 45.66 mg g−1 at pH 7. Notably, kinetic studies followed a pseudo-second-order model (R2 > 0.99), with equilibrium achieved within 50 min for dye concentrations of 20 and 60 ppm and within 70 min for 100 ppm. Importantly, the composite maintained an 85% dye removal efficiency after three cycles, highlighting its excellent reusability. Additionally, the composite's saturation magnetization of 3.7123 emu g−1 and strong hysteresis loop enable magnetic removal post-treatment. Consequently, these findings suggest that the synthesized composite film holds significant potential for real-world applications, particularly for the adsorption purpose of cationic dyes from aqueous solutions and industrial waste effluents.Data availability
The data supporting this article are provided within the main article and the accompanying ESI.†Author contributions
Monika Mahmud designed the study, conducted the experiments, wrote the manuscript, and supervised the entire research. Nafisa Tabassum conducted the experiments. Raamisa Anjum contributed to writing the manuscript. Papia Haque and Samina Ahmed also contributed to the supervision of the research. Md. Sahadat Hossain was responsible for the XRD phase identification analysis. Mashrafi Bin Mobarak performed the functional group analysis. Md. Saiful Quddus conducted the surface area and porosity analysis, as well as the XPS analysis. Lutfor Rahman conducted the VSM analysis. Fariha Chowdhury and Dipa Islam carried out the morphological investigation experiments.Conflicts of interest
There is no conflict of interest to report.Acknowledgements
The authors acknowledge the financial support from the Bangladesh Council of Scientific and Industrial Research (BCSIR) through the R&D project (ref. no. 39.02.0000.011.14.157.2022.172, dated 10.11.2022). Nafisa Tabassum would like to thank the Department of Applied Chemistry and Chemical Engineering at the University of Dhaka, Dhaka, Bangladesh, for the approval of her MS Thesis program.References
- K. A. Adegoke and O. S. Bello, Water Resour. Ind., 2015, 12, 8–24 CrossRef.
- A. Sahu and J. C. Poler, J. Environ. Chem. Eng., 2024, 12, 113754 CrossRef CAS.
- A. P. Periyasamy, Sustainability, 2024, 16(2), 495 CrossRef CAS.
- A. Tkaczyk, K. Mitrowska and A. Posyniak, Sci. Total Environ., 2020, 717, 137222 CrossRef CAS PubMed.
- S. Khan and A. Malik, in Environmental Deterioration and Human Health, Springer, Dordrecht, 2014, pp. 55–71 Search PubMed.
- R. Al-Tohamy, S. S. Ali, F. Li, K. M. Okasha, Y. A.-G. Mahmoud, T. Elsamahy, H. Jiao, Y. Fu and J. Sun, Ecotoxicol. Environ. Saf., 2022, 231, 113160 CrossRef CAS.
- S. Srivastava, R. Sinha and D. Roy, Aquat. Toxicol., 2004, 66, 319–329 CrossRef CAS PubMed.
- T. K. Arumugam, P. Krishnamoorthy, N. R. Rajagopalan, S. Nanthini and D. Vasudevan, Int. J. Biol. Macromol., 2019, 128, 655–664 CrossRef CAS.
- K. K. Kefeni, B. B. Mamba and T. A. M. Msagati, Sep. Purif. Technol., 2017, 188, 399–422 CrossRef CAS.
- C. V. Tran, D. V. Quang, H. P. Nguyen Thi, T. N. Truong and D. D. La, ACS Omega, 2020, 5, 7298–7306 CrossRef CAS PubMed.
- M. Mahmud, Md. Sahadat Hossain, M. Bin Mobarak, S. Sultana, S. Sharmin and S. Ahmed, Chem. Ecol., 2022, 38, 544–563 CrossRef CAS.
- Y. Kumar, A. Sharma and P. M. Shirage, RSC Adv., 2017, 7, 55778–55785 RSC.
- Z. Ding, W. Wang, Y. Zhang, F. Li and J. P. Liu, J. Alloys Compd., 2015, 640, 362–370 CrossRef CAS.
- S. Mishra, S. S. Sahoo, A. K. Debnath, K. P. Muthe, N. Das and P. Parhi, Adv. Powder Technol., 2020, 31, 4552–4562 CrossRef CAS.
- M. Y. Nassar and M. Khatab, RSC Adv., 2016, 6, 79688–79705 RSC.
- X. Wu, W. Wang, F. Li, S. Khaimanov, N. Tsidaeva and M. Lahoubi, Appl. Surf. Sci., 2016, 389, 1003–1011 CrossRef CAS.
- L. Wang, J. Li, Y. Wang, L. Zhao and Q. Jiang, Chem. Eng. J., 2012, 181–182, 72–79 CrossRef CAS.
- A. Almasian, F. Najafi, M. Mirjalili, M. P. Gashti and G. C. Fard, J. Taiwan Inst. Chem. Eng., 2016, 67, 306–317 CrossRef CAS.
- X. Wu, Z. Ding, N. Song, L. Li and W. Wang, Ceram. Int., 2016, 42, 4246–4255 CrossRef CAS.
- R. Dou, H. Cheng, J. Ma and S. Komarneni, Mater. Chem. Phys., 2020, 240, 122181 CrossRef CAS.
- L. Zhang, J. Lian, L. Wang, J. Jiang, Z. Duan and L. Zhao, Chem. Eng. J., 2014, 241, 384–392 CrossRef CAS.
- G.-J. Kwon, S.-Y. Han, C.-W. Park, J.-S. Park, E.-A. Lee, N.-H. Kim, M. Alle, R. Bandi and S.-H. Lee, Polymers, 2020, 12, 164 CrossRef CAS PubMed.
- M. V. Cañamares and J. R. Lombardi, J. Phys. Chem. C, 2015, 119, 14297–14303 CrossRef.
- C.-P. Li, H. Zhou, S. Wang, H.-H. Yuan, S.-Z. Zhang and M. Du, Chem. Commun., 2017, 53, 4767–4770 RSC.
- C. Srilakshmi and R. Saraf, Microporous Mesoporous Mater., 2016, 219, 134–144 CrossRef CAS.
- A. A. Alshahrani, A. Q. Alorabi, M. S. Hassan, T. Amna and M. Azizi, Nanomaterials, 2022, 12, 2713 CrossRef CAS PubMed.
- M. Khairy, R. Kamal, N. H. Amin, M. A. Mousa and J. Basic, Environ. Sci., 2016, 3, 123–132 Search PubMed.
- A. A. Ali, S. R. El-Sayed, S. A. Shama, T. Y. Mohamed and A. S. Amin, Desalin. Water Treat., 2020, 204, 124–135 CrossRef CAS.
- H. Tu, Y. Yu, J. Chen, X. Shi, J. Zhou, H. Deng and Y. Du, Polym. Chem., 2017, 8, 2913–2921 RSC.
- S. Tahazadeh, T. Mohammadi, M. A. Tofighy, S. Khanlari, H. Karimi and H. B. Motejadded Emrooz, J. Membr. Sci., 2021, 638, 119692 CrossRef CAS.
- J. Cheng, C. Zhan, J. Wu, Z. Cui, J. Si, Q. Wang, X. Peng and L.-S. Turng, ACS Omega, 2020, 5, 5389–5400 CrossRef CAS.
- S. Gopi, A. Pius, R. Kargl, K. S. Kleinschek and S. Thomas, Polym. Bull., 2019, 76, 1557–1571 CrossRef CAS.
- H. Zang, Y. Li, Y. Li, L. Chen, Q. Du, K. Zhou, H. Li, Y. Wang and L. Ci, J. Nanosci. Nanotechnol., 2019, 19, 4535–4542 CrossRef PubMed.
- J. Rana, G. Goindi, N. Kaur, S. Krishna and A. Kakati, J. Water Process Eng., 2022, 49, 103102 CrossRef.
- M. E. Mahmoud and M. S. Abdelwahab, Int. J. Biol. Macromol., 2019, 128, 196–203 CrossRef CAS.
- P. Zhao, R. Li, W. Wu, J. Wang, J. Liu and Y. Zhang, Composites, Part B, 2019, 176, 107208 CrossRef CAS.
- K. Chan, L. E. Kostun, W. E. Tenhaeff and K. K. Gleason, Polymer, 2006, 47, 6941–6947 CrossRef CAS.
- Y. Luo, Y. Hong, L. Shen, F. Wu and X. Lin, AAPS PharmSciTech, 2021, 22, 34 CrossRef CAS PubMed.
- S. M. Maroofi and N. M. Mahmoodi, Colloids Surf., A, 2019, 572, 211–220 CrossRef CAS.
- H. Fakhry, M. El-Sonbati, B. Omar, R. El-Henawy, Y. Zhang and M. El-Kady, J. Environ. Manage., 2022, 315, 115128 CrossRef CAS PubMed.
- K. M. Koczkur, S. Mourdikoudis, L. Polavarapu and S. E. Skrabalak, Dalton Trans., 2015, 44, 17883–17905 RSC.
- N. A. Elessawy, M. H. Gouda, M. S. Elnouby, H. F. Zahran, A. Hashim, M. M. Abd El-Latif and D. M. F. Santos, Appl. Sci., 2021, 11, 9186 CrossRef CAS.
- I. Langmuir, J. Am. Chem. Soc., 1918, 40, 1361–1403 CrossRef CAS.
- H. Freundlich, Z. Phys. Chem., 1907, 57(1), 385–470 CrossRef CAS.
- Y. S. Ho, J. F. Porter and G. McKay, Water, Air, Soil Pollut., 2002, 141, 1–33 CrossRef CAS.
- M. J. Tempkin and V. Pyzhev, Acta Phys.-Chim. Sin., 1940, 12, 217–222 Search PubMed.
- S. Pal, S. Ghorai, C. Das, S. Samrat, A. Ghosh and A. B. Panda, Ind. Eng. Chem. Res., 2012, 51, 15546–15556 CrossRef CAS.
- H. Mittal, V. Kumar, Saruchi and S. S. Ray, Int. J. Biol. Macromol., 2016, 89, 1–11 CrossRef CAS PubMed.
- S. Lagergren, Sven Vetenskapsakad Handingarl, 1898, 24, 1–39 Search PubMed.
- Y. S. Ho and G. McKay, Chem. Eng. J., 1998, 70, 115–124 CrossRef CAS.
- C. Aharoni and F. C. Tompkins, in Advances in Catalysis, ed. D. D. Eley, H. Pines and P. B. Weisz, Academic Press, 1970, vol. 21, pp. 1–49 Search PubMed.
- M. M. Ismail, S. N. Rafeeq, J. M. A. Sulaiman and A. Mandal, Appl. Phys. A: Mater. Sci. Process., 2018, 124, 380 CrossRef.
- A. Rohaizad, S. Shahabuddin, M. M. Shahid, N. M. Rashid, Z. A. M. Hir, M. M. Ramly, K. Awang, C. W. Siong and Z. Aspanut, J. Environ. Chem. Eng., 2020, 8, 103955 CrossRef CAS.
- A. W. Cindradewi, R. Bandi, C.-W. Park, J.-S. Park, E.-A. Lee, J.-K. Kim, G.-J. Kwon, S.-Y. Han and S.-H. Lee, Polymers, 2021, 13, 2990 CrossRef CAS PubMed.
- E. Nyankson, J. Adjasoo, J. K. Efavi, A. Yaya, G. Manu, A. Kingsford and R. Y. Abrokwah, Sci. Afr., 2020, 7, e00257 CAS.
- R. Jayalakshmi and J. Jeyanthi, J. Inorg. Organomet. Polym., 2018, 28, 1286–1293 CrossRef CAS.
- J.-D. Musah, S. W. Or, L. Kong, V. A. L. Roy and C.-M. L. Wu, Nanomaterials, 2023, 13(20), 2738 CrossRef CAS PubMed.
- N. Sharma, R. Kant and V. Sharma, Appl. Phys. A: Mater. Sci. Process., 2023, 129, 223 CrossRef CAS.
- L. Gharibshahi, E. Saion, E. Gharibshahi, A. H. Shaari and K. A. Matori, PLoS One, 2017, 12, e0186094 CrossRef.
- C. Wu, B. P. Mosher, K. Lyons and T. Zeng, J. Nanosci. Nanotechnol., 2010, 10, 2342–2347 CrossRef CAS.
- G. Allaedini, S. M. Tasirin and P. Aminayi, Int. Nano Lett., 2015, 5, 183–186 CrossRef CAS.
- Y. Yang, F. Ali, A. Said, N. Ali, S. Ahmad, F. Raziq and S. Khan, Polym. Compos., 2021, 42, 285–296 CrossRef CAS.
- M. R. H. Siddiqui, S. F. Adil, M. E. Assal, R. Ali and A. A. Al-Warthan, Asian J. Chem., 2013, 25, 3405–3409 CrossRef CAS.
- M. Nouri, A. Marjani, M. Tajdari, F. Heidary and M. Salimi, Colloid Polym. Sci., 2018, 296, 1213–1223 CrossRef CAS.
- S. Kendouli, O. Khalfallah, N. Sobti, A. Bensouissi, A. Avci, V. Eskizeybek and S. Achour, Mater. Sci. Semicond. Process., 2014, 28, 13–19 CrossRef CAS.
- A. Rahma, M. M. Munir, Khairurrijal, A. Prasetyo, V. Suendo and H. Rachmawati, Biol. Pharm. Bull., 2016, 39, 163–173 CrossRef CAS.
- F. Ghanbary and E. Jafarnejad, Inorg. Nano-Met. Chem., 2017, 47, 1675–1681 CrossRef CAS.
- R. Zamiri, H. A. Ahangar, A. Kaushal, A. Zakaria, G. Zamiri, D. Tobaldi and J. M. F. Ferreira, PLoS One, 2015, 10, e0122989 CrossRef PubMed.
- M. Mahmud, A. F. M. M. Rahman, K. S. Salem, Md. L. Bari and H. Qiu, ACS Appl. Bio Mater., 2022, 5, 5126–5139 CrossRef CAS.
- C. Zhao, F. Ran, L. Dai, C. Li, C. Zheng and C. Si, Carbohydr. Polym., 2021, 255, 117343 CrossRef CAS.
- Q.-J. Chen, L.-L. Zhou, J.-Q. Zou and X. Gao, Int. J. Biol. Macromol., 2019, 132, 1155–1162 CrossRef CAS PubMed.
- X.-L. Xu, M. Zhang, L. Wang, S. Duan and J.-Q. Song, Colloid Polym. Sci., 2016, 294, 755–765 CrossRef CAS.
- P. Du, L. Xu, Z. Ke, J. Liu, T. Wang, S. Chen, M. Mei, J. Li and S. Zhu, J. Colloid Interface Sci., 2022, 616, 12–22 CrossRef CAS PubMed.
- N. Fifere, A. Airinei, F. Doroftei, T. Ardeleanu, M. Dobromir, D. Timpu and L. Ursu, Int. J. Mol. Sci., 2023, 24, 8917 CrossRef CAS PubMed.
- D. Channei, B. Inceesungvorn, N. Wetchakun, S. Ukritnukun, A. Nattestad, J. Chen and S. Phanichphant, Sci. Rep., 2014, 4, 5757 CrossRef CAS.
- R. A. Vazirov, S. Y. Sokovnin, V. G. Ilves, I. N. Bazhukova, N. Pizurova and M. V. Kuznetsov, J. Phys.: Conf. Ser., 2018, 1115, 032094 CrossRef.
- M. R. Salvadori, R. A. Ando, C. A. O. Nascimento and B. Corrêa, J. Environ. Sci. Health, Part A: Toxic/Hazard. Subst. Environ. Eng., 2017, 52, 1112–1120 CrossRef CAS.
- R. S. Yadav, I. Kuřitka, J. Vilcakova, J. Havlica, J. Masilko, L. Kalina, J. Tkacz, J. Švec, V. Enev and M. Hajdúchová, Adv. Nat. Sci.: Nanosci. Nanotechnol., 2017, 8, 045002 Search PubMed.
- S. Kamal, G.-T. Pan, S. Chong and T. C. Yang, Processes, 2020, 8(1), 104 CrossRef CAS.
- Z. Musajan and P. Xiao, Environ. Sci. Pollut. Res., 2023, 30, 48088–48106 CrossRef CAS.
- K. Hareesh, S. R. Rondiya, N. Y. Dzade, S. D. Dhole, J. Williams and S. Sergey, J. Sci.: Adv. Mater. Devices, 2021, 6, 291–301 CAS.
- P. T. Lan Huong, N. Tu, H. Lan, L. H. Thang, N. Van Quy, P. A. Tuan, N. X. Dinh, V. N. Phan and A.-T. Le, RSC Adv., 2018, 8, 12376–12389 RSC.
- H. Zhu, S. Chen and Y. Luo, J. Agric. Food Res., 2023, 12, 100552 CAS.
- M. Muslim, A. Ali, I. Neogi, N. Dege, M. Shahid and M. Ahmad, Polyhedron, 2021, 210, 115519 CrossRef CAS.
- A. A. Alqadami, Mu. Naushad, Z. A. Alothman and T. Ahamad, J. Environ. Manage., 2018, 223, 29–36 CrossRef CAS.
- H. R. Noormohamadi, M. R. Fat'hi and M. Ghaedi, J. Colloid Interface Sci., 2018, 531, 343–351 CrossRef CAS PubMed.
- E. M. Bakhsh, S. A. Khan, H. M. Marwani, E. Y. Danish, A. M. Asiri and S. B. Khan, Int. J. Biol. Macromol., 2018, 107, 668–677 CrossRef CAS.
- S. Vetrivel, D. Rana, M. S. Sri Abirami Saraswathi, K. Divya, N. J. Kaleekkal and A. Nagendran, Polym. Adv. Technol., 2019, 30, 1943–1950 CrossRef CAS.
- R. K. S. Rathour, J. Bhattacharya and A. Mukherjee, Environ. Technol. Innovation, 2020, 19, 100851 CrossRef.
- S. Luanwuthi, A. Krittayavathananon, P. Srimuk and M. Sawangphruk, RSC Adv., 2015, 5, 46617–46623 RSC.
- M. Mahmud, Md. Sahadat Hossain, M. Bin Mobarak, Md. Saiful Quddus, M. Shahriar Bashar, U. Sarmeen Akhter, S. Akter Jahan, D. Islam and S. Ahmed, Environ. Sci.: Adv., 2022, 1(5), 827–848 CAS.
- Z. ALOthman, Materials, 2012, 5, 2874–2902 CrossRef CAS.
- S. Muniandy, L. Salleh and M. A. A. Zaini, Desalin. Water Treat., 2020, 203, 440–448 CrossRef CAS.
- N. Chaukura, E. C. Murimba and W. Gwenzi, Appl. Water Sci., 2017, 7, 2175–2186 CrossRef CAS.
- N. El Badawi, A. R. Ramadan, A. M. K. Esawi and M. El-Morsi, Desalination, 2014, 344, 79–85 CrossRef CAS.
- B. J. Rani, M. Ravina, B. Saravanakumar, G. Ravi, V. Ganesh, S. Ravichandran and R. Yuvakkumar, Nano-Struct. Nano-Objects, 2018, 14, 84–91 CrossRef CAS.
- G. Liu, Z. Hu, R. Guan, Y. Zhao, H. Zhang and B. Zhang, Korean J. Chem. Eng., 2016, 33, 3141–3148 CrossRef CAS.
- H. Aysan, S. Edebali, C. Ozdemir, M. Celik Karakaya and N. Karakaya, Microporous Mesoporous Mater., 2016, 235, 78–86 CrossRef CAS.
- J. Zhang, M. Liu, Z. Liu, T. Yang, Q. He, K. Yang and H. Wang, J. Sol-Gel Sci. Technol., 2017, 82, 424–431 CrossRef CAS.
- G. Yao, W. Bi and H. Liu, Colloids Surf., A, 2020, 588, 124393 CrossRef CAS.
- A. A. Sitab, F. Tujjohra, T. U. Rashid and M. M. Rahman, Clean. Eng. Technol., 2023, 13, 100621 CrossRef.
- J. Dasgupta, A. Kumar, D. D. Mandal, T. Mandal and S. Datta, Desalin. Water Treat., 2016, 57, 14188–14212 CrossRef CAS.
- M. Z. Iqbal, P. Pal, M. Shoaib and A. Abdala, Desalin. Water Treat., 2017, 68, 226–235 CrossRef CAS.
- J. Ghogomu, Br. J. Appl. Sci. Technol., 2013, 3, 942–961 CrossRef.
- H. Jayasantha Kumari, P. Krishnamoorthy, T. K. Arumugam, S. Radhakrishnan and D. Vasudevan, Int. J. Biol. Macromol., 2017, 96, 324–333 CrossRef CAS.
- R. R. Mohamed, M. H. Abu Elella, M. W. Sabaa and G. R. Saad, Cellulose, 2018, 25, 6513–6529 CrossRef CAS.
- R. Jiang, H. Zhu, X. Li and L. Xiao, Chem. Eng. J., 2009, 152, 537–542 CrossRef CAS.
- R. Jiang, H. Zhu, G. Zeng, L. Xiao and Y. Guan, J. Cent. South Univ. Technol., 2010, 17, 1223–1229 CrossRef CAS.
- H. Tang, W. Zhou and L. Zhang, J. Hazard. Mater., 2012, 209–210, 218–225 CrossRef CAS.
- X. Zhang, H. Yu, H. Yang, Y. Wan, H. Hu, Z. Zhai and J. Qin, J. Colloid Interface Sci., 2015, 437, 277–282 CrossRef CAS PubMed.
- V. M. Muinde, J. M. Onyari, B. Wamalwa and J. N. Wabomba, Environ. Chem. Ecotoxicol., 2020, 2, 115–125 CrossRef.
- Z. A.-A. N. Al-Hasnawy, K. K. Jasim and M. A. Awad, HIV Nursing, 2023, 23, 463–474 Search PubMed.
- S. Radoor, J. Karayil, A. Jayakumar, J. Parameswaranpillai and S. Siengchin, J. Polym. Environ., 2021, 29, 2126–2139 CrossRef CAS.
- M. Abbasi, M. M. Sabzehmeidani, M. Ghaedi, R. Jannesar and A. Shokrollahi, Appl. Clay Sci., 2021, 203, 105946 CrossRef CAS.
- D. Datta, Ö. Kerkez Kuyumcu, Ş. S. Bayazit and M. Abdel Salam, J. Dispersion Sci. Technol., 2017, 38, 1556–1562 CrossRef CAS.
- B. R. Vergis, R. Hari Krishna, N. Kottam, B. M. Nagabhushana, R. Sharath and B. Darukaprasad, J. Nanostruct. Chem., 2018, 8, 1–12 CrossRef CAS.
- S. S. Tahir and N. Rauf, Chemosphere, 2006, 63, 1842–1848 CrossRef CAS.
- S. D. Khattri and M. K. Singh, Adsorpt. Sci. Technol., 1999, 17, 269–282 CrossRef CAS.
Footnote |
| † Electronic supplementary information (ESI) available. See DOI: https://doi.org/10.1039/d4ra06315e |
| This journal is © The Royal Society of Chemistry 2024 |

