 Open Access Article
A comparative study on the thermal runaway process mechanism of a pouch cell based on Li-rich layered oxide cathodes with different activation degrees†
Wei Quan *ab,
Jinghao Liuab,
Jinhong Luoab,
Hangfan Dongab,
Zhimin Renab,
Guohua Liab,
Xiaopeng Qiab,
Zilong Su*ab and
Jiantao Wang*abc
aChina Automotive Battery Research Institute Co., Ltd, No.11 Xingke Dong Street, Huairou District, Beijing, 101407, China. E-mail: quanwei@glabat.com
bGrinm Group Corporation Limited (Grinm Group), No.2 Xinjiekou Wai Street, Xicheng District, Beijing, 100088, China
cGeneral Research Institute for Nonferrous Metals, No.2 Xinjiekou Wai Street, Xicheng District, Beijing, 100088, China
First published on 4th November 2024
Abstract
Li-rich layered oxide (LLO) is regarded as one of the most promising candidates for the next-generation batteries. At present, most of the research studies are focusing on the normal electrochemical properties of LLOs, while safety issues of the cells are neglected. To address this problem, this article systematically investigates the thermal runaway (TR) process of the pouch cell based on LLOs and elucidates how different activation degrees influence the thermal stability of the cathode material and cell, through various thermal analysis methods. Results prove that for the cell with higher activation degrees, more vulnerable solid electrolyte interfaces (SEI) are formed, leading to the occurrence of a self-heat process at lower temperatures. Then, more exothermic reactions are strengthened due to the weakened stability of the cathode material, releasing more heat and triggering TR processes at lower temperatures. Finally, during the period of uncontrolled TR, more oxidative O2 is released, responsible for the intensified exothermic redox reactions. Therefore, moderate activation of LLOs should be a reasonable and practical application strategy, considering the balance between the high energy density and safety of the cells.
Introduction
Since their initial commercialization by Sony Corporation in the 1990s, lithium-ion batteries (LIBs) have been extensively utilized across various areas, including electronics, power stations, and transportation.1–3 The transportation market, in particular, has experienced a significant growth in the application of electric vehicles (EVs) worldwide, driven by rapid advancements in LIB technologies. As EVs become more widespread, application-related challenges have emerged, indicating that traditional LIB technology is approaching its performance limits. Range anxiety and safety concerns are widely recognized as pivotal factors influencing consumer decisions regarding EVs. Therefore, exploring next-generation LIBs that offer both high energy density and enhanced safety is an urgent priority.4–8 The development of innovative cathode materials is the key to enhancing the performance of LIBs. Li-rich layered oxides (LLOs), first reported by Thackeray, have emerged as one of the most promising cathode materials due to their exceptional specific capacity.9 Despite their potential for achieving higher energy density, Cells based on LLOs face several challenges, including low initial coulombic efficiency, poor cycle stability, and voltage fading.10–12Currently, significant research efforts are dedicated to tackling these issues, focusing on topics such as the anionic lattice-oxygen redox mechanism, cycle stability analysis, and material structure modifications.13–21 However, much of this progress has been focused on the normal electrochemical properties of LLOs, while safety issues of the cells are neglected or only material-level thermal stability is studied.22 Especially, the thermal runaway process (TR) of cells based on LLOs and the mechanism that how the LLOs materials with different activation degrees influence the safe property of the cells are almost blank, hindering their practical applications significantly.
During the TR process of a pouch cell, a serial of exothermic reactions will occur at different temperatures, regarded as the major sources of heat during failure. At 60–100 °C, the decomposition of SEI is initiated, followed by a reaction between the anode active material with the electrolyte. Then, the polymeric separator, which melts between 120–140 °C results in inner shorts inside the cell. At elevated temperatures, 170–235 °C, the cathode active material begins to decompose and release oxygen, which may oxidize the electrolyte and exothermically react with the anode active material, substantially increasing the overall temperature of the battery. To evaluate this process, accelerating rate calorimeter (ARC) tests is a powerful tool. Besides, differential scanning calorimetry (DSC), thermogravimetric-mass spectra analysis (TG-MS), and high temperature X-ray diffraction (HT-XRD) are employed to reveal the evolution of the cells and LLOs materials during TR. Based on these results, the relationship between the thermal stability of the cathode materials and the safe property of the cells with different activation degrees are elaborated.
Experimental
Preparation of the pouch cells
Pouch cell preparations are described in ESI.† To achieve different activation degrees, the formation voltage windows are set as 2.0–4.2 V, 2.0–4.4 V, and 2.0–4.6 V respectively. These three cells are named as C2, C4, and C6 accordingly.Safety characterization of the cells
Thermal stability characterization of the cathode materials
Results and discussion
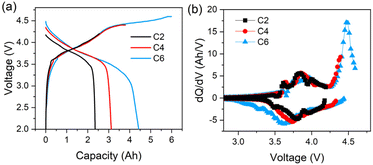
The initial charge–discharge and relative differential capacity versus voltage (dQ/dV) curves of the three cells are depicted in Fig. 1. The first discharge capacity information of the cells with varying upper voltages are detailed in Table S1 (ESI).† The initial discharge capacities are 2.45, 3.11 and 4.43 Ah for C2, C4, and C6 respectively, while the specific capacities of the cathode materials are 123, 162 and 231 mA h g−1 accordingly. The plateau evident in Fig. 1a, commencing around 4.3 V, and the peak observed at approximately 4.5 V in Fig. 1b correspond to the activation of the Li2MnO3 phase, which contributes additional capacity from anionic redox reactions to the cells.11 Notably, the extent of such activations can be enhanced with the increase in the upper voltage. Specific contributions from cationic and anionic redox reactions are also listed in Table S1 (ESI).† The capacity from anionic contributions for C4 is about 0.76 A h, constituting approximately 24.4% of the total discharge capacity. When the upper voltage is increased from 4.4 V to 4.6 V, the capacity from anionic contributions have adds up tp about 2.08 A h, covering approximately 46.9% of the whole capacities.Fig. 2 shows the ARC testing results for all the cells, including the temperature curves versus time and temperature rate. The typical parameters, generally regarded as the most important features of TR, are listed in Table 1.6 Specifically, T1 corresponds to the onset temperature for detectable self-heat generation, typically attributed to the decomposition of the solid electrolyte interface (SEI). T2 denotes the trigger temperature of TR, which is the tipping point that separates the gradual temperature increase from the sharp temperature increase. A higher T2 usually means better thermal tolerance, making the battery pass standard abuse tests more possibly. Generally, 1 °C s−1 of the temperature rise rating (dT/dt) is used as the metric to define T2.24 T3 is the maximum temperature that the cell can reach during TR.
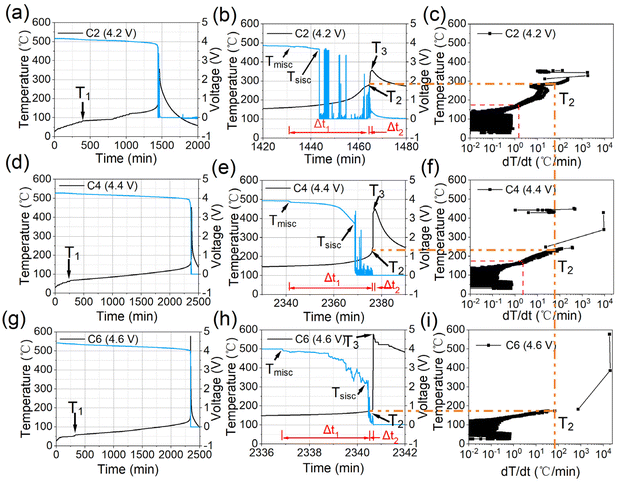 | ||
| Fig. 2 ARC testing results of all batteries with different upper voltages ((a–c) for 4.2 V, (d–f) for 4.4 V, (g–i) for 4.6 V). | ||
| Samples | T1 (°C) | T2 (°C) | T3 (°C) | Tmisc (°C) | Tsisc (°C) | Δt1 (min) | Δt2 (min) | dT/dtmax (°C min−1) |
|---|---|---|---|---|---|---|---|---|
| C2 | 83 | 287 | 360 | 159 | 173 | 33 | 1.0 | 1768 |
| C4 | 67 | 232 | 452 | 149 | 174 | 35 | 0.9 | 9140 |
| C6 | 60 | 174 | 633 | 149 | 165 | 7 | 0.1 | 20![[thin space (1/6-em)]](https://www.rsc.org/images/entities/char_2009.gif) 091 091 |
According to the typical points marked in the curves, T1 of C2 is approximately 83 °C, while the values decrease to about 67 °C and 60 °C for C4 and C6, respectively. These results align with previous findings that as the activation degree increases, the cross-talk effects of gas generated from Li2MnO3 activation and electrolyte oxidation become more severe, rendering the SEI more susceptible to degradation due to its increased organic contents.25,26 To prove such explanations, DSC and XPS tests of the graphite anodes retrieved from the pouch cells are operated, as shown in Fig. S1 and S2 (ESI).† The first peak in the DSC curves is regarded as the thermal decomposition of the SEI on the anode surface.25 From the results it can be seen that the onset temperature of the first decomposition peak has decreased as the increase of activation degrees and more joule heats are released accordingly. The enhanced XPS peak intensity of ROCO2Li for the three samples rightfully confirm that the components of SEI can be influenced by the cross-talk effects as mentioned above. T2 for C2 and C4 are around 287 °C and 232 °C, respectively, while it has sharply decreased to about 174 °C for C6, indicating that the safety of the cell is strongly influenced by the activation degree of Li2MnO3. T3 for the three cells are about 360 °C, 452 °C, and 633 °C, suggesting that more severe exothermic chemical reactions occur during TR. Tmisc (corresponding to micro inner short-circuits with slight voltage drops) and Tsisc (severe inner short-circuits with severe voltage drops), introduced in our previous report, are also examined.23 Results show that Tmisc and Tsisc of all the three samples are quite similar, around 150 and 172 °C, consistent with the melting behavior of traditional PE-based separators.23
Comparing Tsisc and T2, we can find that for C2 and C4, T2 is much larger than Tsisc, meaning that the heats from the inner shorts are not enough to trigger the TR process, due to the relatively stable cathode materials. As for C6, Tsisc is quite similar to T2, implying that when massive inner-short circuits occur, the dT/dt has been approaching the point to trigger TR, because of the accumulation of extra heats from the activate cathode materials side. According to the temperature versus temperature rate curves in Fig. 2(c, f and i), at the temperature of 174 °C (T2 for C6), the temperature rates for C2 and C4 are about 1.5 and 2.1 °C min−1, both smaller than 60 °C min−1 for C6, implying that more severe exothermic side reactions will be triggered due to the higher activation degrees of the cathode materials below 200 °C and the cathode material instability play more significant roles in the so-called cask effects, among the cathode, anode and separator for cells with LLOs.27
The time ranges between key temperatures, reflecting the thermal stability of the cells from time scales, are also listed. The first parameter is Δt1, referring to the time range between Tmisc and T2. The values are approximately 33, 35, and 7 minutes for C2, C4, and C6, respectively, showing that the activation voltage of 4.6 V will significantly accelerate the accumulation of heats from the serial reactions. The second parameter is Δt2, corresponding to the time range between T2 and T3. This period is the main stage when most of the heats are released and determines the escape time in cell safety alerts. The Δt2 values for the three cells are about 1.0, 0.9 and 0.1 minutes, respectively. The much-decreased responding time before TR also confirms that the thermal stability of the cells are strongly influenced by the activation degrees. The severity of thermal–chemical reactions during this period can be also reflected by dT/dtmax (the maximum dT/dt). Results in Table 1 show that dT/dtmax is about 1768 °C min−1 for the cell with 4.2 V activation, 9140 °C min−1 for the cell with 4.4 V activation, and 20![[thin space (1/6-em)]](https://www.rsc.org/images/entities/char_2009.gif) 091 °C min−1 for the cell with 4.6 V activation. Clearly, a higher activation voltage results in more severe exothermic reactions, releasing a large amount of heat in a smaller time range.
091 °C min−1 for the cell with 4.6 V activation. Clearly, a higher activation voltage results in more severe exothermic reactions, releasing a large amount of heat in a smaller time range.
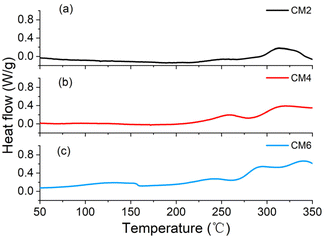
To verify the underlying mechanism of how the activation degree of the cathode material influences the safe property of the cells, thermal stability characterizations from the cathode material level are conducted. DSC curves are shown in Fig. 3. It can be observed that during the temperature range between 100 and 160 °C, there is a small exothermic peak for CM6, whereas the peak is almost unnoticeable for CM2 and CM4. It can be deduced that LLOs with the higher activation degree will become more active, inducing more exothermic side reactions, which probably combine the chemical reactions between the cathode material and adsorbed electrolytes and probably a small part of the cathode electrolyte interface (CEI) decompositions, which can also be discovered in tests of nicker-rich materials.28 XPS of the cathode materials are presented in Fig. S3 (ESI).† The slightly enhanced peak density of ROCO2Li signals may imply that thicker CEI are formed for the cathode material with the higher degree of activation. Besides, the DSC peak between 100 and 160 °C is rightfully nearly the temperature of T2 of C6 in ARC tests, implying the role of the cathode material in the heating accumulation to trigger TR. Additionally, the peak around 250 °C also shows a dependence on the activation voltages. The peak intensity is very small for CM2. The onset temperature is approximately 220 °C for CM4, higher than the 211 °C for CM6. The peaks at higher temperature ranges are also significantly influenced by the activation degrees. For CM2, the heat flow has turn to nearly zero at the end temperature of 350 °C, whereas the value is still very high for CM6 and an intermediate state for CM4. These results are also consistent with the changes in T3 and dT/dtmax observed in ARC test.
Information about the decomposition of the cathode materials during TR can be further collected by TG-MS and HT-XRD tests. Fig. 4 illustrates the TG-MS curves of the three electrode samples. From TG curves, we notice that there roughly exist two main weight loss stages, with the first one from about 180 to 320 °C and the second one from about 320 to 600 °C. The weight losses of the first stage are about 96.0%, 95.5% and 92.6% for CM2, CM4 and CM6 respectively, while the values have been further decreased to about 89.3%, 81.8% and 79.4%. It can be deduced that the increased activation degree will induce more severe reactions, leading to more weight loss during heating process. TG-MS in Fig. 4 can also provide the released gas information during TR, including about CO2 and O2, which are the typical characteristic signals of the decomposition of layered cathodes.29 No O2 signals are detected for CM2 andCM4, whereas two O2 release peaks are observed for CM6, which are located at around 260 °C and 400 °C. The peak locations rightfully correspond to the weight loss stage and two differential thermal analysis (DTA) peaks, evidencing the phase change process of the layered structure.30 Unlike O2, CO2 signals are detected for all samples, inferring that O2 released from CM2 and CM4 are likely to be consumed through redox reactions with carbon additives and/or PVDF.30,31 According to the results above, the decomposition process of the cathode materials influenced by the activation degree can be elucidated. During the temperature range from room temperature to about 180 °C, no obvious phases change but mild reactions inducing weight loss take place and the intensity can be enhanced by the activation degree. From 180 to 320 °C is the stage when the first severe decomposition occurs with the release of CO2, originating from the oxidative reactions between reductants and active oxygen from the structure. Besides, the signal of O2, solely caught by the MS of CM6, prove again that higher activation degrees induce less stability of the layered structure. The temperature scale from about 320 to 600 °C refers to the second main decomposition reactions stage with massive release of CO2. The signal intensity of CO2 and the weight loss again demonstrate that the structure degradation during the high temperature range of the TR process will be further strengthened by the activation degrees. Although the thermal stability is decreased as the increase of the activation degree, LLOs still have relatively higher stability than nickel-rich layered oxides.32,33 According to the DSC and TG-MS results of nickel-rich cathode materials reported, the first decomposition peak temperature is normally around 170–200 °C, lower than 230–250 °C of LLOs with 4.6 V activation, emphasizing another strength about LLOs except for the high specific capacity.
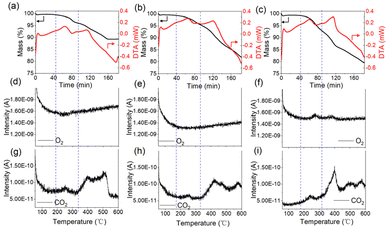 | ||
| Fig. 4 TG-MS curves of the samples (a, d and g) for CM2; (b, e and h) for CM4; (c, f and i) for CM6). | ||
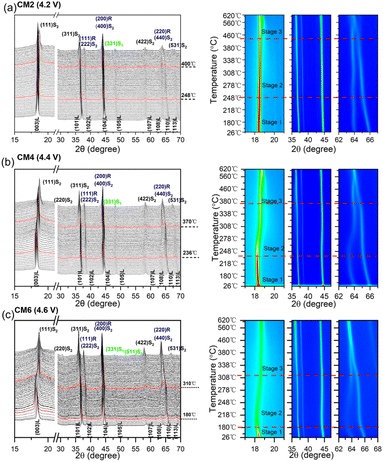
HT-XRD results in Fig. 5 illustrate the structure change of the cathode material with different activation degrees from room temperature to 600 °C. Similar to our previous report, the evolution of the layered structure during heating process can be divided into three stages.34 Stage 1 corresponds to the lattice expansion of the LLOs materials before phase change, as the (003) peaks will shift to low-angle region, caused by the increased thermal expansion of Li slabs during heating process.35 According to the shift degrees of 2θ, it can be inferred that the expansion of c-axis and the upper temperature to maintain layered structure for the cathode materials are significantly influenced by the activation degree of Li2MnO3. The upper temperature to maintain the layered structure for CM6 is about 180 °C, while the temperatures are about 236 °Cfor CM4 and 248 °C for CM2. It has been reported that larger thermal expansion of the layered structure normally means more formations of oxygen vacancy.35 Therefore, it can be assumed that the severe expansion of the layered structure may be inclined to cause more exothermic reactions, releasing more heats even in the early stage before phase change, consistent with the DSC and ARC results. Stage 2 refers to the layered phase transforms into the disordered spinel phase of LixMn2O4, as the (003)L peak fades along with the coalescence of the (108)L and (110)L peaks, resulting from the migration of transition metal ions into the octahedral sites of the Li layer.29 The onset transition temperatures are about 248, 236, and 180 °C for CM2, CM4, and CM6, respectively. This stage rightfully corresponds to the first fast weight in TG curves with concomitant release of CO2 for all three samples and O2 for CM6. Stage 3 is the period when the phases transformations are further developing, including the generation of the ordered spinel-type Mn2NiO4 (PDF 01-110) from the disordered spinel phase and NiO-type rock-salts phases (i.e., (200)R and (220)R) formed at higher temperature range.36 The onset temperature for CM6 is about 310 °C, much lower than 370 °C for CM4 and 400 °C for CM2. The decreased peak density of (003)L and enhanced peak densities of (111)S2 and (220)S2 for CM4 and CM6 again demonstrate that the higher activation degree of the layered structure will significantly reduce the structure stability and improve the redox activity of the cathode materials, through inducing the massive release of O2 from the severe phase transformations during high temperature range of TR process.
Conclusions
In this study, the TR process of the pouch cells based on the LLOs cathodes with different activation degrees are investigated. ARC tests show that when the cells are formed under the voltage of 4.6 V with Li2MnO3 phase in LLOs almost fully activated, T2 is only about 174 °C, much less than 232 °C for partially activated cells and 287 °C for non-activated cells. T3 increases from 360 to 452 and 633 °C and the dT/dtmax rises from 1768 to 9140 and 20![[thin space (1/6-em)]](https://www.rsc.org/images/entities/char_2009.gif) 091 °C min−1 accordingly. Combing with the tests results of DSC, XPS, TG-MS and HT-XRD, the mechanism that how the thermal stability of the cathode materials influence the TR process of the cells are further elucidated as below: first, at the early stage, due to the cross-talk effects of the cathode materials, SEI of the cells with higher activation degrees are more vulnerable to decompose, causing the cell to trigger self-heat generation at lower T1. Second, during the middle stage between T1 and T2, the interface reaction activity of the cathode material is significantly enhanced, owing to the large expansion of the c-axis distance of the LLOs material, especially when the cell is almost fully activated. As a result, the heats from the interface reactions and inner-shorts together trigger TR of the cells at much lower temperatures. For the cells with smaller activation degrees, they even need extra heats from the first phase change to trigger TR even when SISC already occurs inside. Third, during the late stage from T2 to T3, massive heats are released from the uncontrolled severe exothermic redox reactions. Results prove that the cathode material almost fully activated experiences the most severe phase changes and release most of oxidative O2, responsible for the strongly intensified exothermic redox reactions and the significantly increased T3 and dT/dtmax. According to the results above, moderate activation of LLOs seems to be a reasonable and practical application strategy, considering the balance between the high energy density and safety of the cells.
091 °C min−1 accordingly. Combing with the tests results of DSC, XPS, TG-MS and HT-XRD, the mechanism that how the thermal stability of the cathode materials influence the TR process of the cells are further elucidated as below: first, at the early stage, due to the cross-talk effects of the cathode materials, SEI of the cells with higher activation degrees are more vulnerable to decompose, causing the cell to trigger self-heat generation at lower T1. Second, during the middle stage between T1 and T2, the interface reaction activity of the cathode material is significantly enhanced, owing to the large expansion of the c-axis distance of the LLOs material, especially when the cell is almost fully activated. As a result, the heats from the interface reactions and inner-shorts together trigger TR of the cells at much lower temperatures. For the cells with smaller activation degrees, they even need extra heats from the first phase change to trigger TR even when SISC already occurs inside. Third, during the late stage from T2 to T3, massive heats are released from the uncontrolled severe exothermic redox reactions. Results prove that the cathode material almost fully activated experiences the most severe phase changes and release most of oxidative O2, responsible for the strongly intensified exothermic redox reactions and the significantly increased T3 and dT/dtmax. According to the results above, moderate activation of LLOs seems to be a reasonable and practical application strategy, considering the balance between the high energy density and safety of the cells.
Data availability
The data that support the findings of this study are available upon request from the corresponding author (Wei Quan, E-mail: quanwei@glabat.com). The data supporting this article have been included as part of the ESI.† Part of the raw data and processed data generated during the study are not publicly available due to privacy concerns related to participant confidentiality, but are stored securely in the China Automotive Battery Research Institute Co., Ltd. For readers interested in accessing the data, please provide a brief description of the requested data, the research purposes, and the intended use. Requests will be reviewed and, subject to any legal or ethical considerations, the data may be shared under a data-sharing agreement that complies with the policies of China Automotive Battery Research Institute Co., Ltd. Please note that due to the nature of the study, certain data collected from human participants cannot be shared. However, all methods and summary statistics necessary to understand and replicate the study findings are included in the article.Author contributions
Wei Quan and Jinghao Liu contributed equally to this work. Wei Quan: conceptualization, investigation, formal analysis, writing – review&editing. Jinghao Liu: investigation, formal analysis, drafting of manuscripts. Jinhong Luo: resources. Hangfan Dong: investigation. Zhimin Ren: resources. Guohua Li: resources. Xiaopeng Qi: resources, editing. Zilong Su: formal analysis, editing. Jiantao Wang: supervision.Conflicts of interest
There are no conflicts to declare.Acknowledgements
This work was supported by Low Cost Cathode Material (TC220H06P).Notes and references
- C. P. Grey and D. S. Hall, Nat. Commun., 2020, 11, 6279 CrossRef PubMed
.
- Y. Ding, Z. P. Cano, A. Yu, J. Lu and Z. Chen, Electrochem. Energy Rev., 2019, 2, 1–28 CrossRef
.
- H. Wang, K. Feng, P. Wang, Y. Yang, L. Sun, F. Yang, W.-Q. Chen, Y. Zhang and J. Li, Nat. Commun., 2023, 14, 1246 CrossRef PubMed
.
- Y. Chen, Y. Kang, Y. Zhao, L. Wang, J. Liu, Y. Li, Z. Liang, X. He, X. Li, N. Tavajohi and B. Li, J. Energy Chem., 2021, 59, 83–99 CrossRef
.
- J. Deng, C. Bae, A. Denlinger and T. Miller, Joule, 2020, 4, 511–515 CrossRef
.
- X. Feng, M. Ouyang, X. Liu, L. Lu, Y. Xia and X. He, Energy Storage Mater., 2018, 10, 246–267 CrossRef
.
- Q. Wang, L. Jiang, Y. Yu and J. Sun, Nano Energy, 2019, 55, 93–114 CrossRef
.
- J. Xie and Y.-C. Lu, Nat. Commun., 2020, 11, 2499 CrossRef CAS
.
- M. H. Rossouw, D. C. Liles and M. M. Thackeray, J. Solid State Chem., 1993, 104, 464–466 CrossRef
.
- K. A. Jarvis, Z. Deng, L. F. Allard, A. Manthiram and P. J. Ferreira, Chem. Mater., 2011, 23, 3614–3621 CrossRef
.
- T. Liu, J. Liu, L. Li, L. Yu, J. Diao, T. Zhou, S. Li, A. Dai, W. Zhao, S. Xu, Y. Ren, L. Wang, T. Wu, R. Qi, Y. Xiao, J. Zheng, W. Cha, R. Harder, I. Robinson, J. Wen, J. Lu, F. Pan and K. Amine, Nature, 2022, 606, 305–312 CrossRef PubMed
.
- H. Zhou, F. Xin, B. Pei and M. S. Whittingham, ACS Energy Lett., 2019, 4, 1902–1906 CrossRef
.
- X. Feng, Y. Gao, L. Ben, Z. Yang, Z. Wang and L. Chen, J. Power Sources, 2016, 317, 74–80 CrossRef
.
- Y. Li, Y. Bai, C. Wu, J. Qian, G. Chen, L. Liu, H. Wang, X. Zhou and F. Wu, J. Mater. Chem. A, 2016, 4, 5942–5951 RSC
.
- H. Liu, C. Du, G. Yin, B. Song, P. Zuo, X. Cheng, Y. Ma and Y. Gao, J. Mater. Chem. A, 2014, 2, 15640–15646 RSC
.
- B. Qiu, M. Zhang, L. Wu, J. Wang, Y. Xia, D. Qian, H. Liu, S. Hy, Y. Chen, K. An, Y. Zhu, Z. Liu and Y. S. Meng, Nat. Commun., 2016, 7, 12108 CrossRef CAS PubMed
.
- J. Zheng, M. Gu, J. Xiao, P. Zuo, C. Wang and J.-G. Zhang, Nano Lett., 2013, 13, 3824–3830 CrossRef CAS PubMed
.
- Z. Zhu, D. Yu, Y. Yang, C. Su, Y. Huang, Y. Dong, I. Waluyo, B. Wang, A. Hunt, X. Yao, J. Lee, W. Xue and J. Li, Nat. Energy, 2019, 4, 1049–1058 CrossRef CAS
.
- T. Lin, T. U. Schulli, Y. Hu, X. Zhu, Q. Gu, B. Luo, B. Cowie and L. Wang, Adv. Funct. Mater., 2020, 30, 1909192 CrossRef CAS
.
- H. Peng, S.-X. Zhao, C. Huang, L.-Q. Yu, Z.-Q. Fang and G.-D. Wei, ACS Appl. Mater. Interfaces, 2020, 12, 11579–11588 CrossRef CAS
.
- A. M. Pillai, P. S. Salini, B. John, S. Pillai, S. SarojiniAmma and T. D. Mercy, J. Alloys Compd., 2023, 938, 168363 CrossRef CAS
.
- G. Li, Z. Ren, H. Zhuo, C. Wang, B. Xiao, J. Liang, R. Yu, T. Lin, A. Li, T. Yu, W. Huang, A. Zhang, Q. Zhang, J. Wang and X. Sun, Energy Environ. Mater., 2023, 6, e12473 CrossRef CAS
.
- X. Qi, B. Liu, J. Pang, F. Yun, R. Wang, Y. Cui, C. Wang, K. Doyle-Davis, C. Xing, S. Fang, W. Quan, B. Li, Q. Zhang, S. Wu, S. Liu, J. Wang and X. Sun, Nano Energy, 2021, 84, 105908 CrossRef CAS
.
- X. Liu, D. Ren, H. Hsu, X. Feng, G.-L. Xu, M. Zhuang, H. Gao, L. Lu, X. Han, Z. Chu, J. Li, X. He, K. Amine and M. Ouyang, Joule, 2018, 2, 2047–2064 CrossRef CAS
.
- J. Wu, S. Weng, X. Zhang, W. Sun, W. Wu, Q. Wang, X. Yu, L. Chen, Z. Wang and X. Wang, Small, 2023, 19, 2208239 CrossRef CAS
.
- B. Rowden and N. Garcia-Araez, Energy Rep., 2020, 6, 10–18 CrossRef
.
- X. Feng, D. Ren, X. He and M. Ouyang, Joule, 2020, 4, 743–770 CrossRef CAS
.
- H. Zhao, Y. Bai, Y. Li, W. Zhao, H. Ren, X. Wang and C. Wu, Energy Storage Mater., 2022, 49, 409–420 CrossRef
.
- S.-K. Jung, H. Kim, S. H. Song, S. Lee, J. Kim and K. Kang, Adv. Funct. Mater., 2022, 32, 2108790 CrossRef CAS
.
- S.-M. Bak, K.-W. Nam, W. Chang, X. Yu, E. Hu, S. Hwang, E. A. Stach, K.-B. Kim, K. Y. Chung and X.-Q. Yang, Chem. Mater., 2013, 25, 337–351 CrossRef CAS
.
- M. Natali, M. Monti, D. Puglia, J. M. Kenny and L. Torre, Composites, Part A, 2012, 43, 174–182 CrossRef
.
- M. Akhilash, P. S. Salini, B. John, N. Supriya, S. Sujatha and T. D. Mercy, Ionics, 2023, 29, 983–992 CrossRef CAS
.
- Z. Cui and A. Manthiram, Angew. Chem., Int. Ed., 2023, 62, e202307243 CrossRef
.
- G. Li, Z. Ren, H. Zhuo, C. Wang, B. Xiao, J. Liang, R. Yu, T. Lin, A. Li, T. Yu, W. Huang, A. Zhang, Q. Zhang, J. Wang and X. Sun, Energy Environ. Mater., 2023, 6, e12473 CrossRef
.
- E. Lee, S. Muhammad, T. Kim, H. Kim, W. Lee and W.-S. Yoon, Adv. Sci., 2020, 7, 1902413 CrossRef PubMed
.
- C.-k. Lin, Y. Piao, Y. Kan, J. Bareño, I. Bloom, Y. Ren, K. Amine and Z. Chen, ACS Appl. Mater. Interfaces, 2014, 6, 12692–12697 CrossRef
.
Footnote |
| † Electronic supplementary information (ESI) available: Details of experimental procedures. See DOI: https://doi.org/10.1039/d4ra06355d |
| This journal is © The Royal Society of Chemistry 2024 |

