 Open Access Article
Detection of mercury(II) in aqueous media using bodipy-functionalized magnetic fluorescent sporopollenin†
Melike Bayraka,
Aysel Cimen a and
Ali Bilgic
 *b
*b
aDepartment of Chemistry, Kamil Ozdag Science Faculty, Karamanoglu Mehmetbey University, 70100, Karaman, Turkey
bVocational School of Technical Sciences, Karamanoglu Mehmetbey University, 70100, Karaman, Turkey. E-mail: alibilgic100@hotmail.com; Fax: +90 338 226 21 66; Tel: +90 338 226 21 69
First published on 14th October 2024
Abstract
Pollution from heavy metal ions has become a major issue worldwide. Water pollution, particularly with heavy metals like mercury, is a global problem. Developing environmentally friendly, low-cost, high-efficiency, sensitive, and selective sensors for the detection of mercury(II) ions in aqueous environments has attracted great interest in industry and academia. In this research paper, a bodipy-functionalized magnetic fluorescent MSp-TAB hybrid material was developed for detecting mercury(II) in aqueous media. The magnetic fluorescent MSp-TAB hybrid material was characterized using FT-IR, SEM, EDX, XRD, and TGA. We studied the influence of diverse factors such as contact time, temperature, and pH on the detection of Hg(II). The fluorometric study demonstrated that the developed magnetic-fluorescent hybrid material was sensitive/selective for Hg(II) ions in the absence and presence of interfering ions with a limit of detection (LOD) of 2.72 μM. In conclusion, the developed magnetic fluorescent MSp-TAB hybrid material has demonstrated its applicability and potential for accurate, sensitive, and practical detection of Hg(II) in tap water samples.
1. Introduction
The uncontrolled rapid development of technology and industry in our age has negative effects on the environment and society. These negativities create serious effects such as heavy metal ion pollution, especially on our ecosystems.1–3 Heavy metal ions that cause water pollution in our ecosystem are harmful because water affects all life forms immediately.4 In addition, the harmful effects of even trace amounts of heavy metals in aqueous masses are dangerous for human and ecosystem health.5,6 For heavy metals, mercury, lead, chromium, cadmium, and arsenic are ranked as priority heavy metals potentially harmful to public health due to their high toxicity.6 Among these heavy metals, mercury (Hg) is an important environmental pollutant due to its properties as a neurotoxic, teratogenic, mutagenic, and carcinogenic element with complex chemistry in the environment.7–9 The main sources of mercury in the environment and other anthropogenic sources are oil refineries, petrochemical plants,10 and businesses such as wastewater, hydrocarbon processing in gas plants, steel and iron factories, chlor–alkali industries, gold production, non-ferrous metal smelting, cement industries, coal, and fossil fuel combustion.11,12 In general, mercury exists in three popular forms: organic mercury (CH3Hg+), elemental mercury (Hg0), and inorganic mercury (Hg2+).12,13 Contamination by inorganic mercury compounds in these forms, especially mercury(II) derivatives, is a major hazard due to their highly toxic effects on humans.14 It accumulates in human tissues and damages the kidneys, digestive system, stomach, liver, capillaries, lungs, and heart.8,15–17 In addition, prolonged exposure to high levels of mercury can cause brain damage and death in humans.18–22 For these reasons, it is necessary to develop simple, economical, environmentally friendly, and sensitive methods for the determination of inorganic mercury(II).The conventional determination of inorganic mercury(II) is generally accomplished in specialized labs using electroanalytical techniques,23 cold vapor atomic absorption spectrometry,24 inductively coupled plasma atomic emission spectrometry,25 atomic fluorescence spectrometry,26 and inductively coupled plasma mass spectrometry.14,27 These methods enable accurate identification of mercury(II) at trace levels,14 but they are time-consuming, require complex sample determination steps, require specialized skilled operators and expensive equipment, and are generally not suitable for in situ detection of mercury(II).28–31 Therefore, the development of simple, accurate, economical, sensitive, environmentally friendly, specific, convenient, and portable analytical methods for field monitoring of mercury(II) is of great interest.14,31–33 Fluorescence-based chemosensors in particular are favoured for their unique features such as low cost, direct visual detection, high sensitivity, and fast response.34–37 In recent years, many fluorescent-based chemosensors have been developed for the sensitive/selective detection of Hg(II) ions.37–43 Within fluorescence-based chemosensors, there's a rising trend in utilizing environmentally friendly hybrid materials. Sporopollenin, possessing such qualities, stands out as a natural and eco-friendly hybrid material. Studies on the successful removal and removal detectionof heavy metals using sporopollenin-based functional products are ongoing.37,44–48 Sporopollenin (Sp) is called, the outer shell of plant pollen left over after the sporoplasm core is extracted, and is regarded as one of the most resistant biopolymers found in nature.49–51 Sp has properties such as ideal grain size, regular structure, cross-linked, biological, chemical, physical properties, and thermal stability.37,52,53 Although Sp biopolymers demonstrate excellent stability even after prolonged exposure to a wide range of organic and inorganic chemicals, the practical separation of Sp from water and solutions remains a significant challenge.37,54 To solve this issue, sporopollenin can be readily functionalized and modified with iron oxide nanoparticles55 due to the availability of a substantial internal cavity.56,57 The incorporation of Fe3O4 into the Sp confers upon it the capacity to be readily separated from the solution environment using a magnetic field, obviating the necessity for the use of centrifugation and filtering processes.37,58 Furthermore, the backbone of sporopollenin has oxygen, hydrogen, and carbon with branched and straight aliphatic chains57,59 and its honeycomb-like structure makes it an effective host for interaction with different nanoparticles, adsorbates, and compounds.57,60 The surface of the sporopollenin immobilized with fluorescent compounds can also be utilized for the efficient recognition of heavy metal ions. However, the idea of using magnetic fluorescent sporopollenin is rather limited in the literature.37,61 Bodipy's are outstanding dyes among fluorescent compounds due to their great stability, strong quantum yield, sharp emission band, and ability to be seen with ultraviolet light and the naked eye.47,62–64
Based on the details provided in the preceding paragraphs, a new magnetic fluorescent MSp-TAB hybrid material has been created for the selective and sensitive detection of Hg(II) ions in aqueous settings. The fluorescent surface of the prepared hybrid material was systematically characterized by different techniques. The influence of pH, response time, and temperature on the detection of Hg(II) ions using magnetic fluorescent MSp-TAB hybrid material was also investigated. The prepared eco-friendly magnetic fluorescence hybrid material will guide and direct future research.
2. Experimental section
2.1. Materials used
All chemicals and materials utilized in the study were employed in their original state, without further purification, meeting analytical grade standards. FeCl3·6H2O (99%), dichloromethane (anhydrous, ≥99.8%), HNO3 (ACS reagent, ≥90.0%), CH3OH (≥99.9%), (C2H5)2O (≥99.0%), toluene (99.8%), NaOH (≥98%), HCl (37%), ethanol (99%), and ammonia (25%) were acquired from Merck (Darmstadt, Germany). 1-(4-Amino-2-hydroxyphenyl)ethan-1-one (AHAP) were purchased from Maybridge (England). Potassium dichromate, AgNO3, FeCl2·4H2O (>99%), 2,4-dimethyl-3-ethylpyrrole, chloroform-d (99.8 atom %D), acetone, N-[3-(trimethoxysilyl)propyl]ethylenediamine (TPED, 97%), Lycopodium clavatum sporopollenin (particle size 25 μm), triethylamine (TEA, 99.5%), and 1,3,5-benzenetricarbonyl chloride were supplied from Sigma-Aldrich (Product of Germany). The cation solutions utilized in the sensor investigation were perchlorate salts procured from Merck (Darmstadt, Germany). The devices used are given in the ESI.†2.2. Synthesis of magnetic sporopollenin (MSp)
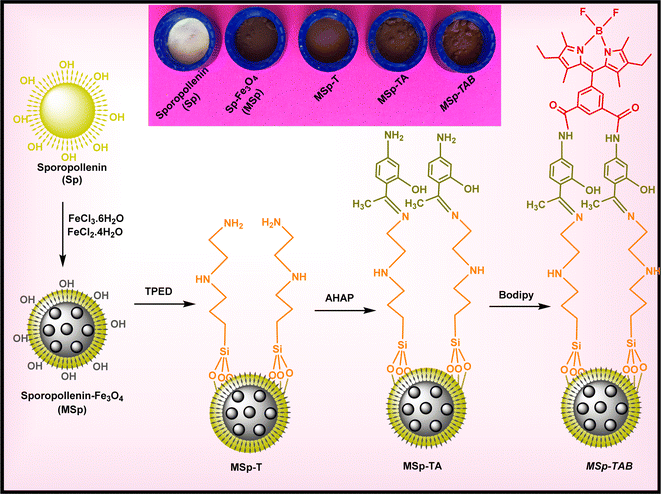
The synthesis approach for magnetic sporopollenin (MSp) was conducted in a manner akin to the prior method.54,65 In summary: 3.05 g of FeCl3·6H2O and 1.12 g of FeCl2·4H2O salts were added to the 0.25 L reaction vessel, and then 100 mL of purified water was supplemented into this reaction vessel. The salts present in the resulting solution underwent sonication for 10 minutes to ensure their complete dissolution. After complete dissolution, Sp (1.0 g) was added to this reaction vessel and stirred for 30 min under laboratory conditions, and 5 mL of NH4OH (28%) was added and mixed again at 550 rpm for another 30 min at 90 °C. After mixing was finished, it was left to cool, and the MSp obtained was collected using a magnet and washed with plenty of water. This procedure was applied 3 times. The formed magnetic sporopollenins (MSp) were kept in an oven at 70 °C until they were modified with TPED. A schematic representation of the possible structure of the prepared MSp is shown in Fig. 1.2.3. Preparation of magnetic MSp-T
All of the resulting MSp and 4.8 mL of TPED compound were supplemented into a 0.1 L reaction vessel containing acetonitrile (0.05 L). The mixture was subjected to continuous stirring and refluxed for a duration of 72 hours. Following the completion of the reaction time, the mixture was allowed to cool for 2 hours, after which MSp-T was retrieved using a magnet. The MSp-T was thoroughly washed with CH3OH (30 mL), H2O water (50 mL), and finally C2H5OH (30 mL), and then kept in an oven at 70 °C until its reaction with the AHAP compound. A schematic representation of the possible structure of the prepared MSp-T is demonstrated in Fig. 1.2.4. Preparation of magnetic MSp-TA
All of the obtained by the above method and 0.5 g of AHAP compound were supplemented into a 0.1 L reaction vessel containing acetonitrile (0.05 L). This resulting suspension solution was refluxed for 72 h. Once the reaction reached completion, it was permitted to cool down, and the resulting product, MSp-TA, was extracted from the reaction vessel using a magnet. The obtained product (MSp-TA) underwent thorough washing with CH3OH (50 mL), distilled H2O (50 mL), and finally C2H5OH (20 mL). Subsequently, it was placed in an oven at 70 °C, awaiting its reaction with the bodipy dye. A schematic representation of the possible structure of the prepared MSp-TA is demonstrated in Fig. 1.2.5. Preparation of magnetic fluorescent MSp-TAB hybrid material
The synthesis procedure of the fluorescent bodipy compound used in the study was carried out and characterized as in our previous studies.66–68 To synthesize magnetic fluorescent MSp-TAB hybrid material, firstly, all of the MSp-TA obtained was supplemented into a 0.1 L reaction vessel containing 50 mL of acetonitrile, and then 0.2 g of bodipy dye was added to this reaction mixture. The mixture underwent refluxing for a duration of 72 hours. Once the reaction concluded, it was cooled, and the resultant magnetic-fluorescent hybrid material was extracted from the reaction vessel using a magnet. The resulting product (magnetic fluorescent MSp-TAB hybrid material) was thoroughly washed with CH3OH, distilled H2O, and C2H5OH. A schematic representation of the possible structure of the magnetic fluorescent MSp-TAB hybrid material is shown in Fig. 1.2.6. Metal ion recognition and reuses studies
For studies of the detection of cation, firstly, 0.15 g L−1 of the as-prepared magnetic fluorescent MSp-TAB hybrid material was added to 250 mL beakers containing 100 mL EtOH/H2O (30/70: v/v). The resulting suspension was sonicated for 15 min to ensure homogeneous dispersion of the magnetic fluorescent MSp-TAB hybrid material in the suspension mixture. Except for Ag(I) (AgNO3) and Cr(VI) K2Cr2O7, standard solutions of 1 × 10⁻² M were prepared from the perchlorate salt of the cation ions. The cation solution (1 × 10⁻⁴ M, 0.3 mL) was poured into a centrifuge tube containing the magnetic fluorescent hybrid material solution (2.7 mL). The resulting suspensions were mixed for 60 minutes. Three repeated spectra were obtained at room temperature using a fluorescence spectrometer. Emission spectra were measured over the wavelength range 460–650 nm under 350 nm excitation.3. Results and discussions
3.1. Characterizations
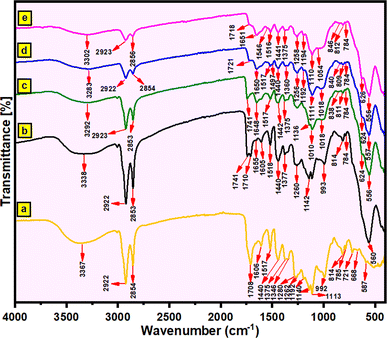
![[double bond, length as m-dash]](https://www.rsc.org/images/entities/char_e001.gif) O) groups), and 1440 cm−1 (the bending vibration of C–H).44–46,53,69 In the FT-IR spectrum of magnetic sporopollenin (MSp) (Fig. 2b), the new absorption peak at 560 cm−1 represents the stretching vibration of the Fe–O bond. The FT-IR spectrum of MSp-T obtained from the modification of TPED compound on the MSp surface is shown in Fig. 2c and the new peak at 1648 cm−1 (N–H) represents amine groups. In addition, Si–O and C–N stretching vibrations are observed at 1018 cm−1 and 1256 cm−1, respectively (Fig. 2c). In the FT-IR spectrum of MSp-TA (binding of AHAP compound to the MSp-T surface) shown in Fig. 2d, the C
O) groups), and 1440 cm−1 (the bending vibration of C–H).44–46,53,69 In the FT-IR spectrum of magnetic sporopollenin (MSp) (Fig. 2b), the new absorption peak at 560 cm−1 represents the stretching vibration of the Fe–O bond. The FT-IR spectrum of MSp-T obtained from the modification of TPED compound on the MSp surface is shown in Fig. 2c and the new peak at 1648 cm−1 (N–H) represents amine groups. In addition, Si–O and C–N stretching vibrations are observed at 1018 cm−1 and 1256 cm−1, respectively (Fig. 2c). In the FT-IR spectrum of MSp-TA (binding of AHAP compound to the MSp-T surface) shown in Fig. 2d, the C![[double bond, length as m-dash]](https://www.rsc.org/images/entities/char_e001.gif) N stretching vibration represents the absorption peak at 1721 cm−1. The absorption peak (Fig. 2d) at 1517 cm−1 represents the aromatic stretching (C
N stretching vibration represents the absorption peak at 1721 cm−1. The absorption peak (Fig. 2d) at 1517 cm−1 represents the aromatic stretching (C![[double bond, length as m-dash]](https://www.rsc.org/images/entities/char_e001.gif) C) groups. In the FT-IR spectra of the magnetic fluorescent MSp-TAB hybrid material (Fig. 2e), the new peaks at 2923–2856 cm−1 (the aliphatic CH stretching), 1546 cm−1 (aromatic C
C) groups. In the FT-IR spectra of the magnetic fluorescent MSp-TAB hybrid material (Fig. 2e), the new peaks at 2923–2856 cm−1 (the aliphatic CH stretching), 1546 cm−1 (aromatic C![[double bond, length as m-dash]](https://www.rsc.org/images/entities/char_e001.gif) C bending), 1516 cm−1 (aromatic C
C bending), 1516 cm−1 (aromatic C![[double bond, length as m-dash]](https://www.rsc.org/images/entities/char_e001.gif) C stretching), and 1375 cm−1 (C–N stretching vibrations) represent. In addition, it represents Si–O–Si stretching (peaks at 1110 cm−1 and 1054 cm−1) and Fe–O bending vibrations (peaks at 626 cm−1 and 556 cm−1) (Fig. 2e). Apart from the spectral alterations mentioned earlier, the successful synthesis of the intended magnetic fluorescent MSp-TAB hybrid material is affirmed by variations in the intensity of additional characteristic peaks, peak shifts, and the appearance of newly formed peaks, as depicted in Fig. 2e.
C stretching), and 1375 cm−1 (C–N stretching vibrations) represent. In addition, it represents Si–O–Si stretching (peaks at 1110 cm−1 and 1054 cm−1) and Fe–O bending vibrations (peaks at 626 cm−1 and 556 cm−1) (Fig. 2e). Apart from the spectral alterations mentioned earlier, the successful synthesis of the intended magnetic fluorescent MSp-TAB hybrid material is affirmed by variations in the intensity of additional characteristic peaks, peak shifts, and the appearance of newly formed peaks, as depicted in Fig. 2e.
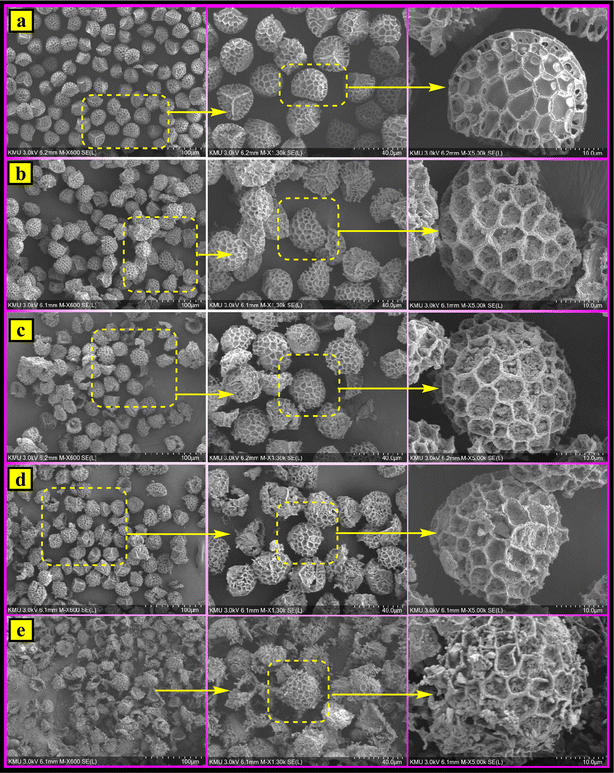 | ||
| Fig. 5 SEM images for (a) the Sp, (b) MSp, (c) MSp-T, (d) MSp-TA and (e) the magnetic fluorescent MSp-TAB hybrid material. | ||
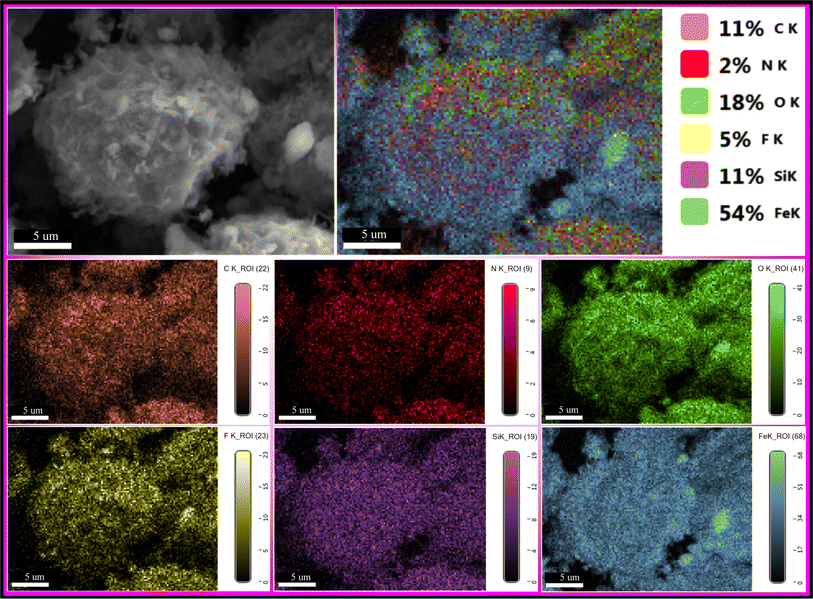
The elemental compositions of the samples prepared at each stage were determined via EDX, and the obtained EDX results are given in Fig. 6a–e. The main element compositions of the prepared samples in Fig. 6a–e, as seen in the atomic and weight percentage data, confirm that the materials prepared at each stage were successfully prepared. Moreover, the energy dispersive X-ray (EDX) mapping for different elements (C, N, O, F, Si, and Fe) on the prepared magnetic fluorescent MSp-TAB hybrid material in Fig. 7 confirms the successful preparation of the MSp-TAB.
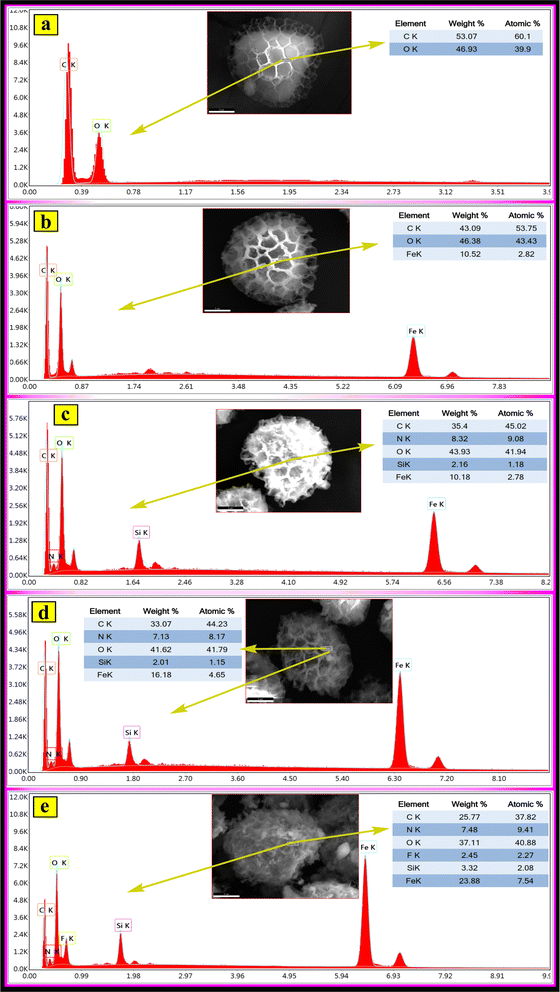 | ||
| Fig. 6 EDX results of (a) the Sp, (b) MSp, (c) MSp-T, (d) MSp-TA and (e) the magnetic fluorescent MSp-TAB hybrid material. | ||
3.2. Metal ion detection studies
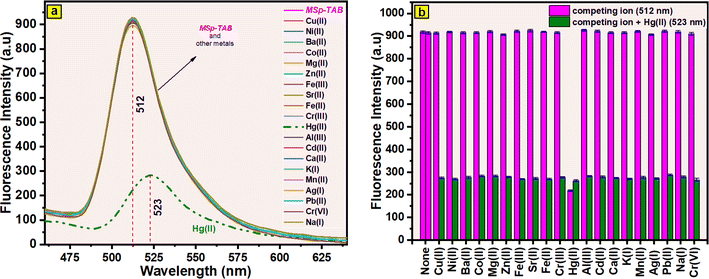
The selectivity of the produced magnetic fluorescent MSp-TAB hybrid material for Hg(II) was confirmed by the addition of other cations (cations in Fig. 8b) at twice the concentration. The suspension samples (MSp-TAB + cation and MSp-TAB + cation + Hg(II)) were allowed to equilibrate for 120 min and fluorescence spectra were recorded. The fluorescence intensities obtained from the fluorescence spectra in the range of 512 nm and 523 nm are given as a column graph in Fig. 8b. As shown in Fig. 8b, there was no interference in the detection of Hg(II). Consequently, the presence of cations does not influence the fluorescence detection system, thus affirming MSp-TAB's potential as a selective fluorescence sensor for Hg(II). After the addition of Hg(II), the wavelength was found to shift from 512 nm to 523 nm. The findings indicated that the presence of competitive cations did not notably impact the detection of Hg(II) by MSp-TAB. The excellent selectivity of MSp-TAB for Hg(II) and the lack of interference from other cations were the main findings of the fluorescence competition cation studies. This selectivity can be attributed to the intricate interactions between mercury(II) ions and the multi-amino groups and hydroxyl units present on the magnetic fluorescent MSp-TAB hybrid material surface. Both the donor atom cage enhances electron donation, and its diameter is well-suited for effectively binding mercury(II) ions.
The fluorescence response of suspension mixtures of MSp-TAB and Hg(II) + MSp-TAB (in H2O/C2H5OH (3/7)) at dissimilar temperatures (15 °C, 25 °C, 35 °C, and 45 °C) was researched, and the results obtained are given in Fig. S2b† (512–523 nm). The cation-free MSp-TAB suspension (bright neon pink (512 nm)) in Fig. S2b† shows that temperature does not affect fluorescence intensity. After the addition of mercury cation, the 523 nm fluorescence intensities of MSp-TAB + Hg(II) suspension mixtures (Fig. S2b† green color) show that the fluorescence intensity decreases with increasing temperature. Based on these results, the decline in fluorescence intensity as temperature rises could be attributed to the expedited complexation of Hg(II) ions with the generated magnetic fluorescent MSp-TAB hybrid material.
The reaction time against mercury(II) cations was also examined for the prepared magnetic fluorescent MSp-TAB hybrid material. Changes in fluorescence intensity were monitored between 512 nm and 523 nm to determine MSp-TAB and MSp-TAB + Hg(II) response times (1–180 min). The results obtained are given in Fig. S2c.† The results showed no change in the fluorescence emission of the MSp-TAB suspension (bright neon pink colour (512 nm) in Fig. S2c†). On the other hand, it showed that the interaction between MSp-TAB and Hg(II) was completed in 25 min. After this minute, no difference in fluorescence intensity was observed.
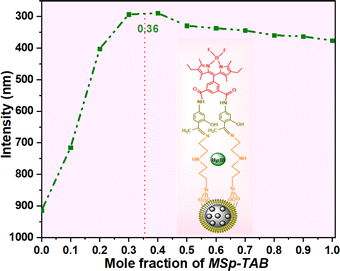
![[thin space (1/6-em)]](https://www.rsc.org/images/entities/char_2009.gif) :
:![[thin space (1/6-em)]](https://www.rsc.org/images/entities/char_2009.gif) 1 (ligand
1 (ligand![[thin space (1/6-em)]](https://www.rsc.org/images/entities/char_2009.gif) :
:![[thin space (1/6-em)]](https://www.rsc.org/images/entities/char_2009.gif) metal) ratio, with a maximum value of 0.32 on the Job's plot graph (Fig. 9).
metal) ratio, with a maximum value of 0.32 on the Job's plot graph (Fig. 9).
When Hg(II) cation (5–100 μM) was added to the magnetic fluorescent MSp-TAB hybrid detection system, the fluorescence intensity at 523 nm gradually decreased. It was investigated with the commonly used Limit of Detection (LOD) and the equation LOD = 3S1/S was used.66,67 Similar to prior research,37 the standard deviation of blank measurements was determined by conducting 30 fluorescence spectrum measurements of MSp-TAB. To calculate the slope from the obtained data, the plots of fluorescence intensity ratio (I0/I) at 523 nm versus Hg(II) concentration were used (Fig. S3†). The detection limit value for Hg(II) cation using MSp-TAB is 2.72 μM. In addition, the limit of detection (LOD) has been assessed in relation to sensors employing alternative methods and materials documented in previous studies (refer to Table 1). Compared to numerous prior studies, the magnetic fluorescent MSp-TAB hybrid exhibits notably low detection limits, suggesting its potential utility in detecting Hg(II) cations in water.
| Probe | Technique | Linear range (μM) | LOD (μM) | Ref. |
|---|---|---|---|---|
| CA–AA–DTZ membrane | Colorimetric | 15–50 | 15 | 75 |
| Thiophene based Schiff base | Fluorimetry | — | 20 | 76 |
| A thio-urea based chromogenic and fluorogenic chemosensor | Fluorimetry and colorimetry | 10–100 | 11.14 | 77 |
| N–GQDs | Fluorimetry | 20–100 | 0.42 | 78 |
| Rhodamine–glyoxylic acid | Fluorimetry | 5–200 | 1.0 | 79 |
| N,S/C dots | Fluorimetry | 0–40 | 2.0 | 80 |
| Chlorophyll functional Ag NPs | Colorimetry | 0.1–200 | 2.7 | 81 |
| Probe JUTH | Fluorimetry | — | 15 | 82 |
| Herval based Ag NPs | Electrochemical | 10–25 | 8.43 | 83 |
| MS-Sp-P[5]-bodipy | Fluorimetry and colorimetry | 1–150 | 0.06 | 37 |
| MSp-P[5]-EN-B | Fluorimetry and colorimetry | 1–100 | 0.33 | 43 |
| MMIP | Fluorimetry | 0–20 | 6.37 | 84 |
| Gold nanoprobe | Colorimetry | 5–100 | 5.0 | 85 |
| PNBS–CQDs–Fe2+ | Fluorimetry | 25–1500 | 5.0 | 86 |
| MSp-TAB | Fluorimetry and colorimetry | 5–100 | 2.72 | Present work |
The reusability of the magnetic fluorescent MSp-TAB hybrid material was evaluated, and the obtained results (Fig. S4†) and their description are given in the ESI.†
4. Conclusions
Briefly, in this work, we have shown a simple and cost-effective synthesis strategy to synthesize magnetic fluorescence MSp-TAB hybrid material, and this strategy has demonstrated its potential to selectively and sensitively detect Hg(II) in aqueous media. FT-IR, SEM, EDX, XRD, and TGA were used to characterize the magnetic fluorescent MSp-TAB hybrid material. Excellent selectivity with a wide pH range and a response time of less than 30 minutes was demonstrated by studying the influence of diverse factors such as temperature, pH, and contact time on mercury(II) detection. MSp-TAB seems appropriate for detecting Hg(II) ions using the fluorometric method. This Hg(II) magnetic fluorescent hybrid material sensor achieved a LOD as low as 2.72 μM. It is believed that the prepared magnetic fluorescent MSp-TAB hybrid material will find great application in aqueous solutions and real environmental analysis, and we think that it will be an example for future research.Data availability
Data are available upon request from the authors.Author contributions
Melike Bayrak: conceptualization, methodology, investigation, visualization, synthesis of sensor material, application experiments, writing – original draft, synthesis of application experiments. Aysel Cimen: software, modelling review & editing, project administration, Ali Bilgic: supervision, conceptualization, writing – review & editing, synthesis of application experiments, instrumental resources.Conflicts of interest
The authors declare that they do not have any known competing financial interests or personal relationships that might have influenced the findings reported in this paper.Acknowledgements
The authors express their gratitude to the Scientific Research Project Commission of Karamanoğlu Mehmetbey University for their financial assistance (BAP-grant number 07-D-23). This manuscript constitutes a portion of Melike Bayrak's PhD thesis.References
- Z. Gul, S. Ullah, S. Khan, H. Ullah, M. U. Khan, M. Ullah, S. Ali and A. A. Altaf, Crit. Rev. Anal. Chem., 2024, 54, 44 CrossRef CAS PubMed.
- Q. Wu, H. Zhou, N. F. Tam, Y. Tian, Y. Tan, S. Zhou, Q. Li, Y. Chen and J. Y. Leung, Mar. Pollut. Bull., 2016, 104, 153 CrossRef CAS PubMed.
- E. Khan, Int. J. Environ. Anal. Chem., 2023, 103, 8890 CrossRef CAS.
- C. R. Thara and B. Mathew, Talanta, 2024, 268, 125278 CrossRef CAS PubMed.
- S. Paz, C. Rubio, I. Frías, Á. J. Gutiérrez, D. González-Weller, V. Martín, C. Revert and A. Hardisson, Chemosphere, 2019, 218, 879 CrossRef CAS PubMed.
- S. Patra, A. K. Golder and R. V. Uppaluri, Results Opt., 2023, 11, 100411 CrossRef.
- C.-C. Bi, X.-X. Ke, X. Chen, R. Weerasooriya, Z.-Y. Hong, L.-C. Wang and Y.-C. Wu, Anal. Chim. Acta, 2020, 1100, 31 CrossRef CAS PubMed.
- J. Yang, L. Feng, J. Liu, S. Li, N. Li and X. Zhang, Sens. Actuators, B, 2024, 398, 134697 CrossRef CAS.
- M. Gochfeld, Ecotoxicol. Environ. Saf., 2003, 56, 174 CrossRef CAS PubMed.
- T. A. Saleh, G. Fadillah, E. Ciptawati and M. Khaled, TrAC, Trends Anal. Chem., 2020, 132, 116016 CrossRef CAS.
- L. Wang, D. Hou, Y. Cao, Y. S. Ok, F. M. Tack, J. Rinklebe and D. O'Connor, Environ. Int., 2020, 134, 105281 CrossRef CAS PubMed.
- N. C. Pomal, K. D. Bhatt, K. M. Modi, A. L. Desai, N. P. Patel, A. Kongor and V. Kolivoška, J. Fluoresc., 2021, 31, 635 CrossRef CAS PubMed.
- N. R. Jyothi and N. A. M. Farook, Heavy Metal Toxicity in Public Health, 2020, vol. 1 Search PubMed.
- S. Jimenez-Falcao, A. Villalonga, J. Parra-Nieto, A. Llopis-Lorente, P. Martinez-Ruiz, R. Martinez-Manez and R. Villalonga, Microporous Mesoporous Mater., 2020, 297, 110054 CrossRef CAS.
- V. Katseli, N. Thomaidis, A. Economou and C. Kokkinos, Sens. Actuators, B, 2020, 308, 127715 CrossRef CAS.
- C. M. Carvalho, E.-H. Chew, S. I. Hashemy, J. Lu and A. Holmgren, J. Biol. Chem., 2008, 283, 11913 CrossRef CAS PubMed.
- T. W. Clarkson and L. Magos, Crit. Rev. Toxicol., 2006, 36, 609 CrossRef CAS PubMed.
- Y. Zhou, G. Chen, C. Ma, J. Gu, T. Yang, L. Li, H. Gao, Y. Xiong, C. Zhu and A. Hu, Dyes Pigm., 2024, 222, 111845 CrossRef CAS.
- F. Wang and J. Zhang, Chin. Sci. Bull., 2013, 58, 141 CrossRef CAS.
- E. Babaee, A. Barati, M. B. Gholivand, A. A. Taherpour, N. Zolfaghar and M. Shamsipur, J. Hazard. Mater., 2019, 367, 437 CrossRef CAS PubMed.
- B.-B. Wang, J.-C. Jin, Z.-Q. Xu, Z.-W. Jiang, X. Li, F.-L. Jiang and Y. Liu, J. Colloid Interface Sci., 2019, 551, 101 CrossRef CAS PubMed.
- F. Yan, D. Shi, T. Zheng, K. Yun, X. Zhou and L. Chen, Sens. Actuators, B, 2016, 224, 926 CrossRef CAS.
- A. L. Squissato, D. P. Rocha, E. S. Almeida, E. M. Richter and R. A. Munoz, Electroanalysis, 2018, 30, 20 CrossRef CAS.
- I. L. Almeida, M. D. Oliveira, J. B. Silva and N. M. Coelho, Microchem. J., 2016, 124, 326 CrossRef CAS.
- B. B. A. Francisco, A. A. Rocha, P. Grinberg, R. E. Sturgeon and R. J. Cassella, J. Anal. At. Spectrom., 2016, 31, 751 RSC.
- Y. Li, Z. Zhu, H. Zheng, L. Jin and S. Hu, J. Anal. At. Spectrom., 2016, 31, 383 RSC.
- J. Zhou, Y. Tian, X. Wu and X. Hou, Microchem. J., 2017, 132, 319 CrossRef CAS.
- Y. Xuan, X. Li, C. Yan and G. Wang, Spectrochim. Acta, Part A, 2023, 293, 122479 CrossRef CAS PubMed.
- K. Leopold, M. Foulkes and P. Worsfold, Anal. Chim. Acta, 2010, 663, 127 CrossRef CAS PubMed.
- G. Wang, Y. Lu, C. Yan and Y. Lu, Sens. Actuators, B, 2015, 211, 1 CrossRef CAS.
- Z. Wang, Y. Zhang, J. Yin, Y. Yang, H. Luo, J. Song, X. Xu and S. Wang, ACS Sustain. Chem. Eng., 2020, 8, 12348 CrossRef CAS.
- M. L. Firdaus, A. Aprian, N. Meileza, M. Hitsmi, R. Elvia, L. Rahmidar and R. Khaydarov, Chemosensors, 2019, 7, 25 CrossRef CAS.
- J. G. Kelly, F. X. Han, Y. Su, Y. Xia, V. Philips, Z. Shi, D. L. Monts, S. T. Pichardo and K. Xia, Water, Air, Soil Pollut., 2012, 223, 2361 CrossRef CAS.
- P. Ozmen, Z. Demir and B. Karagoz, Eur. Polym. J., 2022, 162, 110922 CrossRef CAS.
- N. Choudhury, M. Meghwal and K. Das, Food Front., 2021, 2, 426 CrossRef CAS.
- C.-C. Chang, S. Lin, S.-C. Wei, C.-Y. Chen and C.-W. Lin, Biosens. Bioelectron., 2011, 30, 235 CrossRef CAS PubMed.
- A. Bilgic and Z. Aydin, J. Colloid Interface Sci., 2024, 657, 102 CrossRef CAS PubMed.
- R. Thekkathu, D. Ashok, P. K. Ramkollath, S. Neelakandapillai, L. P. Kurishunkal, M. P. Yadav and N. Kalarikkal, Chem. Phys. Lett., 2020, 742, 137147 CrossRef CAS.
- Y. Gu, G. Meng, M. Wang, Q. Huang, C. Zhu and Z. Huang, Sci. China Mater., 2015, 58, 550 CrossRef CAS.
- S. Ali, M. Mansha, N. Baig and S. A. Khan, Nanomaterials, 2022, 12, 1249 CrossRef CAS PubMed.
- P. A. Panchenko, A. V. Efremenko, A. S. Polyakova, A. V. Feofanov, M. A. Ustimova, Y. V. Fedorov and O. A. Fedorova, Biosensors, 2022, 12, 770 CrossRef CAS PubMed.
- N. K. Choudhary, L. L. Mittapelli, P. K. Roy, G. Das, M. Mandal and K. R. Gore, Spectrochim. Acta, Part A, 2023, 285, 121887 CrossRef CAS PubMed.
- A. Bilgic, A. Cimen, M. Bayrak and A. N. Kursunlu, Mater. Today Sustain., 2024, 25, 100696 Search PubMed.
- A. Bilgic, J. Inst. Sci. Technol., 2022, 12, 324 Search PubMed.
- A. Bilgic, Colloids Surf., A, 2021, 631, 127658 CrossRef CAS.
- A. Bilgic, A. Cimen, E. Bastug and A. N. Kursunlu, Chem. Eng. Res. Des., 2022, 178, 61 CrossRef CAS.
- A. Bilgic, A. Cimen, A. N. Kursunlu and H. S. Karapınar, Microporous Mesoporous Mater., 2022, 330, 111600 CrossRef CAS.
- A. Çimen, A. Bilgiç, A. N. Kursunlu, İ. H. Gübbük and H. İ. Uçan, Desalin. Water Treat., 2014, 52, 4837 CrossRef.
- Y. A. Maruthi and S. Ramakrishna, Int. J. Biol. Macromol., 2022, 222, 2957 CrossRef CAS PubMed.
- M. Lecoeuche, J. Borovička, A. K. Dyab and V. N. Paunov, RSC Adv., 2024, 14, 10280 RSC.
- K. Yilmaz, I. H. Gubbuk and E. M. Cagil, Macromol. Res., 2024, 32, 45 CrossRef CAS.
- M. A. Kamboh, W. A. W. Ibrahim, H. R. Nodeh, M. M. Sanagi and S. T. H. Sherazi, New J. Chem., 2016, 40, 3130 RSC.
- M. A. Kamboh, S. S. Arain, A. H. Jatoi, B. Sherino, T. S. Algarni, W. A. Al-Onazi, A. M. Al-Mohaimeed and S. Rezania, Environ. Res., 2021, 201, 111588 CrossRef CAS PubMed.
- Ü. Ecer, T. Şahan, A. Zengin and İ. H. Gubbuk, Environ. Sci. Pollut. Res., 2022, 29, 79375–79387 CrossRef PubMed.
- N. Malhotra, J.-S. Lee, R. A. D. Liman, J. M. S. Ruallo, O. B. Villaflores, T.-R. Ger and C.-D. Hsiao, Molecules, 2020, 25, 3159 CrossRef CAS PubMed.
- N. F. Ahmad, M. A. Kamboh, H. R. Nodeh, S. N. B. A. Halim and S. Mohamad, Environ. Sci. Pollut. Res., 2017, 24, 21846 CrossRef CAS PubMed.
- N. Mosleh, M. Najmi, E. Parandi, H. R. Nodeh, Y. Vasseghian and S. Rezania, Chemosphere, 2022, 300, 134461 CrossRef CAS PubMed.
- M. Fayazi, D. Afzali, M. Taher, A. Mostafavi and V. Gupta, J. Mol. Liq., 2015, 212, 675 CrossRef CAS.
- J. M. Ageitos, S. Robla, L. Valverde-Fraga, M. Garcia-Fuentes and N. Csaba, Polymers, 2021, 13, 2094 CrossRef CAS PubMed.
- A. K. Dyab, M. A. Mohamed, N. M. Meligi and S. K. Mohamed, RSC Adv., 2018, 8, 33432 RSC.
- A. Bilgic, A. Cimen, M. Bayrak and A. N. Kursunlu, Mater. Today Sustain., 2024, 25, 100696 Search PubMed.
- A. N. Kursunlu and C. Baslak, Tetrahedron Lett., 2018, 59, 1958 CrossRef CAS.
- A. N. Kursunlu and E. Guler, J. Lumin., 2014, 145, 608 CrossRef.
- A. Gul, M. Oguz, A. N. Kursunlu and M. Yilmaz, Dyes Pigm., 2020, 176, 108221 CrossRef CAS.
- H. Chen, Y. Li, S. Wang and Y. Zhou, Appl. Surf. Sci., 2017, 402, 384 CrossRef CAS.
- A. Bilgic, A. Cimen and A. N. Kursunlu, Sci. Total Environ., 2022, 845, 157170 CrossRef CAS PubMed.
- A. Bilgic, J. Alloys Compd., 2022, 899, 163360 CrossRef CAS.
- A. Bilgic, A. Cimen, M. Bayrak and A. N. Kursunlu, J. Photochem. Photobiol., A, 2024, 448, 115346 CrossRef CAS.
- A. Bilgic, A. Cimen and A. N. Kursunlu, Sci. Total Environ., 2023, 857, 159312 CrossRef CAS PubMed.
- Ş. Yılmaz, A. Zengin, T. Şahan and İ. H. Gübbük, J. Polym. Environ., 2023, 31, 36 CrossRef.
- A. M. Hassan, W. A. W. Ibrahim, M. B. Bakar, M. M. Sanagi, Z. A. Sutirman, H. R. Nodeh and M. A. Mokhter, J. Environ. Manage., 2020, 253, 109658 CrossRef CAS PubMed.
- A. K. Dyab, E. M. Abdallah, S. A. Ahmed and M. M. Rabee, J. Encapsulation Adsorpt. Sci., 2016, 6, 109 CrossRef CAS.
- S. F. F. S. Yaacob, N. S. A. Razak, T. T. Aun, S. K. M. Rozi, A. K. M. Jamil and S. Mohamad, Ind. Crops Prod., 2018, 124, 442 CrossRef CAS.
- J. Wang, S. Zheng, Y. Shao, J. Liu, Z. Xu and D. Zhu, J. Colloid Interface Sci., 2010, 349, 293 CrossRef CAS PubMed.
- N. Azmi, S. Ahmad and S. Low, RSC Adv., 2018, 8, 251 RSC.
- D. Singhal, N. Gupta and A. K. Singh, RSC Adv., 2015, 5, 65731 RSC.
- A. K. Manna, J. Mondal, R. Chandra, K. Rout and G. K. Patra, J. Photochem. Photobiol., A, 2018, 356, 477 CrossRef CAS.
- C. Kaewprom, Y. Areerob, W.-C. Oh, K. L. Ameta and S. Chanthai, Arab. J. Chem., 2020, 13, 3714 CrossRef CAS.
- X. Zhang and Y.-Y. Zhu, Sens. Actuators, B, 2014, 202, 609 CrossRef CAS.
- L. Li, B. Yu and T. You, Biosens. Bioelectron., 2015, 74, 263 CrossRef CAS PubMed.
- D. D. Yılmaz, D. A. Demirezen and H. Mıhçıokur, Surf. Interfaces, 2021, 22, 100840 CrossRef.
- N. Gupta, D. Singhal, A. K. Singh, N. Singh and U. Singh, Spectrochim. Acta, Part A, 2017, 176, 38 CrossRef CAS PubMed.
- E. Eksin, A. Erdem, T. Fafal and B. Kıvçak, Electroanalysis, 2019, 31, 1075 CrossRef CAS.
- S. Zhang, X. Wu, Q. Niu, Z. Guo, T. Li and H. Liu, J. Lumin., 2017, 27, 729 CAS.
- S. He, D. Li, C. Zhu, S. Song, L. Wang, Y. Long and C. Fan, Chem. Commun., 2008, 4885 RSC.
- C. Karami, M. A. Taher and M. Shahlaei, J. Mater. Sci.: Mater. Electron., 2020, 31, 5975 CrossRef CAS.
Footnote |
| † Electronic supplementary information (ESI) available. See DOI: https://doi.org/10.1039/d4ra06386d |
| This journal is © The Royal Society of Chemistry 2024 |

