 Open Access Article
The Kondo effect in superparamagnetic 30% Co–Ni/NiO nanocomposites: detailed transport and magnetic investigations
Shilpa D. Kamblea,
Charudipa D. Kamblea,
Umesh P. Gawai *b,
Devendra Kumarc,
Padmakar G. Chavand and
Sanjay K. Gurav*a
aDepartment of Physics, Shri Madhavrao Patil Mahavidyalaya, Murum, Tq. Omerga, Osmanabad-413606, M.S., India. E-mail: skgurav64@gmail.com
bDepartment of Physics, DDSP, Arts Commerce and Science College, Erandol, Dist, Jalgaon-425109, M.S., India. E-mail: upgawai.phys@gmail.com
cUGC-DAE Consortium for Scientific Research, University Campus, Khandwa Road, Indore, M.P. 452001, India
dDepartment of Physics, Kavayitri Bahinabai Chaudhari North Maharashtra University, Jalgaon-425001, India
First published on 18th November 2024
Abstract
Nanocomposites of 20% and 30% Co-doped Ni/NiO were synthesized using a microwave-assisted sol–gel auto-combustion method. The 30% Co-doped Ni/NiO nanocomposite exhibited negative magnetoresistance (M-R) at various temperatures, including 2 K, 10 K, 80 K, 100 K, and 250 K. This behavior is interpreted as indicative of a Kondo-like scattering effect. The resistivity ρ(T) upturn observed at low temperatures in the 30% Co-doped Ni/NiO nanocomposite can be accurately described by a power series equation combined with a Kondo term. Furthermore, this sample demonstrated a metal–insulator transition around the Kondo temperature TK ≈ 29.8(5) K, with noticeable resistivity changes at magnetic fields of 0 T, 1 T, 5 T, and 8 T. Additionally, a hump in resistivity at approximately 212 K, 170 K, 243 K, 251 K, and 209 K for magnetic fields of 0 T, 0.05 T, 1 T, 5 T, and 8 T, respectively, is attributed to the charge ordering of Co3+ and Co4+ ions within the Ni/NiO lattice, contributing to a further metal–insulator transition.
1. Introduction
Spintronics is currently at the forefront of research in condensed matter physics, particularly magnetic materials. This field investigates how spin influences conduction through processes such as ejection, extraction, transfer, polarization, and accumulation in magnetic nanostructures. The exploration of magnetotransport, magnetoresistance, and magnetic properties of ferromagnetic and antiferromagnetic materials holds immense scientific and technological significance.1,2 Magnetic ordering in the itinerant ferromagnetism of transition metals like nickel (Ni), cobalt (Co), and iron (Fe) is closely tied to electron correlation within narrow 3d bands. These bands weakly hybridize with 4s and 4p bands, with spin-polarized electrons resulting from exchange interactions with localized d-electrons playing a crucial role in transport properties.3,4 The Ni–NiO system is renowned for its magnetic properties, and doping with Co further enhances these characteristics by introducing additional magnetic moments and increasing spin polarization.4 The Kondo effect,5,6 a key phenomenon in condensed matter physics, has made remarkable progress, significantly expanding our understanding and applications of strongly correlated electron systems. Recent studies have confirmed the Kondo resonance at ultra-low temperatures, opening pathways for investigating quantum phenomena.7,8 In particular, research on quantum impurity systems has revealed unique thermoelectric behaviors, advancing our knowledge of nanoscale heat flow. These findings enrich our understanding of the Kondo effect, especially in quantum materials and non-Fermi liquids.8–10The Kondo effect arises when conduction electrons in a metal scatter off low-density magnetic impurities, causing spin-flips by localized spins.11 This interaction leads to a significant increase in electrical resistivity as temperature decreases. When magnetic impurities are placed on metal surfaces, the interaction between localized spins and conduction electrons intensifies, resulting in high Kondo temperatures.12 The antiferromagnetic coupling between itinerant electrons and localized spins screens the impurity spins, thereby manifesting the Kondo effect. This phenomenon has been documented in various materials, such as metal oxides, dilute magnetic alloys, semiconductor quantum dots, nickelates, carbon nanotubes, and graphene.13–16
Extensive research has explored the increase in electrical resistivity17–19 with changing temperatures, with contributions from spin-polarized tunneling, the Kondo effect, and quantum interference from electron–electron interactions.20–22 It has also been observed in atomic contacts of pure itinerant ferromagnets, displaying a coexistence of ferromagnetic and Kondo states, as well as in heavy-fermion metals.22–25 However, the Kondo effect has not yet been reported in Co-doped Ni/NiO systems. This study is significant as it systematically investigates both the magnetic properties (M–T, M–H) of 20% and 30% Co–Ni/NiO nanocomposites and the transport properties (R–T, R–H) of a superparamagnetic 30% Co-doped Ni/NiO sample. The pronounced low-temperature resistivity upturn in the 30% Co-doped Ni/NiO and the observed negative magnetoresistance with hysteresis at various temperatures provide key insights into the material's behavior.
2. Experimental details
A microwave-assisted sol–gel auto-combustion method was employed for the synthesis of Co-substituted Ni/NiO nanocomposites.26 During the synthesis of the nanocomposites, analytical-grade nickel(II) nitrate hexahydrate (Ni(NO3)2·6H2O), cobalt(II) nitrate hexahydrate (Co(NO3)2·6H2O), citric acid monohydrate (C6H8O7·H2O) as fuel, and distilled water (solvent) were used without any further purification. Nanocomposites of CoxNi/Ni1−xO (x = 0.20 and 0.30) were synthesized using the appropriate amounts of nickel nitrate hexahydrate (1 − x mmol), cobalt nitrate hexahydrate (x mmol), and citric acid monohydrate (2 mmol). Each component was dissolved separately in 100 mL of distilled water and stirred for 1 hour in a 500 mL beaker. Then, the citric acid solution was added dropwise into the precursor solutions mentioned above. The solution was stirred for 2 hours at 40 °C until a clear solution was formed. Subsequently, the solution was stirred and evaporated for some time at 200 °C on a hot plate, allowing gel formation. During the gelling process, the beaker was placed inside a microwave oven and heated through microwave irradiation for 10 seconds for 10 cycles at an output power of 800 W and a frequency of 2.45 GHz. Microwave irradiation converted the obtained viscous gel into foam, which ignited upon irradiation, resulting in loose and burnt powder of the nanocomposites. Finally, the obtained sample powder was dried at 100 °C overnight. The dried products were ground for half an hour and used for further characterization.X-ray diffraction (XRD) was performed with Bruker D8 Advance X-ray diffractometer using a wavelength of 1.5406 Å (CuKα). The temperature dependence of electrical resistivity (R–T) and magnetoresistance (R–H) was measured on 9T-PPMS Quantum Design physical properties measurement system. The magnetic measurement of M–H and M–T was performed on Quantum Design 16 tesla VSM. Micro-Raman shift (Horiba, LASER wavelength 532 nm) is used for the local structural properties of nanocomposites. The HR-TEM images were collected at an accelerating voltage of 300 kV and selected-area electron diffraction (SAED) patterns were acquired with a FEG-TEM (FEG Tecnai G2, F30 model). Elemental analysis extracted from the EDS (ESEM quanta 200) by point analysis.
3. Results and discussion
3.1 Magnetic properties
The magnetic properties were characterized by measuring the magnetic hysteresis curve (M–H) from low temperature (30 K) and room temperature (300 K) for the nanocomposites, as depicted in Fig. 1. The M–H curve exhibits a sharp increase in magnetic moments with the applied field, followed by saturation at H = 0.2956(2) T and 0.1173(4) T for the 20% Co-doped Ni/NiO and 30% Co-doped Ni/NiO nanocomposites, respectively. As shown in Fig. 1, the saturation magnetization (MS) values are 20.33 and 7.52 emu g−1 at 30 K, and 19.29 and 6.64 emu g−1 at 300 K for the 20% Co-doped Ni/NiO and 30% Co-doped Ni/NiO nanocomposites, respectively. It is evident that the MS decreases with increasing temperature and significantly decreases with higher cobalt content. The presence of MS suggests a substantial contribution from metals like Ni present in the nanocomposites. The decrease in MS values can be attributed to surface interfacing with the ferromagnetic (FM) Ni and antiferromagnetic (AFM) Co/NiO layers, as well as surface spin/disordered magnetic spin orientation, which play significant roles. We believe that the observed behavior of the 20% Co-doped sample can be explained by the enhanced ferromagnetic exchange interactions at this specific doping level, while the higher doping level (30%) leads to a reduction in magnetic ordering due to increased disorder. Additionally, the lack of temperature dependence is likely due to the stabilization of magnetic moments by high anisotropy and strong exchange interactions, which prevent significant thermal fluctuation in the observed temperature range.27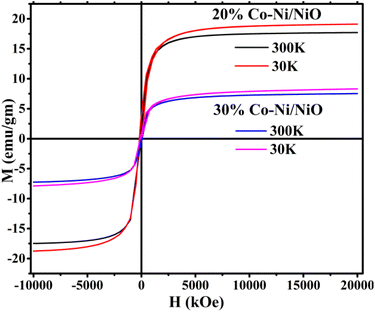 | ||
| Fig. 1 Magnetic hysteresis curves of 20% Co and 30% Co-doped Ni/NiO nanocomposites at 30 K and 300 K temperatures. | ||
The obtained MS value for the nanocomposites is notably lower than the bulk Ni MS value, which is approximately 55 emu g−1. It is noteworthy that all nanocomposites saturate with the applied magnetic field, but no remanence magnetization (MR) or coercivity (HC) (MR and HC = 0) appears, confirming their superparamagnetic state.27–30 The nonlinear nature of the M–H curve further confirms this state, which is expected due to the small size and single domain nature of the synthesized nanocomposites.
Fig. 2(a and b) present the variation of magnetization as a function of temperature for the as-synthesized nanocomposites under both zero field cooling (ZFC) and field cooling (FC) conditions, with an applied magnetic field (Ha) of 500 Oe at temperatures of 3 K to 350 K. In the field-cooled (FC) plot, magnetization increases as the temperature decreases. In contrast, the zero-field-cooled (ZFC) plot shows that magnetization initially increases monotonically but then slightly decreases with rising temperature. The magnetization reaches its maximum value at approximately ∼267 K for the 20% Co-doped Ni/NiO and at around ∼285 K for the 30% Co-doped Ni/NiO. These values indicate the blocking temperature (TB) for the respective samples, supporting their characterization as superparamagnetic. It is noticed that the TB increases, which may be attributed to the exchange coupling between ferromagnetic (FM) Ni and antiferromagnetic (AFM) Co/NiO components, implying improved thermal stability.26–30 This type of exchange coupling established at the Ni and Co/NiO interface provides a platform to enhance TB and magnetic stability.30–32 Additionally, the enhancement of TB has several reasons, such as broad size distribution, particle agglomeration, or strong interparticle dipolar magnetic interactions.33,34 The irreversible temperature in the ZFC–FC curve of the nanocomposites 20% Co-doped Ni/NiO and 30% Co-doped Ni/NiO is at about 350 K, indicating ferromagnetic behavior. The splitting (bifurcation) of the ZFC and FC curve usually appears in the co-existence of antiferromagnetic (Co/NiO) and ferromagnetic (Ni) phases coinciding with the synthesis of nanocomposites.30–34 Many authors have reported that a sharp cusp is observed at low temperature on the ZFC curve, demonstrating a freezing temperature (Tf), which freezes the ferromagnetic (Ni) spins and the antiferromagnetic (Co/NiO) spin moments, signifying a spin-glass-like state.30–34 In this case, a spin-glass-like state or frozen spin at low temperature is not observed; however, the magnetic moment progressively unfreezes at a given temperature. The observation of Fig. 2(a and b) indicates the magnetic moment decreases with increasing cobalt contents.
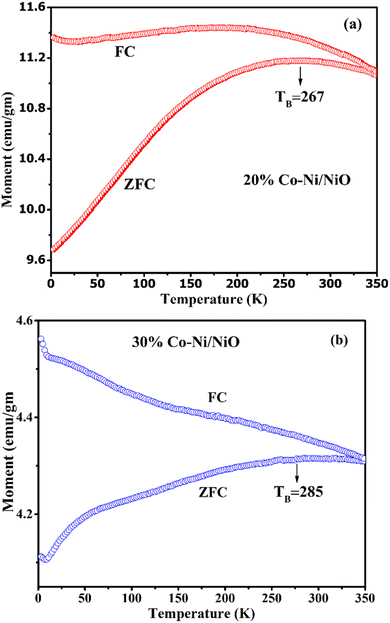 | ||
| Fig. 2 (a and b) ZFC and FC magnetization M(T) as a function of temperature measured at an applied magnetic field of Ha = 500 Oe for nanocomposites of 20% Co and 30% Co–Ni/NiO. | ||
3.2 Magneto-resistance and resistivity
The resistivity measurement as a function of the applied magnetic field (H) was conducted on strip-shaped pellets of as-synthesized nanocomposites with dimensions approximately 2.5 × 2.5 × 0.25 mm3 (length × width × thickness). Fig. 3 (a) depicts the M-R curve of the longitudinal magneto-resistance configuration for 30% Co-doped Ni/NiO at temperatures of 2 K, 10 K, 80 K, 100 K and 250 K was measured for ±8 T magnetic field. From Fig. 3 (a), it is evident that the resistivity decreases gradually with increasing magnetic fields (resulting in negative MR) at different temperatures. This trend indicates that the antiferromagnetic (AFM) state of NiO is gradually transitioning into the ferromagnetic (FM) state. However, it's worth noting that the AFM domain contributes to strong spin scattering, leading to higher resistivity. However, the AFM domain gives rise to strong spin scattering, resulting in high resistivity.34–36 Nevertheless, such spin scattering can be suppressed when the system is forced into the FM phase by applying external magnetic fields.35,36 In this case, the NiO in the nanocomposites is in the amorphous phase and Ni/Co in the crystalline phase; hence AFM contributes less to spin fluctuation. Thus, ρxx(T) decreases with increasing fields. The results of magnetic scattering via spin fluctuations of the localized spins in response to the applied magnetic field give rise to magnetoresistance. In the saturated (single-domain) state at room temperature, the resistivity depends only on the relative orientation of the magnetization and the measuring current.37–39 However the plot of ρxx(T) versus applied magnetic field B(T) indicates resistivity increases with increasing temperature. Obtained MR (%) values are very-low so it is not reported here.39–45 | ||
| Fig. 3 (a) Magnetoresistance, (b–e) upturn of the electrical resistivity at low temperatures fitted with theoretical data and experimental data for 30% Co-doped Ni/NiO. | ||
The temperature-dependent longitudinal electrical resistance, represented as ρxx(T), was evaluated at various applied magnetic fields ranging from 0 T to 8 T for nanocomposites of 30% Co doped Ni/NiO as illustrated in Fig. 3(b–e). The sample 30% Co-doped Ni/NiO show a different behavior: initially, as the temperature decreases, the resistivity decreases, reaching a minimum of around 29.8(5) K, then it increases and after that it again decreases. This upturn of electrical resistivity with temperature is attributed to the presence of magnetic/metallic impurities, which induce an increase in resistance at low temperatures. This unusual phenomenon is explained by the Kondo effect, which arises due to the interaction between the host conduction electrons and the magnetic impurity. This interaction leads to a logarithmic increase in electrical resistivity as the temperature decreases. The maximum value of resistance was found at the 8 T field. The observation of a minimum in the resistivity–temperature relationship ρ(T) is characteristic of the Kondo effect. It is attributed to the combined effects of electron–electron (e–e) and electron–phonon (e–p) interactions, and spin scattering of the conduction electrons by the magnetic impurity. The total electrical resistivity of the metal is given by:
| ρ(T) = ρ0 + ρi(T) | (1) |
| ρ(T) = ρ0 + ρi(T) + ρk | (2) |
The ρi(T) is described by the Bloch–Grüneissen expression arise46 due to electron–phonon interactions:
 | (3) |
 | (4) |
The residual resistivity ratio defined as  is relatively small it is estimated to be 7.286(3), 7.316(11), 7.403(15) and 7.713 (8) Ω cm for sample 30% Co–Ni/NiO at 0 T, 1 T, 5 T and 8 T respectively.
In general, the resistivity versus temperature behavior can be modeled by another equation with contributions from a metallic term ATn and an insulating term ρI(T)42–46
| ρI(T) = ATn + ρI(T) | (5) |
The Bloch–Grüneissen relation can be replaced by the temperature dependence of total resistivity as a power series equation,
 | (6) |
ρ(T) = ρ0 + ρ1T + ρ2T2 + ρ3T3 + ρ4T4 + ρ5T5 − ρk![[thin space (1/6-em)]](https://www.rsc.org/images/entities/char_2009.gif) ln(T) ln(T)
| (7) |
It is observed that the best fit is obtained by employing eqn (5) for 30% Co–Ni/NiO at different field strengths (0 T, 1 T, 5 T, and 8 T), with statistical parameters (as reduced χ2 = 9.810 × 10⁻⁴, 1.264 × 10⁻⁴, 2.513 × 10⁻⁴ and 3.626 × 10⁻⁵ coefficient of determination r2 = 0.983, 0.996, 0.995 and 0.998 at 0, 1, 5 and 8 T respectively) showing high accuracy. The temperature dependent resistivity with the different field cannot be the best fit to the behaviour expected in the case of e–e or weak localization effects. Fig. 3(e) for the sample at 0.05 T field reveals the metallic nature and is best fitted with eqn (4) without adding an insulating term. It can be observed from Fig. 3(b–e) that hump at 212, 170, 243, 251 and 209 K for 0, 0.05, 1, 5 and 8 T there was, which may be attributed to charge ordering of Co3+ and Co4+ ions in the lattice of Ni/Co–NiO and resulting to a again metal–insulator transition. Hence the appearance of this hump is typical in the magnetic contribution to ρ(T) of intermediate Co ions replaces to Ni in NiO. Upon heating with and without the applied field, the sample shows metallic behavior of the resistivity; it rises up to TM = 214, 242, 248 and 191 K temperature. It is also noticed from Fig. 3(c), that above TM the resistivity again decreases with increasing temperature. This means that the resistivity decreases with increasing temperature below TM. It is noticed that upon heating, the resistivity drops at the transition temperature (TM) as a result of the amorphous-to-crystalline phase transition, and the crystalline structure is not retained until the end of the thermal treatment. One can immediately observed from Fig. 3(c) that a resistivity indicates a metal to insulator transition.47 From Fig. 3(b–e), it is observed that we are not obtained Kondo effect at 0.05 T field.
3.3 Crystallographic study
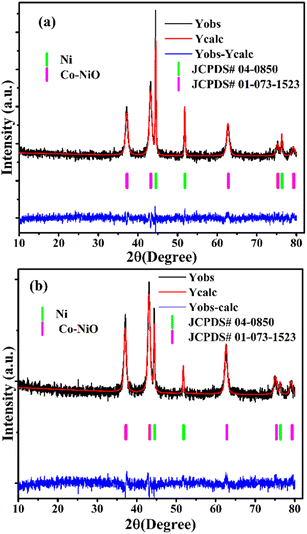
Fig. 4(a and b) displays the room temperature X-ray diffraction patterns collected for the determination of the phase purity and crystal structure of the as-synthesized nanocomposites. The XRD data were fitted to the Fm![[3 with combining macron]](https://www.rsc.org/images/entities/char_0033_0304.gif) m (no. 277) space group using the FullProf software suite with a Pseudo–Voigt function profile.48 The entire diffraction peaks of the nanocomposites can be readily indexed as a face-centered cubic structure of Ni and Co–NiO.
m (no. 277) space group using the FullProf software suite with a Pseudo–Voigt function profile.48 The entire diffraction peaks of the nanocomposites can be readily indexed as a face-centered cubic structure of Ni and Co–NiO.
Specifically, from Fig. 4 the three peaks for the nanocomposites can be assigned to (111), (200), and (220) reflections at 2θ ≈ 44.47°, 51.88°, 76.49° and 44.53°, 51.88°, 76.33° for cubic Ni (JCPDS no. 04-0850), for 20% Co and 30% Co-doped Ni/NiO respectively.49,50 Additionally, four peaks of (111), (200), (220), and (311) for reflections at 2θ ≈ 37.51°, 43.33°, 62.70°, 75.10° and 37.03°, 43.14°, 62.70°, 74.92° for cubic NiO (JCPDS no. 01-073-1523), respectively. The absence of secondary phases or extra peaks corresponding to Co, CoO, or other alloy or oxide phases in the XRD patterns of the nanocomposites indicates that Co successfully replaces Ni in the NiO structure during synthesis. This substitution is confirmed by the XRD patterns, which show evidence of Co replacing Ni on the surface of NiO. The lattice parameters a = 4.1885(5) Å for Co–NiO and a = 3.5271(4) Å for Ni in 20% Co-doped Ni/NiO; a = 4.1914(7) Å for Co–NiO and a = 3.5259(6) Å for Ni in 30% Co-doped Ni/NiO; were found to be similar to those reported in the literature for Ni/NiO.49,50 Gaussian function fitting5 was used to determine the full width at half-maximum (FWHM) values from the diffraction peaks of the nanocomposites. The average crystallite size was estimated (using high intensity peaks) from the Scherrer formula D = kλ/β![[thin space (1/6-em)]](https://www.rsc.org/images/entities/char_2009.gif) cos
cos![[thin space (1/6-em)]](https://www.rsc.org/images/entities/char_2009.gif) θ, where β is the FWHM of the diffraction peak, k is the Scherrer constant (0.94), λ is the incident X-ray wavelength, and θ is the diffraction angle. It was found that the average crystallite size of 20% Co-doped Ni/NiO and 30% Co-doped Ni/NiO nanocomposites are 19.47 (8) nm and 14.786(7) nm respectively.
θ, where β is the FWHM of the diffraction peak, k is the Scherrer constant (0.94), λ is the incident X-ray wavelength, and θ is the diffraction angle. It was found that the average crystallite size of 20% Co-doped Ni/NiO and 30% Co-doped Ni/NiO nanocomposites are 19.47 (8) nm and 14.786(7) nm respectively.
3.4 Raman study
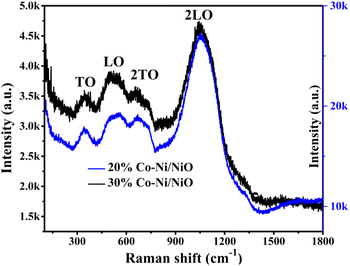
As depicted in Fig. 5, the Raman spectra of the 20% and 30% Co-doped Ni/NiO nanocomposites are shown. The different bands assigned for the first-order longitudinal optical (LO) mode of NiO are observed in the nanocomposites of 20% Co-doped Ni/NiO and 30% Co-doped Ni/NiO nanocomposites at 541.32, and 515.65 cm−1, along with peaks observed around 343.88, 347.64 and 668, 672 cm−1, which are the first-order transverse optical (TO) phonon modes and second-order transverse optical (2TO) phonon modes, respectively.49–51 Stronger second-order peaks assigned for 2LO (1060, 1049 cm−1) phonon modes are found in 20% Co-doped Ni/NiO and 30% Co-doped Ni/NiO nanocomposites, respectively. The obtained peaks are also consistent with the literature.38,513.5 Morphological investigation
Fig. 6 displays the High-Resolution Transmission Electron Microscopy (HR-TEM) micrograph, Selected Area Electron Diffraction (SAED) pattern of 30% Co-doped Ni/NiO nanocomposites, and Fig. 7 shows the Energy Dispersive Spectra (EDS) of 20% and 30% Co-doped Ni/NiO nanocomposites. HR-TEM micrographs in Fig. 6(a–c) reveal the formation of nanocomposites. Sample of 30% Co-doped Ni/NiO reveals the particle size to be 16(5) nm. The interplaner spacing distance (dhkl-spacing) of Ni (0.23 nm) at reflection (111) and Co–NiO (0.30 nm) at reflection (200) are obtained from fringes width of HR-TEM micrograph shown in Fig. 6(c). The SAED patterns show distinct concentric spotty rings corresponding to polycrystalline nature of sample. The dhkl-spacing of sample is found to be 0.2356(3) (111), 0.1439(2) (220), 0.1171(4) (222), and 0.0828(7) (420) for NiO, and 0.20267(4) (111), 0.12409(3) (220), and 0.09155(2) (311) for Ni, respectively. The 30% Co-doped Ni/NiO nanocomposites was structurally characterized using X-ray Diffraction (XRD) and TEM with SAED analysis. The interplanar d-spacing spacing calculated from XRD for Ni (111) and NiO (111) planes were approximately 0.243 nm and 0.210 nm, respectively, which correlate well with SAED measurements, confirming the desired nanocomposite structure.49,50 Reflections observed in the SAED pattern correspond to the (111) planes of both Ni and NiO, indicating the crystalline nature of the material. The derived lattice parameters were around 4.21 Å for Ni and 3.64 Å for NiO, consistent with literature values.51,52 The elemental compositions present in the sample were observed from point EDS, as displayed in Fig. 7. It is found that the atomic percentages are found to be Ni = 65.4, 43.2; Co = 26, 36.1; O = 8.6, 30.1% for 20% and 30% Co-doped Ni/NiO nanocomposites respectively. The HR-TEM results are well-matched with the reported literature.51–53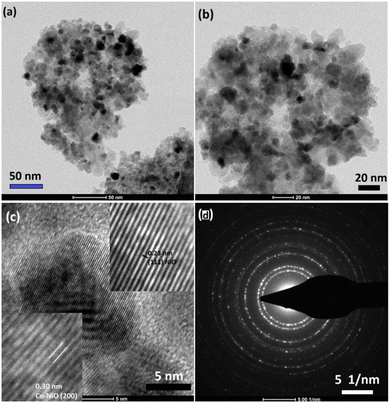 | ||
| Fig. 6 (a–c) shows HR-TEM micrographs of 30% Co doped Ni/NiO nanocomposites and the corresponding SAED patterns given in (d) shows cubic structures, polycrystalline nature of nanocomposites. | ||
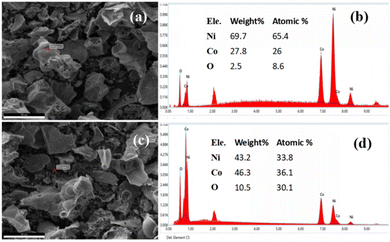 | ||
| Fig. 7 (a and c) SEM image and its (b and d) point EDS spectra of 20% and 30% Co doped Ni/NiO nanocomposites respectively. | ||
4. Conclusions
The superparamagnetic nanocomposites of 20% and 30% Co-doped Ni/NiO were synthesized via the microwave-assisted sol–gel auto-combustion method. The 30% Co-doped Ni/NiO sample exhibited significant magnetic and transport properties, including negative magnetoresistance, resistivity upturn, and a metal–insulator transition indicative of a Kondo effect. The resistivity data for the 30% Co-doped Ni/NiO sample fits well with a power series equation including a Kondo term, confirming the presence of Kondo scattering and a metal–insulator transition at TK ≈ 29.8(5) K. It can be concluded that this is attributed to charge ordering and resulting to metal–insulator transition. The resistivity of the sample increases with the applied magnetic field at low temperature. Structural analysis through XRD and Raman spectroscopy confirmed the successful doping of Co into the Ni/NiO lattice. HR-TEM fringes width and SAED patterns d-spacing values are consistent with the XRD results. These findings suggest that Co-doped Ni/NiO nanocomposites have potential applications in spintronic devices due to their enhanced magnetic and transport properties.Data availability
The datasets analyzed during this study are available from the corresponding author upon reasonable request.Author contributions
All authors contributed equally to this work.Conflicts of interest
The author declares no competing interests.Acknowledgements
The author extends sincere gratitude to Dr Rajeev Rawat, UGC-DAE Consortium for Scientific Research, Indore for VSM measurement facility, and Kranti Kumar and Soumya for performing magnetization measurement. SDK extends special thanks to BARTI (Dr Babasaheb Ambedkar Research and Training Institute) for fellowship throughout research (Award Letter No.: BARTI/Fellowship/BANRF-2021/2135).References
- C. Cirillo, C. Barone and H. Bradshaw, et al., Sci. Rep., 2020, 10, 13693, DOI:10.1038/s41598-020-70646-2.
- T. Moriyama, K. Oda and T. Ohkochi, et al., Sci. Rep., 2018, 8, 14167, DOI:10.1038/s41598-018-32508-w.
- J. Martinek, Y. Utsumi and H. Imamura, et al., Phys. Rev. Lett., 2003, 91, 247202, DOI:10.1103/PhysRevLett.91.247202.
- C. Lee and D. Kim, Phys. Rev. B, 2020, 102, 034408, DOI:10.1103/PhysRevB.102.034408.
- J. Kondo, Prog. Theor. Phys., 1964, 32, 37–49, DOI:10.1143/PTP.32.37.
- A. F. Otte, M. Ternes and K. von Bergmann, et al., Nat. Phys., 2008, 4, 847–850, DOI:10.1038/nphys1072.
- P. Wahl, L. Diekhöner and M. A. Schneider, et al., Phys. Rev. Lett., 2004, 93, 176603, DOI:10.1103/PhysRevLett.93.176603.
- C. van Efferen, J. Fischer and T. A. Costi, et al., Nat. Phys., 2024, 20, 82–87, DOI:10.1038/s41567-023-02250-w.
- T. Hotta, J. Phys. Soc. Jpn., 2021, 90, 113701, DOI:10.7566/JPSJ.90.113701.
- X. Zeng, R. S. Schimmel and Y. Zhang, et al., Phys. Rev. B, 2024, 109, 115423, DOI:10.1103/PhysRevB.109.115423.
- K. R. Sapkota, F. S. Maloney and W. Wang, Phys. Rev. B, 2018, 97, 144425, DOI:10.1103/PhysRevB.97.144425.
- C. Barone, H. Rotzinger and C. Mauro, et al., Sci. Rep., 2018, 8, 13892, DOI:10.1038/s41598-018-32298-1.
- J. H. Chen, L. Li and W. Cullen, et al., Nat. Phys., 2011, 7, 535–538, DOI:10.1038/nphys1962.
- K. Shibata and K. Hirakawa, Appl. Phys. Lett., 2008, 93, 062102, DOI:10.1063/1.2968206.
- H. S. Jin, W. E. Pickett and K. W. Lee, Phys. Rev. Res., 2020, 2, 033197, DOI:10.1103/PhysRevResearch.2.033197.
- D. Mazumdar, K. Das and I. Das, J. Phys.: Condens. Matter, 2021, 33, 305601, DOI:10.1088/1361-648X/ac0386.
- A. Kurzmann, H. Overweg and M. Eich, et al., Nat. Commun., 2021, 12, 5490, DOI:10.1038/s41467-021-26149-3.
- S. Barua, M. C. Hatnean and M. R. Lees, et al., Sci. Rep., 2017, 7, 10964, DOI:10.1038/s41598-017-11247-4.
- C. Barone, H. Rotzinger and C. Mauro, et al., Sci. Rep., 2018, 8, 13892, DOI:10.1038/s41598-018-32298-1.
- L. Zhu, X. Liu and L. Li, et al., Nat. Commun., 2023, 14, 1465, DOI:10.1038/s41467-023-37197-2.
- W. Niu, S. Meng and Y. Zhang, et al., Sci. Rep., 2016, 6, 26081, DOI:10.1038/srep26081.
- J. Liang, X. Zhang and Y. Li, et al., Sci. Rep., 2021, 11, 23843, DOI:10.1038/s41598-021-02677-1.
- J. Ren, W. Zhu and L. He, et al., Nano Lett., 2014, 14(7), 4011–4015, DOI:10.1021/nl501425n.
- J. H. Chen, L. Li, W. G. Cullen, E. D. Williams and M. S. Fuhrer, Nat. Phys., 2011, 7(7), 535–538, DOI:10.1038/nphys1962.
- M. Calvo, J. Fernández-Rossier and J. Palacios, et al., Nature, 2009, 458(7242), 1150–1153, DOI:10.1038/nature07878.
- S. Agrawal, A. Parveen and A. Azam, J. Lumin., 2017, 184, 250–255 CrossRef CAS.
- S. Mathur and M. Veith, et al., J. Appl. Phys., 2007, 102(6), 063910 CrossRef.
- M. Mézard, Indian J. Phys., 2023, 1–12, DOI:10.1007/s12648-023-03029-8.
- H. Khurshid, P. Lampen-Kelley and Ò. Iglesias, et al., Sci. Rep., 2015, 5, 15054, DOI:10.1038/srep15054.
- W. Kim, S. Kim and Z. Zhang, et al., Phys. Rev. B: Condens. Matter Mater. Phys., 2010, 81(17), 174416, DOI:10.1103/PhysRevB.81.174416.
- Z. Li, Q. Yuan and Y. Zhang, et al., CrystEngComm, 2014, 16, 8442–8448, 10.1039/C4CE00868E.
- M. R. Salvadori, R. A. Ando, D. Muraca, M. Knobel, C. A. Oller Nascimento and B. Corrêa, RSC Adv., 2016, 6, 60683–60692, 10.1039/C6RA07274G.
- J. Y. Ji, P. H. Shih, T. S. Chan, Y. R. Ma and S. Y. Wu, Nanoscale Res. Lett., 2015, 10, 1–13, DOI:10.1186/s11671-015-0925-0.
- T. Seto, H. Akinaga, F. Takano, K. Koga, T. Orii and M. Hirasawa, J. Phys. Chem. B, 2005, 109(28), 13403–13405, DOI:10.1021/jp052084+.
- C. S. Levin, C. Hofmann and T. A. Ali, et al., ACS Nano, 2009, 3(6), 1379–1388, DOI:10.1021/nn900118a.
- R. F. L. Evans, D. Bate, R. W. Chantrell, R. Yanes and O. Chubykalo-Fesenko, Phys. Rev. B: Condens. Matter Mater. Phys., 2011, 84(9), 092404, DOI:10.1103/PhysRevB.84.092404.
- M. Salvadori, R. Ando, D. Muraca, M. Knobel, C. Oller-Nascimento and B. Correa, RSC Adv., 2016, 6, 60683–60692, 10.1039/c6ra07274g.
- M. Patange, S. Biswas, A. K. Yadav, S. N. Jha and D. Bhattacharyya, Phys. Chem. Chem. Phys., 2015, 17(48), 32398–32412, 10.1039/c5cp05735d.
- K. M. Seemann, M. C. Hickey, V. Baltz, B. J. Hickey and C. H. Marrows, New J. Phys., 2010, 12(3), 033033, DOI:10.1088/1367-2630/12/3/033033.
- P. P. Madduri and S. N. Kaul, Phys. Rev. B, 2017, 95(18), 184402, DOI:10.1103/PhysRevB.95.184402.
- N. Lee, J. Song and J. Shin, et al., Adv. Mater., 2018, 30(52), 1805564, DOI:10.1002/adma.201805564.
- Y. Wang, W. Zhu and J. Zou, et al., Nat. Commun., 2020, 11(1), 275, DOI:10.1038/s41467-019-14016-w.
- I. Bakonyi, Eur. Phys. J. Plus, 2018, 133(12), 521, DOI:10.1140/epjp/i2018-12351-3.
- B. Raquet, M. Viret and E. Sondergard, et al., J. Appl. Phys., 2002, 91(10), 8129–8131, DOI:10.1063/1.1466786.
- S. S. Sunku, S. Datta and K. P. Rajeev, Phys. Rev. B, 2016, 93, 174408, DOI:10.1103/PhysRevB.93.174408.
- D. Cvijović, Theor. Math. Phys., 2011, 166, 37–42, DOI:10.1007/s11232-011-0005-y.
- Y. Feng, Y. Wang and D. M. Silevitch, et al., Nat. Commun., 2021, 12, 2779, DOI:10.1038/s41467-021-23039-6..
- J. Rodríguez-Carvajal, Phys. B, 1993, 192(1–2), 55–69, DOI:10.1016/0921-4526(93)90108-I.
- U. P. Gawai, D. K. Gaikwad and M. R. Bodke, et al., Phys. Chem. Chem. Phys., 2019, 21(3), 1294–1307, 10.1039/c8cp06122d.
- U. P. Gawai, S. D. Kamble and S. K. Gurav, et al., ACS Omega, 2022, 7(8), 6700–6709, DOI:10.1021/acsomega.1c07314.
- K. N. Kudin, B. Ozbas and H. C. Schniepp, et al., Nano Lett., 2008, 8(1), 36–41, DOI:10.1021/nl071822y.
- H. Wu, G. Wu, Q. Wu and L. Wang, Mater. Charact., 2014, 97, 18–26 CrossRef CAS.
- U. P. Gawai and S. D. Kamble, Sci. Rep., 2024, 14, 24460, DOI:10.1038/s41598-024-67447-2.
| This journal is © The Royal Society of Chemistry 2024 |

