 Open Access Article
Innovative 2D dioxonium vanadium oxide: enhancing stability in aqueous zinc-ion battery cathodes†
Yannis De Lunaa,
Zakiah Mohamed b,
Abdulilah Dawoudc and
Nasr Bensalah
 *c
*c
aMaterials Science and Technology Graduate Program, Department of Physics and Materials Science, Qatar University, Doha 2713, Qatar
bFaculty of Applied Science, Universiti Teknologi MARA, 40450 Shah Alam, Selangor, Malaysia
cDepartment of Chemistry and Earth Sciences, College of Arts and Science, Qatar University, PO Box 2713, Doha, Qatar. E-mail: nasr.bensalah@qu.edu.qa
First published on 11th December 2024
Abstract
Vanadium oxide-based compounds have attracted significant interest as battery materials, especially in aqueous Zn-ion batteries, due to favorable properties and compatibility in Zn-ion systems. In a simple hydrothermal method with moderate conditions, a novel vanadium oxide compound has been synthesized using ammonium metavanadate with oxalic acid as a reducing agent. Various characterization techniques confirmed the formation of layered V3O8(H3O)2 nanoplatelets with a tetragonal crystal structure. The as-prepared cathode material was tested in coin cells against a Zn metal anode in two aqueous electrolytes of the same concentration: ZnSO4·7H2O and Zn(CF3SO3)2. Electrochemical results showed high reversibility of Zn insertion/de-insertion and impressive cycling stability with aqueous Zn(CF3SO3)2 electrolyte. Notably, the cathode material delivered a specific capacity of 150 mA h g−1 at 100 mA g−1 and a relatively constant coulombic efficiency near 100%, indicating impressive stability during cycling and reversibility of charge/discharge electrochemical reactions. Post-mortem characterization exposed a significant structural change in the as-prepared cathode material from nanoplatelets to nanoflakes after full discharge, which reverted to nanoplatelets after charging, reflecting the high level of reversibility of the material. DFT calculations revealed a structural change in the material after cycling, providing mechanistic insights in Zn2+-ion storage.
Introduction
The need for electrochemical energy storage (EES) devices, including batteries and supercapacitors, is continuously increasing due to the global transition from being fossil fuel-dependent to being more sustainable and efficient in utilizing technology. In recent years, increased applications of secondary (rechargeable) batteries have been observed due to the expanded utilization of electric vehicles, portable electronics, and medical devices.1,2 Lithium-ion batteries are one of the most popular commercialized secondary-type batteries due to their higher energy density, simple chemistry mechanisms (intercalation/deintercalation), and relatively long lifetime than other secondary batteries (lead–acid, nickel–metal hydride, etc.). However, LIBs suffer from (i) high cost (mainly Li, Co, and Ni), (ii) safety problems related to the flammable organic electrolytes,3 and (iii) limited specific capacities of graphite anodes and lithium cobalt oxide cathodes.4 They also cause additional environmental problems during their disposal due to the toxicity of solid wastes that require adequate treatment before discharging into the environment.5 These drawbacks render the state-of-art LIBs incapable to respond to the urgent demand for high energy density batteries in renewable energy storage systems and electric vehicle applications. Therefore, the expansion of the battery technology beyond Li-ion chemistry is pertinent to the development of rechargeable batteries with simple chemistry and safe operations.Lately, the chemistry of aqueous Zn-ion batteries (AZIBs) has gained considerable interest for its potential application as a safer and inexpensive substitute to lithium-ion technology, particularly in large-scale applications related to renewable energy storage and smart grids.6 The concept of an AZIB was first published a decade ago, which transformed the primary Zn/MnO2 alkaline battery into a rechargeable type using a mild, water-based electrolyte.7 Compared to LIBs, typical metals used in ZIBs are more abundant and the commercialization of ZIBs would help in the conserving the dwindling supply of lithium metal. Apart from the lower costs, the development of rechargeable AZIBs is attracting more interest owing to less safety risks, low toxicity, recyclability of materials, and good electrochemical performance (specific capacity, volumetric energy density, stable cyclability, robust capacity retention).7–9 Furthermore, Zn metal as an anode in rechargeable aqueous ZIBs offers high volumetric energy density (5855 mA h cm−3).10 Although Zn anodes suffer from the formation of dendrites on the surface and corrosion problems, there are various strategies that can be applied to mitigate these issues, including coatings, pH adjustment, and electrolyte system design.11–13
A range of materials have been investigated as cathode for aqueous rechargeable ZIBs. Manganese oxide and vanadium oxide-based cathode materials showed excellent chemical stability, good electrochemical performance, and reversible Zn2+ ions insertion/extraction processes.8,9 Vanadium-based cathode materials for aqueous ZIBs have shown favorable properties and performance due to vanadium's wide range of oxidation states that can aid in structural stability.8,9,14–17 One of the newer vanadium-based cathode material in ZIB research is layered vanadium phosphate (VOPO4), which has the potential to facilitate fast Zn-ion diffusion due to its structure. However, the cycling performance for this material is unsatisfactory due to its dissolution into the electrolyte, with capacities falling under 100 mA h g−1.18,19 As one of the more conventional vanadium-based cathode material, vanadium oxides can adopt different V–O coordination (octahedral, tetrahedral, square pyramidal, trigonal pyramidal), resulting in different crystalline structures. Vanadium (V) oxide (V2O5) is one of the most popular vanadium-based cathode material investigated for ZIB applications. Hydrated V2O5 (V2O5·nH2O) has larger interlayer spacing than anhydrous V2O5 due to the pre-intercalation of crystalline water molecules in the layered structure. Despite this, the development of V2O5 into commercialization remains unsuccessful due to key issues such as structural instability during cycling and insufficient conductivity,20 although synthesizing nanosized V2O5 has been shown to greatly improve its performance.21 Moreover, vanadium dioxide (VO2) has great potential as a cathode material for aqueous ZIBs due to its many polymorphs with favorable structures that can host and facilitate the diffusion of Zn2+ ions.14,22
This work will focus on the synthesis of a nanostructured vanadium oxide with hydronium ions (denoted as VO-H3O) by a simple hydrothermal reaction using ammonium vanadate (NH4VO3) in presence of oxalic acid. The vanadium oxide will be characterized using different spectroscopic and microscopic analytical methods. The as-prepared vanadium oxide product will be tested as cathode material for aqueous ZIBs using Zn metal as anode and two types of aqueous electrolyte (3 M ZnSO4·7H2O and 3 M Zn(CF3SO3)2) for comparison. The performance of ZIBs cells will be assessed using cyclic voltammetry (CV) and galvanostatic charge/discharge (GCD).
Experimental
Synthesis of vanadium oxide nanomaterial
The synthesis of a vanadium oxide compound was performed by hydrothermal method with moderate conditions using ammonium metavanadate, NH4VO3, as the source of vanadium. Vanadium oxide was synthesized by mixing NH4VO3 (5.0 g) dissolved in deionized water (40 mL) with oxalic acid (H2C2O4, 4.4 g), forming a brownish yellow complex (NH4)2[VO(C2O4)2]. After 1 hour of continuous magnetic stirring at 400 rpm, the resulting mixture was transferred into a Teflon jar, which was placed in a stainless-steel autoclave. The hydrothermal synthesis was carried out in an oven at a fixed temperature of 150 °C for 24 hours. After being cooled, the resulting product was collected and washed several times with deionized water through centrifugation at 4000 rpm for 10 minutes, then dried at 80 °C overnight. The dried solid was ground finely with mortar and pestle, then used as active material in the preparation of cathode materials for AZIBs.Preparation of cathode material and coin cell assembly
The slurries were prepared by ball milling a mixture in an agate jar containing the active material (vanadium oxide, 75%), Super P carbon (15%) as a conductive component, and polyvinylene fluoride (PVDF, 10%) as a binder with N-methylpyrrolidone (NMP, 2–4 mL) as solvent at 400 rpm. The homogeneous slurry was casted on a titanium sheet using doctor blade and a film coating machine, then dried at 80 °C overnight. A punching machine was used to cut the cathode and the Zn metal anode sheets into disks with 16 mm diameter. Zn metal disks were sanded with an abrasive paper and cleaned with ethanol as a pretreatment to remove the formed oxide layer. Glass fiber filter paper (Pall Corporation) was used as separator. ZnSO4·7H2O and Zn(CF3SO3)2 of the same concentration (3 M) were used separately as electrolytes to compare their effects on the aqueous ZIB cathode material.Characterization of active material
The determination of the crystalline structure of the phases present in the solid sample was performed using X-ray diffraction spectrometer (PANalytical Empyrean X-ray Diffractometer; 40 mA, 45 kV). The interlayer spacing of the main crystal plane was calculated using Bragg's law in eqn (1).
 | (1) |
The interlayer spacing, d, was calculated using the following values obtained from XRD data: λ as the X-ray wavelength for Cu metal target (1.54 Å) and θ as the Bragg diffraction angle in radians. The crystallite size of VO-H3O product was estimated using XRD data and Scherrer equation in eqn (2).
 | (2) |
Electrochemical tests
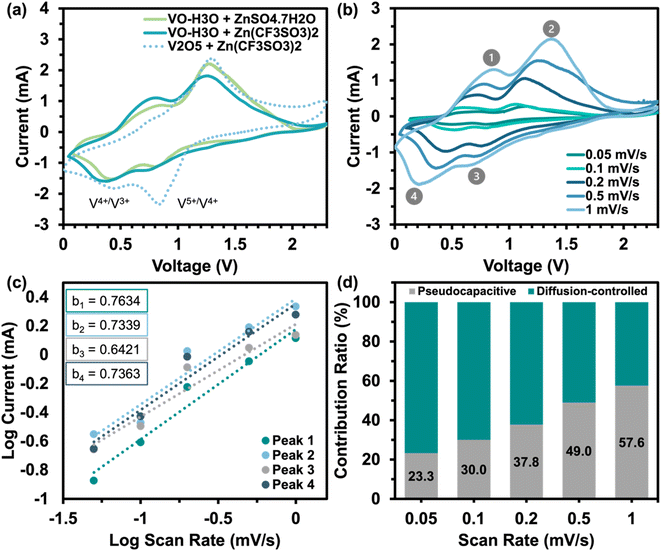
The assembled coin cells underwent electrochemical testing to examine the electrochemical behavior and evaluate the capabilities of the as-prepared material as a ZIB cathode. The cathode material's electrochemical behavior was examined by cyclic voltammetry (CV) using Corrtest-CS350 Potentiostat/Galvanostat electrochemical workstation in the range of 0.0–2.3 V vs. Zn2+/Zn and at a scan rate of 0.5 mV s−1 up to 10 cycles. The kinetic storage mechanism behavior was determined using CV at increasing scan rates (0.05–1.0 mV s−1) and by generating plots based on eqn (3) and (4).23,24| i = avb | (3) |
| i = k1v + k2v1/2 | (4) |
Eqn (3) obeys the power law and was utilized to calculate the value of b, which is a value between 0.5 and 1. Values of b closer to 0.5 indicates a diffusion-controlled storage mechanism behavior and closer to 1 displays pseudocapacitive behavior (fast kinetics). The contribution ratio was calculated using eqn (4), where k1 is the slope and k2 is the y-intercept that represents the diffusion-controlled and pseudocapacitive behaviours, respectively, from the plot of log current against log scan rate. The electrochemical performance of ZIBs was evaluated using galvanostatic charge/discharge (GCD) using a battery analyzer (BST8-WA) within the same voltage range as CV tests at current densities of 0.05, 0.1, and 1.0 A g−1. The cells were cycled at increasing current densities ranging from 0.1–1.4 A g−1 within the same voltage range for the rate performance analysis. Galvanostatic intermittent titration technique (GITT) was conducted using the same battery analyzer at a current density of 0.05 A g−1. The diffusion coefficient of Zn ions was calculated using GITT data and eqn (5).
 | (5) |
Computational method
All computations were completed using the Vienna ab initio simulation package (VASP) utilizing density functional theory (DFT). A 1 × 1 × 2 supercell of bilayer of V3O8(H3O)2 is utilized as a host to investigate the intercalation of one Zn2+ atom. Spin-polarized DFT calculations were executed using the Perdew–Burke–Ernzerhof (PBE) functional, projector augmented wave (PAW) pseudo-potentials, and employing a normal precision with an encutvalue of 340 eV. Monkhorst–Pack k-point grids were configured with a 2 × 2 × 2 and 11 × 11 × 11 arrangements for the geometry optimization and the corresponding single-point calculations, respectively. Geometry optimization of all structures was continued until the energy reached convergence at 1.0 × 10⁻⁵ eV, and the force converged to 0.02 eV Å−1.Results and discussion
Characterization of vanadium oxides-based materials
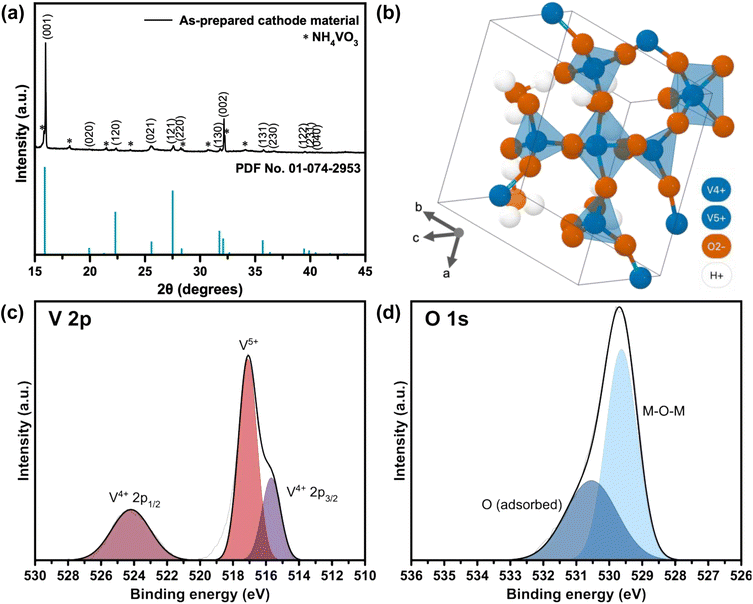 | ||
| Fig. 1 (a) XRD spectrum of the as-prepared cathode material from the reaction between NH4VO3 and H2C2O4, indexed with crystal planes from reference (PDF No. 01-074-2953). (b) Molecular structure of a single sheet of tetragonal V3O8(H3O)2 generated by the Materials Project (ID: mp-1195972) from database version v2022.10.28.25 XPS spectra of (c) V 2p and (d) O 1s orbitals in as-prepared VO-H3O cathode material. | ||
The tetragonal structure of V3O8(H3O)2 is presented in Fig. 1b. Within a unit cell, a layer of V3O8(H3O)2 sheet exists, where “distorted VO5 trigonal bipyramids” are produced from the bonding of V4+ with O2−.25 The four corners are shared with VO4 tetrahedra of equal bond lengths. One of the O2− atoms in each VO4 tetrahedra is bonded to one H+ atom from the H3O+ molecule. For energy storage systems with intercalation mechanism, layered cathode materials are ideal as the interlayer spacing allows charge carriers to be stored and the addition of cations can provide greater structural stability.26,27 Using Bragg's law (eqn (1)), the interlayer spacing (d) of the highest peak in the XRD spectrum corresponding to the (001) crystal plane with 2θ value of 15.97° was calculated to be 5.54 Å. In comparison, V2O5 typically has an interlayer spacing measured at 4.4 Å.28 The estimated value of the crystallite size was calculated using the Scherrer formula (eqn (2)), which ranged from 76.7 to 353.3 nm (Table S1 in ESI†).
The Raman spectrum for the as-prepared cathode material is shown in Fig. S1.† Twelve peaks were identified after the deconvolution of the spectrum. The sharp peaks below 200 cm−1 were associated with the lattice vibrations in the VO-H3O molecules, whilst several peaks between 200 and 600 cm−1 corresponded to V–O–V bending.33–35 A wide peak at 667 cm−1 was observed, which was reported to be due to OH bending in the hydrated molecules.33 Four peaks were detected between 700 and 1000 cm−1, correlating to symmetric and anti-symmetric stretching vibrations in V–O bonds in the VO4 and VO5 portions in the molecule.33–37 Therefore, results from Raman spectroscopy supports the findings from XRD and XPS analyses.
SEM imaging coupled with EDX detector was completed to obtain micrographs that detail the structural morphology of the as-prepared cathode material and identify the elemental composition and distribution. Fig. 2 presents the SEM images and elemental mapping of the VO-H3O product collected after hydrothermal treatment of NH4VO3 with oxalic acid. The micrographs from SEM in Fig. 2a clearly shows a layered structure consisting of agglomerated nanoplatelets, with an average size of 172 nm. V atoms (blue) and O atoms (red) appear to be well-distributed in Fig. 2b.
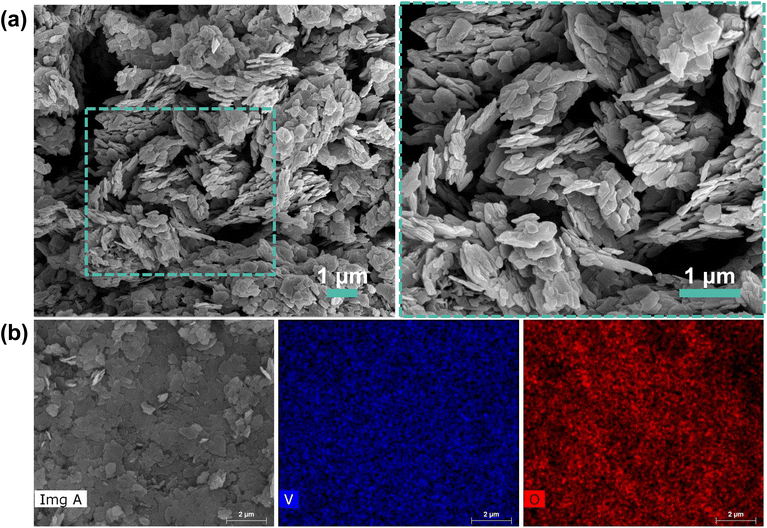 | ||
| Fig. 2 (a) SEM images of layered as-prepared VO-H3O nanoplatelets with a close-up view of the area highlighted by the dashed rectangle and (b) elemental mapping via EDX showing V and O atoms. | ||
In addition to SEM, TEM was used to further confirm the formation of the shape and crystallinity. TEM image of VO-H3O compound clearly shows the overlapping of nanoplatelets, confirming the 2D layered structure (Fig. S2a†). The SAED pattern images (Fig. S2b†) display clear crystalline spots for both solids that corresponds to a polycrystalline material, which was evident in the XRD results.
Electrochemical tests
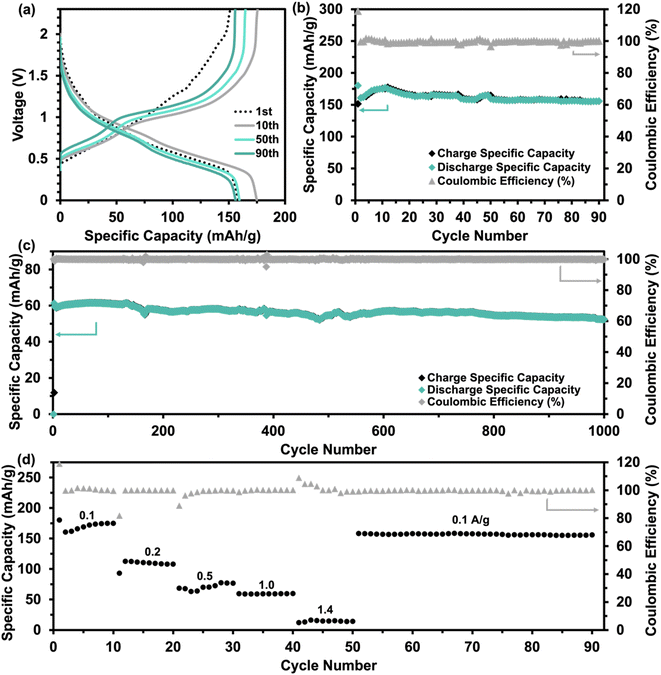
Further electrochemical testing of VO-H3O was conducted using 3 M Zn(CF3SO3)2 as the aqueous electrolyte that delivered the better electrochemical performance based on CV and GCD tests. The electrochemical performance of reagent V2O5 powder and as-prepared VO-H3O as cathode materials at 0.05 A g−1 is shown in Fig. S4.† In comparison, reagent V2O5 powder performed poorly with unstable cycling followed by a short-circuit in the 34th cycle (Fig. S4a and b†), whilst the as-prepared VO-H3O delivered a stable performance with >99% coulombic efficiency and a final capacity of 217 mA h g−1 in the 35th cycle (Fig. S4c and d†). Prolonged cycling of the as-prepared cathode material against Zn metal was completed for 1000 cycles at 1 A g−1 (Fig. 4c). The specific capacity remained relatively stable at about 60 mA h g−1 in the first 140 cycles. This value only decreased slightly, reaching 53 mA h g−1 after 1000 cycles. Overall, the electrochemical test illustrated the high stability of the cathode material, even at an elevated current density of 1 A g−1. The rate performance plot in Fig. 4d involved cycling the coin cell at increasing current density values in 10-cycle intervals, with the initial set of cycles at 0.1 A g−1. Similar to what was observed in the GCD curves, there is a significant drop in capacity after the first cycle, followed by the plateau by the 10th cycle. At 0.2 A g−1, exceptional stability was observed with discharge capacities around 100 mA h g−1, despite the initial drop in discharge capacity. The cycling performance at 0.5 A g−1 was observed to be the least stable, with slight fluctuations in discharge capacities before increasing and stabilizing around 77 mA h g−1 towards the 30th cycle. At 1.0 A g−1, a slight dip in capacity values was observed with a final value of 55 mA h g−1. At the highest current density of 1.4 A g−1, discharge specific capacities dropped to approximately 15 mA h g−1, with the coulombic efficiency reducing with each cycle. Finally, the current density was brought back to 0.1 A g−1, which showed extremely stable cycling reversible specific capacities of 150 mA h g−1. GITT tests shown in Fig. S5a† was utilized to determine the diffusion coefficient of Zn2+ ions using eqn (5). The diffusion coefficient values ranged between 1 × 10⁻¹⁰ and 1 × 10⁻⁸ cm2 s−1 (Fig. S5b†), which is comparable to other vanadium oxide-based cathode materials and exceeds the diffusion coefficient values of Li+ ions.41 Overall, the coin cell with Zn(CF3SO3)2 electrolyte achieved higher capacities (notably at 0.1 and 0.2 A g−1) and longer cycling without failure, as well as higher reversibility, which was also observed in the CV results.
Post-mortem analysis
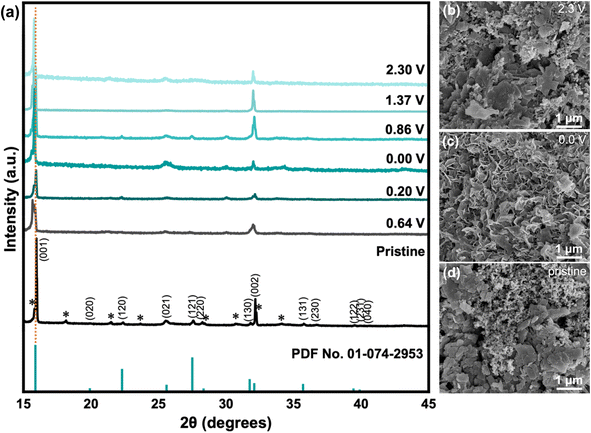
Post-mortem analysis for battery materials involves studying how the material changes after being cycled. In this section, the following characterization techniques were utilized: XRD, SEM, and XPS. First, XRD analysis was done for samples in various states of cycling (Fig. 5a). The discharge process occurred from 2.3 V to 0.0 V (fully discharged), in which the specific voltages between 0.0–2.3 V correspond to the peak locations observed in CV (Fig. 3). Evidently, there is a slight shift in the peak location of the (001) crystal plane towards smaller 2θ values during the discharge process from 15.968° to 15.797°, which is associated with the widening of the interlayer space from 5.54 Å to 5.60 Å due to the intercalation of Zn2+ ions.42 Upon charging to 2.3 V, the smaller 2θ angle is maintained, which may indicate that some of the Zn2+ ions remain after the de-intercalation process that widens the interlayer space by functioning as pillars and contributes to the cathode's structural stability. This may explain the improved stability after several cycles during electrochemical testing, as seen in the electrochemical results. In addition, EIS spectra (Fig. S6†) showed a significant difference between the pristine and cycled states, with less resistance observed in the cycled states. Second, SEM imaging was completed for the pristine VO-H3O cathode and cycled cells with Zn(CF3SO3)2 electrolyte after fully discharging to 0.0 V and fully charging to 2.3 V for post-mortem analysis. In the pristine condition, layered structures of VO-H3O product were observed in the slurry mixture (Fig. 5b). After fully discharging to 0.0 V, the morphology of the cathode material changed to nanoflakes (Fig. 5c). Finally, fully charging to 2.3 V reverted the appearance to the original state with the layered structures (Fig. 5d). The SEM images for pristine and cycled cathodes with ZnSO4·7H2O electrolyte are shown in Fig. S7.† The main difference between the electrolytes is the appearance of the cathode in the discharged state, wherein a network with tunnel-like structures is formed.Lastly, XPS was carried out for VO-H3O cathode material with ZnSO4·7H2O (Fig. S8†) and Zn(CF3SO3)2 (Fig. 6) electrolytes in the pristine and cycled states for comparison to determine the oxidation states of the species on the surface of the as-prepared cathode material. In the V 2p orbital spectra (Fig. 6a), V4+ and V5+ species were observed in the pristine and charged states with near-identical binding energies and intensities from literature.29 These observations agree with the findings from characterization analysis, in which the synthesis of V3O8(H3O)2 was confirmed and has both V4+ and V5+ species present in the compound. In the discharged state, it is evident that V3+ species were detected through XPS analysis, which may serve as an indication of the insertion of Zn2+ ions into the cathode as host material. The appearance of a peak for V3+ species with binding energy of 523 eV suggests the formation of V2O3.43–45 In addition, there is a significant decrease in peak intensity of V4+ species, which implies that some of it were reduced to +3 oxidation state in the discharge process (insertion of Zn2+ ions in the host material), accompanied by a slight shift to higher binding energy. On the other hand, the intensity for the V5+ peak increased during this process with a small shift to higher binding energy. With the ZnSO4 electrolyte (Fig. S8a†), the only difference is the presence of a peak corresponding to V3+ species, which indicates partial reversibility that reflects the results of the electrochemical tests.
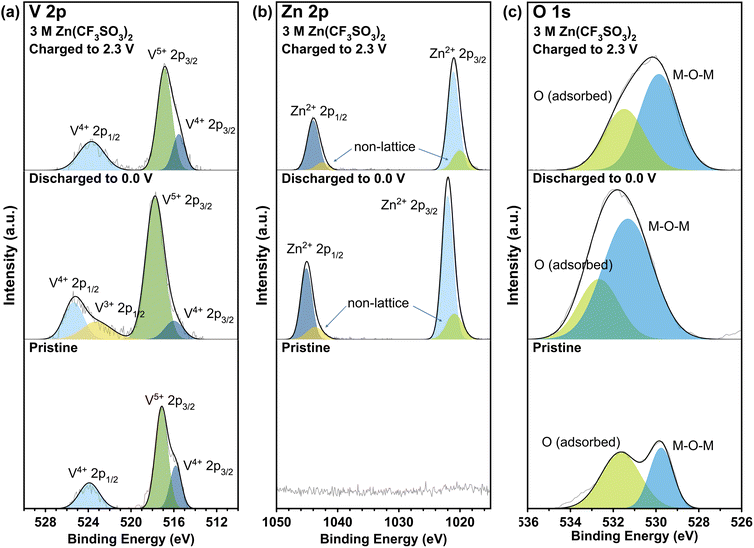 | ||
| Fig. 6 XPS analysis of (a) V 2p, (b) Zn 2p, and (c) O 1s orbitals for VO-H3O cathode material with 3 M Zn(CF3SO3)2 electrolyte at different states of cycling. | ||
Meanwhile, the XPS spectra of Zn 2p orbital (Fig. 6b) confirmed the presence of Zn2+ ions in the cathode material with the high peak intensities of Zn2+ 2p3/2 and 2p1/2 species at 1022 and 1045 eV, respectively.46,47 In addition, small peaks were observed next to the main peaks, corresponding to non-lattice Zn ions from the electrolyte.48 However, these peaks remained even in the fully charged state, but with reduced intensities, indicating incomplete de-insertion of Zn2+ ions. In Fig. 6c, two peaks were observed in all three states, with the pristine state having the lowest intensities for the peaks centered at 529.8 and 531.7 eV for lattice oxygen (bonded to metal M = M–O–M) and oxygen adsorbed on the surface.30–32 At 0.0 V (discharged state), the peak correlating to oxygen from the M–O–M bond had undergone a significant increase in peak intensity and shifted to 531. 3 eV. After charging, the peaks shift back to the original binding energy seen in the pristine state. The shift in binding energy and increase in peak intensity may correspond to Zn2+ ions insertion into the host cathode material, which involves the bond formation between lattice oxygen and Zn2+ ions. Therefore, XPS analysis for the cycled cathode provided evidence to support the findings from electrochemical studies on the reversibility of VO-H3O as cathode material in Zn(CF3SO3)2 electrolyte, mainly in the redox reactions of V species. This supports the observed high reversibility of VO-H3O cathode in Zn(CF3SO3)2 aqueous electrolyte solution from the electrochemical evaluation and post-mortem analysis from XRD and SEM results in Fig. 5.
Mechanism investigation via DFT calculations
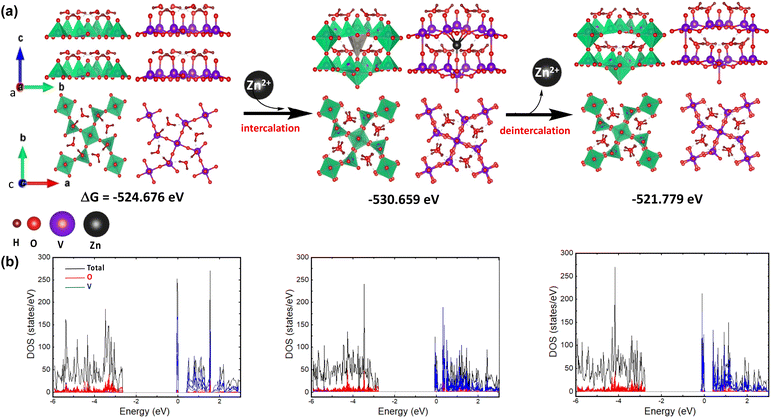
The geometric configuration of the two-layer V3O8(H3O)2 is systematically optimized for both the pristine state (prior to and after intercalation) and its Zn2+-intercalated counterpart. The DFT-optimized geometry of the analyzed substances is illustrated in Fig. 7. Interestingly, it can be observed that Zn2+ intercalation induces structural rearrangement at the center of the bilayer supercell without a notable effect on the overall cell volume. However, the intercalation results in a spontaneously stabilized system, as revealed by DFT energy calculations. On the other hand, the pristine bilayer structure of V3O8(H3O)2 was not fully restored after deintercalation, revealing an energy difference (ΔG°) of 2.9 eV through DFT calculations. As such, it can be suggested that the layered structure of V3O8(H3O)2 after deintercalation may facilitate the subsequent intercalation process; hence, promoting the charging–discharging process. Moreover, the density of states (DOS) for all analyzed geometries indicates that the O p orbitals play a pivotal role in the valence bands, while the V d orbitals are significant contributors to the conduction bands.Conclusion
In conclusion, hydrothermal method was used for the formation of a layered vanadium oxide, V3O8(H3O)2, using ammonium metavanadate and oxalic acid under moderate reaction conditions. Characterization techniques confirmed the formation of the layered compound with V in two oxidation states (+4 and +5). As a cathode active material against Zn/Zn2+, V3O8(H3O)2 showed high reversibility and impressively stable cycling at 1 A g−1 with favorable specific capacities achieved with Zn(CF3SO3)2 aqueous electrolyte. Significant enhancements were observed in the electrochemical performance of V3O8(H3O)2 compared to conventional V2O5. Findings from DFT calculations suggest a structural change that occurs during cycling and appears to be irreversible after the de-intercalation of Zn2+ ions, which may have hindered the performance of the cathode material. Further investigations on the structural stability and mechanism are required for this material as it has been applied as a cathode material for ZIBs for the first time in this work.Data availability
Data are available upon request from the authors.Conflicts of interest
The authors declare no conflict of interest.Acknowledgements
This work was funded by Qatar University’s Collaborative Grant program with project number QUCG-CAS-22/23-602. The authors would like to acknowledge the contribution of Qatar University's Central Laboratories Unit (CLU) for the microscopic and spectroscopic analyses and Center of Advanced Materials (CAM) for the XRD analysis. XPS analysis was accomplished in part in the Gas Processing Center, College of Engineering, Qatar University.References
- A. R. Dehghani-Sanij, E. Tharumalingam, M. B. Dusseault and R. Fraser, Renewable Sustainable Energy Rev., 2019, 104, 192–208 Search PubMed.
- L. Talens Peiró, G. Villalba Méndez and R. U. Ayres, JOM, 2013, 65, 986–996 CrossRef.
- S. Hess, M. Wohlfahrt-Mehrens and M. Wachtler, J. Electrochem. Soc., 2015, 162, A3084–A3097 CrossRef CAS.
- M. Dalal, J. Ma and D. He, Proc. Inst. Mech. Eng. O, 2015, 225, 81–90 Search PubMed.
- A. P. Johnson, Encyclopedia of Electrochemical Power Sources, 2009, pp. 111–119 Search PubMed.
- Z. Pan, J. Yang, J. Jiang, Y. Qiu and J. Wang, Mater. Today Energy, 2020, 18, 100523 CrossRef CAS.
- C. Xu, B. Li, H. Du and F. Kang, Angew. Chem., Int. Ed., 2012, 51, 933–935 CAS.
- Y. Zhang, A. Chen and J. Sun, J. Energy Chem., 2021, 54, 655–667 CrossRef CAS.
- M. Song, H. Tan, D. Chao and H. J. Fan, Adv. Funct. Mater., 2018, 28, 1802564 CrossRef.
- J. Hur, Nanomaterials, 2022, 12(13), 2293 CrossRef CAS PubMed.
- Q. Wen, H. Fu, Z. Wang, Y. Huang, Z. He, C. Yan, J. Mao, K. Dai, X. Zhang and J. Zheng, J. Mater. Chem. A, 2022, 10, 17501–17510 RSC.
- Z. Yi, G. Chen, F. Hou, L. Wang and J. Liang, Adv. Energy Mater., 2021, 11, 2003065 CrossRef CAS.
- L. Li, S. Yue, S. Jia, C. Wang, H. Qiu, Y. Ji, M. Cao and D. Zhang, Green Chem., 2024, 26, 5004–5021 RSC.
- X. Xu, F. Xiong, J. Meng, X. Wang, C. Niu, Q. An and L. Mai, Adv. Funct. Mater., 2020, 30, 1904398 CrossRef CAS.
- Y. Bai, Y. Qin, J. Hao, H. Zhang and C. M. Li, Adv. Funct. Mater., 2024, 34, 2310393 CrossRef CAS.
- Y. Bai, L. Luo, W. Song, S. Man, H. Zhang and C. M. Li, Adv. Sci., 2024, 11, 2308668 CrossRef CAS.
- Y. Bai, H. Zhang, H. Song, C. Zhu, L. Yan, Q. Hu and C. M. Li, Nano Energy, 2024, 120, 109090 CrossRef CAS.
- V. Verma, S. Kumar, W. Manalastas Jr, J. Zhao, R. Chua, S. Meng, P. Kidkhunthod and M. Srinivasan, ACS Appl. Energy Mater., 2019, 2, 8667–8674 CrossRef CAS.
- Y. De Luna and N. Bensalah, Front. Mater., 2021, 8 DOI:10.3389/fmats.2021.645915.
- W. Zhang, C. Zuo, C. Tang, W. Tang, B. Lan, X. Fu, S. Dong and P. Luo, Energy Technol., 2021, 9, 2000789 CrossRef CAS.
- Y. Li, Z. Huang, P. K. Kalambate, Y. Zhong, Z. Huang, M. Xie, Y. Shen and Y. Huang, Nano Energy, 2019, 60, 752–759 CrossRef CAS.
- Y. Zhang, M. Fan, M. Zhou, C. Huang, C. Chen, Y. Cao, G. Xie, H. Li and X. Liu, Bull. Mater. Sci., 2012, 35, 369–376 CrossRef CAS.
- H. Lindström, S. Södergren, A. Solbrand, H. Rensmo, J. Hjelm, A. Hagfeldt and S.-E. Lindquist, J. Phys. Chem. B, 1997, 101, 7717–7722 CrossRef.
- T. Liu, W. G. Pell, B. E. Conway and S. L. Roberson, J. Electrochem. Soc., 1998, 145, 1882 CrossRef CAS.
- A. Jain, S. P. Ong, G. Hautier, W. Chen, W. D. Richards, S. Dacek, S. Cholia, D. Gunter, D. Skinner, G. Ceder and K. A. Persson, APL Mater., 2013, 1, 011002 CrossRef.
- T. Lv, Y. Peng, G. Zhang, S. Jiang, Z. Yang, S. Yang and H. Pang, Adv. Sci., 2023, 10, 2206907 CrossRef CAS.
- D. Kundu, B. D. Adams, V. Duffort, S. H. Vajargah and L. F. Nazar, Nat. Energy, 2016, 1, 16119 CrossRef CAS.
- C. Yin, C. Pan, X. Liao, Y. Pan and L. Yuan, ACS Appl. Mater. Interfaces, 2021, 13, 39347–39354 CrossRef CAS.
- M. J. Powell, I. J. Godfrey, R. Quesada-Cabrera, D. Malarde, D. Teixeira, H. Emerich, R. G. Palgrave, C. J. Carmalt, I. P. Parkin and G. Sankar, J. Phys. Chem. C, 2017, 121, 20345–20352 CrossRef CAS.
- R. Muruganantham, I. V. B. Maggay, L. M. Z. De Juan, M. T. Nguyen, T. Yonezawa, C.-H. Lin, Y.-G. Lin and W.-R. Liu, Inorg. Chem. Front., 2019, 6, 2653–2659 RSC.
- M. Taha, S. Walia, T. Ahmed, D. Headland, W. Withayachumnankul, S. Sriram and M. Bhaskaran, Sci. Rep., 2017, 7, 17899 CrossRef.
- H. Qu, Y. Guo, D. Zhang, B. Sun and L. Yan, J. Sol–Gel Sci. Technol., 2022, 104, 138–146 CrossRef CAS.
- R. L. Frost, S. J. Palmer, J. Čejka, J. Sejkora, J. Plášil, S. Bahfenne and E. C. Keeffe, J. Raman Spectrosc., 2011, 42, 1701–1710 CrossRef CAS.
- P. Schwendt and D. Joniaková, Chem. Zvesti, 1975, 29, 381–386 CAS.
- A. Akande, Int. J. Chem. Mol. Mater. Metall. Eng., 2017, 11(1), 78–81 Search PubMed.
- S. Baluchová, M. Brycht, A. Taylor, V. Mortet, J. Krůšek, I. Dittert, S. Sedláková, L. Klimša, J. Kopeček and K. Schwarzová-Pecková, Anal. Chim. Acta, 2021, 1182, 338949 CrossRef.
- I. M. Ashraf, M. Farouk, F. A. Ahmad, M. Okr, M. Abdel-Aziz and E. Yousef, Dig. J. Nanomater. Biostruct., 2019, 14, 805 Search PubMed.
- F. Cui, J. Zhao, D. Zhang, Y. Fang, F. Hu and K. Zhu, Chem. Eng. J., 2020, 390, 124118 CrossRef CAS.
- J. F. Parker, J. S. Ko, D. R. Rolison and J. W. Long, Joule, 2018, 2, 2519–2527 CrossRef CAS.
- M. H. Alfaruqi, V. Mathew, J. Song, S. Kim, S. Islam, D. T. Pham, J. Jo, S. Kim, J. P. Baboo, Z. Xiu, K.-S. Lee, Y.-K. Sun and J. Kim, Chem. Mater., 2017, 29, 1684–1694 CrossRef CAS.
- Y. Tan, F. An, Y. Liu, S. Li, P. He, N. Zhang, P. Li and X. Qu, J. Power Sources, 2021, 492, 229655 CrossRef CAS.
- Q. Zong, Y. Wu, C. Liu, Q. Wang, Y. Zhuang, J. Wang, D. Tao, Q. Zhang and G. Cao, Energy Storage Mater., 2022, 52, 250–283 CrossRef.
- S. Joshi, N. Smieszek and V. Chakrapani, Sci. Rep., 2020, 10, 17121 CrossRef CAS PubMed.
- Y. Choi, D. Lee, S. Song, J. Kim, T.-S. Ju, H. Kim, J. Kim, S. Yoon, Y. Kim, T. B. Phan, J.-S. Bae and S. Park, Adv. Electron. Mater., 2021, 7, 2000874 CrossRef CAS.
- W. Wang, B. Jiang, W. Xiong, H. Sun, Z. Lin, L. Hu, J. Tu, J. Hou, H. Zhu and S. Jiao, Sci. Rep., 2013, 3, 3383 CrossRef.
- X. Zhai, J. Qu, H. Shu-Meng, Y.-Q. Jing, W. Chang, J. Wang, W. Li, Y. Abdelkrim, H. Yuan and Z.-Z. Yu, Nano–Micro Lett., 2020, 2020, 56 CrossRef PubMed.
- A. Sahai and N. Goswami, AIP Conf. Proc., 2015, 1665, 050023 CrossRef.
- G. Kesavan and S.-M. Chen, J. Mater. Sci.: Mater. Electron., 2021, 32, 9377–9391 CrossRef CAS.
Footnote |
| † Electronic supplementary information (ESI) available. See DOI: https://doi.org/10.1039/d4ra06871h |
| This journal is © The Royal Society of Chemistry 2024 |

