 Open Access Article
Evaluation of a same-metal PCB-based three-electrode system via impedance studies using potassium ferricyanide
Prince Nishchal Narayanaswamy Elumalai a,
Chethan C. Thimmarayappaa,
Sara Talebib,
Ramesh T. Subramaniamc,
Ramesh Kasi
 c,
Mitsumasa Iwamotod,
Georgepeter Gnana Kumar
 e and
Vengadesh Periasamy
 *ab
*ab
aLow Dimensional Materials Research Centre (LDMRC), Department of Physics, Faculty of Science, Universiti Malaya, 50603 Kuala Lumpur, Malaysia. E-mail: vengadeshp@um.edu.my
beProfiler Solutions Malaysia Sdn Bhd, Universiti Malaya, Suite 3.5, Level 3, UM Innovation Incubator Complex, 50603 Kuala Lumpur, Malaysia
cCentre for Ionics Universiti Malaya (CIUM), Department of Physics, Faculty of Science, Universiti Malaya, 50603 Kuala Lumpur, Malaysia
dInstitute of Science Tokyo, Tokyo 152-8550, Japan
eDepartment of Physical Chemistry, School of Chemistry, Madurai Kamaraj University, Madurai 625021, Tamil Nadu, India
First published on 4th November 2024
Abstract
We report for the first time the successful acquisition of electrochemical impedance spectroscopy data using an unconventional same-metal PCB-based three-electrode system. Conventional three-electrode systems primarily require expensive and bulky electrodes, and a high volume of analytes to conduct electrochemical impedance spectroscopy studies. The miniaturized PCB-based three-electrode system used in this work requires only trace amounts of analytes in the order of 10–20 μL owing to the design of the electrode sensor. Prominent standard redox probe potassium ferricyanide was used for impedance spectroscopic characterization studies. The results obtained were in congruence with existing literature; additionally the PCB-based three-electrode system demonstrated significantly higher repeatability, reproducibility, and consistency across different models of electrochemical instrumentations. Interestingly, the electrochemical impedance spectroscopy data of the PCB-3T sensor exhibited a consistent semi-circular impedance curve on a Nyquist plot and two distinct phase change regions on a Bode plot indicative of a simplified Randles cell model with an excellent circuit fit. Additionally this model provides an accurate impedance model for analysing trace analytes of potassium ferricyanide. Based on the circuit fitting model, potassium ferricyanide samples of varying concentrations at 1 mM, 5 mM, 10 mM, 15 mM and 20 mM demonstrated characteristic EIS charge transfer resistance corresponding to 435, 300, 233, 72 and 55 kΩ, respectively, and solution resistance of 260, 254, 218, 169 and 157 Ω, respectively. Therefore, the proposed novel same-metal three-electrode sensor can be employed in effective analysis and detection of samples with high accuracy and high sensitivity for trace amounts of analytes.
1 Introduction
Electrochemical Impedance Spectroscopy (EIS) being a non-destructive technique to study the electrical properties of an electrochemical system has been an indispensable tool in investigating the fundamental aspects of electrical and electrochemical properties of materials. EIS is commonly used to study the behavior of electrochemical interfaces, such as electrode–electrolyte interfaces.1–3 It provides information about processes occurring at the interface, including charge transfer kinetics, double-layer capacitance, and adsorption/desorption phenomena.4,5 EIS has also been extensively employed in the characterization and analysis of energy storage devices, such as batteries, supercapacitors and fuel cells.2,3,6–8 It has also been utilized in coatings, characterization of electrochemical sensors, impedance-based cell analysis in biomedical applications, tissue impedance measurements, electroplating and electrodeposition applications. It helps in understanding the electrochemical performance, impedance behavior, and degradation mechanisms of these devices.8–12EIS involves applying a small AC voltage or current to the system and measuring the resulting alternating current or voltage.1,2 By analyzing the complex impedance of the system as a function of frequency, information about the system's electrical properties can be obtained. The impedance of an electrochemical system is a complex quantity that consists of a real part (resistance) and an imaginary part (reactance). The resistance represents the opposition of the system to the flow of direct current (DC), while the reactance represents the opposition to the flow of alternating current (AC) at different frequencies. Nyquist plot is a common method used to analyze the data obtained from EIS. The Nyquist plot of an EIS measurement is a plot of the imaginary part of the impedance (Z′′) versus the real part of the impedance (Z′), where each point on the plot corresponds to a particular frequency of the AC signal.2,13–15 Bode plot is another complementary analysis technique to analyze and interpret the EIS data, it is a logarithmic plot showing the change of impedance magnitude and phase as a function of frequency. In the Nyquist plot, impedance in the polar form is presented without any direct correlation to the frequency domain; however Bode plot is a dual-y axis plot that correlates the changes in impedance to the frequency response and helps to understand the interface interactions at different applied frequencies.2,16
In practice and convention, the three-electrode configuration consisting of a counter electrode (CE), reference electrode (RE) and working electrode (WE) are typically prepared from separate materials making them expensive, bulky and requiring specific cleaning processes. In contrast, screen-printed electrodes in the market are enhanced application-specific sensors, which require elaborate manufacturing processes and are potentially expensive based on the material required for fabrication.12,16,17 The screen-printed sensors are portable, assist in rapid measurements, and have the potential of being mass-produced to reduce costs.8 These types of electrodes are selectively adjusted to respond to target analytes using specific materials that bind and enhance the detection of the target analytes in the printing processes.18 Recently, a novel printed circuit board (PCB)-based same-metal three-electrode system (PCB-3T) for cyclic voltammetry (CV) analysis has been reported.19 The characteristics of this system demonstrated low CV activation cycles, high accuracy, and repeatable results using only trace amounts of sample in the order of few μL. The main advantage of this state-of-the-art innovation enables generic and universal electrochemical sensing for various analytical techniques such as EIS, CV, linear sweep voltammetry (LSV), chronoamperometry and square wave voltammetry (SWV) without the need for any specific coatings on the electrodes. In this study, we demonstrate for the first time the acquisition of EIS data analysis using an unconventional three-electrode/terminal (3T) system in which gold was utilized as the counter, working and reference electrodes fabricated on a PCB.
Potassium ferricyanide dissolved in potassium chloride solution was used as the standard solution to measure the impedance spectroscopy in both conventional three-electrode system and the same-metal PCB-3T system [Patent Pending, PI2020001607, PCT/MY2020/050100, WO2021194334A1]. Potassium ferricyanide (K3[Fe(CN)6]) has long served as a benchmark compound for studying redox reactions due to its well-defined redox potential, high solubility, minimal adsorption to electrodes and wide electrochemical window.17,19 Its characteristic reversible one-electron redox couple involving the conversion of ferric ion (Fe(III)) to ferrous ion (Fe(II)) makes it an ideal model system for investigating electron transfer kinetics, double-layer capacitance, and charge transfer resistance.20
Electrochemical analysis of potassium ferricyanide using PCB-3T sensor was conducted at varying concentrations using EIS-CV protocol (EIS is conducted first on the PCB-3T sensor followed by CV measurement). The PCB-3T sensor was connected to the electrochemical workstation using the RWC (Reference-Working-Counter) connection configuration as this is the most optimal electrode connection configuration for the same-metal PCB-3T.19 EIS data obtained were analysed using both Nyquist and Bode plots, plus an equivalent circuit model for potassium ferricyanide was obtained using the EIS data. Furthermore, CV data obtained in the experiments concurred with the results obtained in our previously published work19 demonstrating very high repeatability and reproducibility. The EIS data demonstrated a stable impedance curve with high accuracy and repeatability even at low frequencies which is normally a challenge in typical EIS experiments.15,21 The equivalent circuit model from EIS data can be used to approximate the experimental impedance data for potassium ferricyanide and to extract information of dominant processes, study of interfacial phenomena, estimate the kinetic parameters such as charge transfer reactions, diffusion coefficients and surface adsorption.5
2 Materials and methods
2.1 Reagents and chemicals
EIS experiments were conducted using chemicals and reagents that were of analytical grade, having a purity of 99% or greater. 99% Pure potassium ferricyanide (K3[Fe(CN)6]) and potassium chloride were sourced from Sigma-Aldrich. Solvent for potassium ferricyanide was prepared using deionized ultra-pure water and 0.1 M potassium chloride (KCl) at 24 °C room temperature. Potassium ferricyanide was dissolved in the solvent at 24 °C room temperature to obtain an analyte solution at variable concentrations of 1 mM, 5 mM, 10 mM, 15 mM and 20 mM.2.2 Fabrication of PCB-3T platform
The in-house designed novel PCB based same-metal electrode sensors as shown in Fig. 1 were manufactured by Asia Printed Circuits, Malaysia using gold (Au) as the electrode material due to its inert nature. The sensors have a form factor of 15 × 15 mm. Fig. 1(a) shows the PCB board with dimension 120 × 75 mm consisting of an array of 40 PCB-3T sensors, as shipped from the manufacturer. Fiberglass-resin laminate (FR4) with thickness of 1.6 mm was chosen as the base for the PCB. Copper imaging process was applied at a thickness of 36 μm. Polymer film that is sensitive to ultraviolet (UV) light was coated on the panel. Chemical photo-developing process was used to wash the unexposed dry polymer film. Gold electrodes were electrolytically plated at a thickness of 0.049 to 0.052 μm (2 μin) on a nickel (Ni) base layer at a thickness of 4–5 μm. The PCB was then cleaned19,22 to remove any residual dry polymer and copper from the board. The PCB was finally coated with a solder mask exposing only the areas of the electrode and connection pad.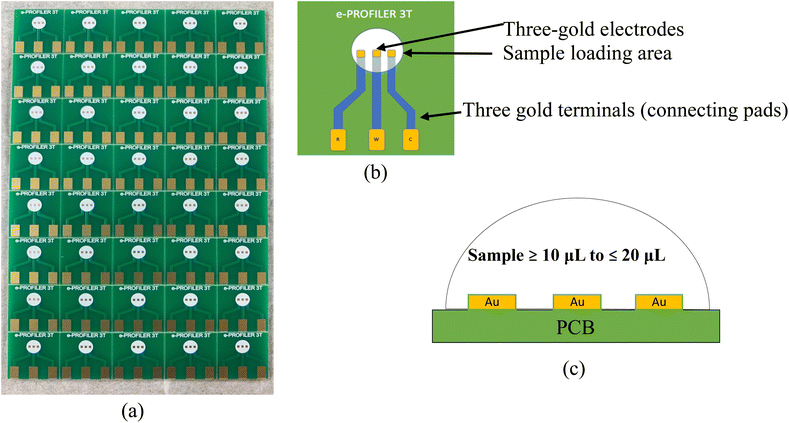 | ||
| Fig. 1 Image showing the (a) proprietary PCB-3T electrode array on a 120 × 75 mm PCB board, (b) schematic top view of PCB-3T sensor and (c) schematic lateral view of PCB-3T loading area. | ||
2.3 Cleaning process for PCB-3T platform
The PCB-3T sensors were fabricated on a PCB board consisting of an array of 8 × 5 sensors per board (Fig. 1(a)). To properly clean the sensors, the electrodes were first broken into individual pieces from the PCB board and rinsed with distilled water in a glass beaker. The electrodes were then arranged in a glass beaker sequentially to avoid placing them on each other. They were immersed fully using acetone and sonicated for 15 min at room temperature (about 24 °C degrees) to dislodge any dust and residue. Following which, the acetone was discarded and the sensors rinsed with double distilled water and a final bath in ethyl alcohol was performed. The sensors were then placed in an oven to dry at 50 °C for 10 min. After the drying process, the sensors were stored securely in a sealed container. Adequate care was taken during cleaning, handling and experimentation by avoiding any physical contact on the gold electrodes to minimize contamination of the electrode surfaces due to touch/handling.2.4 Experimental procedure for conventional three-electrode setup
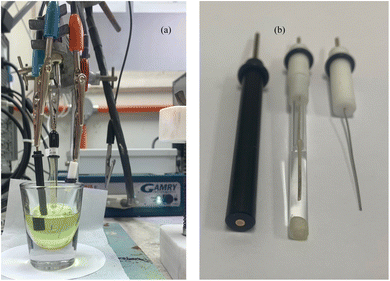
Experiments were conducted using Gamry Interface 1010E, Gamry Reference 600, and Metrohm Autolab multichannel PGSTAT101 potentiostat/galvanostat for assessing the stability and repeatability of the obtained EIS-CV data across different electrochemical instrumentations. Gold disk and glassy carbon electrodes were used as the working electrodes, platinum wire as the counter electrode, and Ag/AgCl as the reference electrode in the study (Fig. 2(a)). The electrodes were prepared by first rinsing them in distilled water, then dried using a clean tissue and rinsing them with ethyl alcohol.10 mL of 5 mM potassium ferricyanide at room temperature was used to obtain the EIS-CV data. EIS measurements were performed in the frequency range of 1 MHz to 0.5 Hz at 10 mV amplitude. CV measurements meanwhile were performed in the range of −0.7 to 0.8 V (versus Ag/AgCl reference electrode) and at a potential scan rate of 100 mV s−1. Electrochemical activation of 10 cycles at 20 mV s−1 was performed. All experiments were conducted at 24 °C at a relative humidity of 70%; analysis of data was carried out using the software Gamry Echem Analyst v6.33, Metrohm Nova v2.1.6, Aftermath v1.6.10523 and Origin Pro 2021.
2.5 Experimental procedure for PCB-3T setup
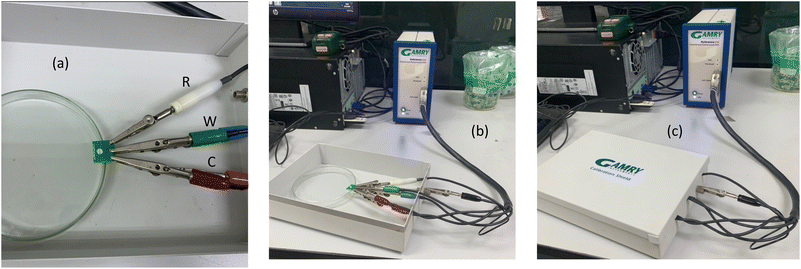
Gamry Interface G1010E, Gamry reference 600 and Metrohm Autolab multichannel PGSTAT101 electrochemical platforms were used in the experimentation with the PCB-3T sensor connected using RWC (Reference-Working-Counter) connection layout as shown in the layout in Fig. 3(a). Analytes in small trace amounts ranging from 10, 12.5, 15, 17.5, 20 and 30 μL of 5 mM potassium ferricyanide in KCl solution were loaded using a micropipette for the study of volumetric impact on the loading bay. Studies of dipping the PCB-3T sensor into a 10 mL glass vial were also conducted. 1 min incubation time at room temperature of 24 °C was maintained to stabilize the microdroplet. Electrochemical activation of 2 cycles at 20 mV s−1 in the potential range of −0.7 to +0.8 V steps were conducted, prior to the acquisition of CV data at 50 mV s−1 and 100 mV s−1. Brand-new PCB-3T sensors were employed for each experiment, while previously utilized sensors were discarded. Experiments using varying concentrations of potassium ferricyanide at 1 mM, 5 mM, 10 mM, 15 mM and 20 mM were also conducted to study the EIS and CV analysis using PCB-3T. CV and EIS studies using 15 μL blank solution of deionized ultra-pure water and 0.1 M KCl solution were performed on the PCB-3T sensor at room temperature of 24 °C.As illustrated in Fig. 3(b) and (c), a Faraday cage enclosure was used to shield the PCB-3T sensor from external electromagnetic interference and to improve the signal-to-noise ratio, especially for experiments involving low currents and high frequencies.23,24 The PCB-3T sensors will be repurposed for metal extraction at a recycling facility post experimentation, promoting environmentally sustainable practice in sensor management.
3 Results and discussion
3.1 Acquisition of EIS and CV using conventional three-electrode system
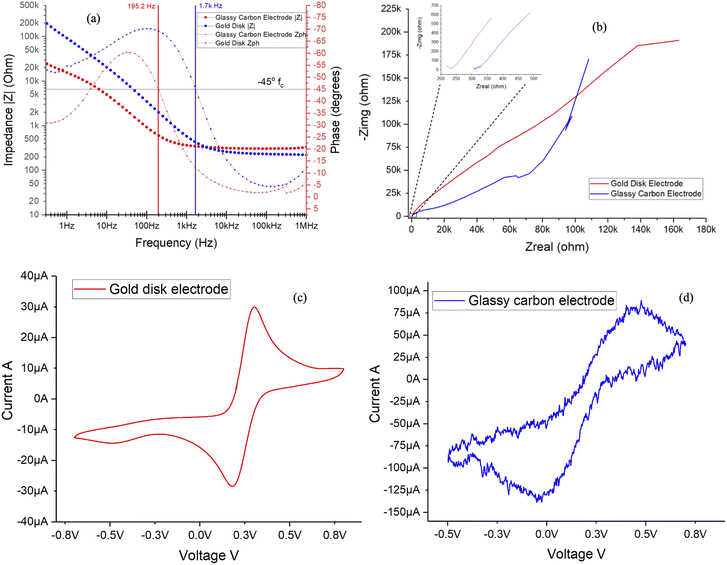
Conventional electrochemical cell experiments require at least 10 mL of solution to completely immerse the electrodes in the cell to perform the experiment, studies employing gold disk and glassy carbon electrode as working electrode were performed separately using Gamry Interface 1010E potentiostat for EIS and CV studies. The EIS and CV findings were consistent with the established literature17,19 and demonstrated replicability in repeated experiments.From Fig. 4(a) Bode plot, horizontal line intersecting the phase angle curve at 45°, the critical frequency (fc) can be determined. For glassy carbon electrode, above the critical frequency of 195.2 Hz, the double layer capacitance and charge polarization due to combination of kinetic and diffusion processes5 are the dominant factors influencing the impedance; at frequencies below this, resistive charge transfer and bulk resistance of the electrolyte are the prevailing processes in the impedance spectra. Likewise for the gold disk electrode, the impedance due to double layer capacitance can be observed above 1.7 kHz and at frequencies below this, charge transfer resistance takes precedence indicating polarization resistance as the dominant process allowing easier conduction through the least resistance path for current flow. Referring to the inset from Fig. 4(b) at high frequencies, the ohmic solution resistance for 5 mM potassium ferricyanide solution was found to be 230 and 310 Ω, respectively for gold disk and glassy carbon electrodes, aligned with the findings reported in literature.2
The CV profile in Fig. 4(c) using gold disk electrode demonstrates one electron oxidation potential at around 0.38 V, in agreement with established literature which reports 0.36 V versus the standard hydrogen electrode.25,26 Hence the CV profiles for both gold disk and glassy carbon electrodes aligns with the data published in prior research and within acceptable ranges for potassium ferricyanide redox probe. CV currents of +30 to −30 μA is apparent for gold disk electrode, while higher currents in the range of +80 to −135 μA is evident for the glassy carbon electrode as shown in Fig. 4(d), probably due to higher affinity of potassium ferricyanide to carbon-based materials.2,15 However due to the surface imperfections of glassy carbon electrode contact to the electrolyte, it exhibits a jagged and rough CV curve which is clearly indicative of surface irregularities and anomalies.27
3.2 EIS and CV studies on PCB-3T for variable microdroplet volume
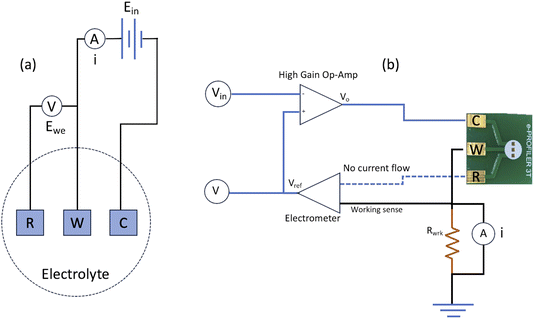
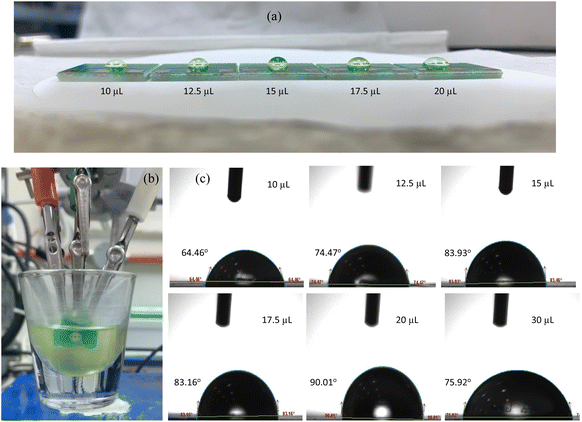
Three-electrode cell connection schematic shown in Fig. 5(a) depicts the electronic connection configuration among the working, reference and counter electrodes. In a three-cell setup, primary function of the reference electrode is to measure the potential experienced by working electrode in a reliable and reproducible manner, and to compensate for iR drop across the analyte.2,15,28 Based on the illustration in Fig. 5(b), an ideal electrometer has an infinite impedance and zero currents flowing through it. Working sense and reference electrodes are connected to this high impedance system that acts as a feedback loop, signalling the high gain op-amp to accurately drive the potential at working electrode to the desired level. Thereby, it is evident from the potentiostat schematic that no current flow path exists between the reference and working electrodes, hence no redox current flow through the reference electrode. The redox reaction currents would only flow through the working electrode and the role of the counter electrode is therefore to pass all current required to balance the currents at working electrode in the PCB-3T sensor.The PCB-3T sensor schematic shown in Fig. 1(b) features a circular sample loading area measuring 4 mm in diameter, an effective surface area of 12.57 mm2 and an approximate hemispherical volume of 16.755 mm3. This substantial sample loading area can accommodate microdroplets of diverse dimensions, and an investigation to study the impact of microdroplet volume on EIS and CV data is essential to comprehend the effects of microdroplets on PCB-3T sensor. To accomplish this, EIS-CV studies using small volume of analyte and influence of microdroplet size were performed. Therefore, experiments using microdroplet volumes of 10, 12.5, 15, 17.5, 20 and 30 μL on PCB-3T sensor as shown in Fig. 6(a) were conducted and compared against data from experiment of PCB-3T sensor immersed fully into a glass vial of significantly larger volume of 10 mL potassium ferricyanide analyte covering fully up to the sample loading area (Fig. 6(b)). Contact angle measurements and surface tension measurements for microdroplets were performed using Biolin Scientific Attension Theta Lite optical tensiometer at 24 °C at ambient humidity of 70%.
Observations from Fig. 6(c) depicts the images of various droplet shapes, along with their corresponding contact angles and diameter spread on the sample loading area. Data tabulated in Table 1, demonstrates a positive correlation between microdroplet volume and contact angle up to a volume of 20 μL, beyond which it demonstrates a decreasing trend. As with the surface tension it has a negative correlation for microdroplet volume up to 20 μL, after which it shows an increasing trend. When the droplet volume exceeds 20 μL, electrolyte sample overflows (and breaking the surface tension) from the sample loading area on the sensor for potassium ferricyanide indicating 20 μL as the maximum permissible volume on the loading area of PCB-3T sensor. From Fig. 6(c), the microdroplet image of 15 μL depicts nearly an ideal hemispherical shape and significantly higher contact angle of 84.30° and stable surface tension of 32.7903 mN. This volume visually seems to be the most suitable microdroplet dimension for EIS-CV studies with respect to the surface area, hemispherical shape and droplet geometry.
| Parameter | Unit | Potassium ferricyanide varying droplet size on PCB-3T | |||||
|---|---|---|---|---|---|---|---|
| 10 μL | 12.5 μL | 15 μL | 17.5 μL | 20 μL | 30 μL | ||
| CA baseline | ° | 64.46° | 74.47° | 83.93° | 83.16° | 90.01° | 75.92° |
| CA mean | ° | 67.37° | 80.17° | 84.30° | 90.33° | 98.74° | 73.82° |
| Surface tension | mN m−1 | 43.329 | 35.373 | 32.790 | 29.025 | 23.842 | 39.350 |
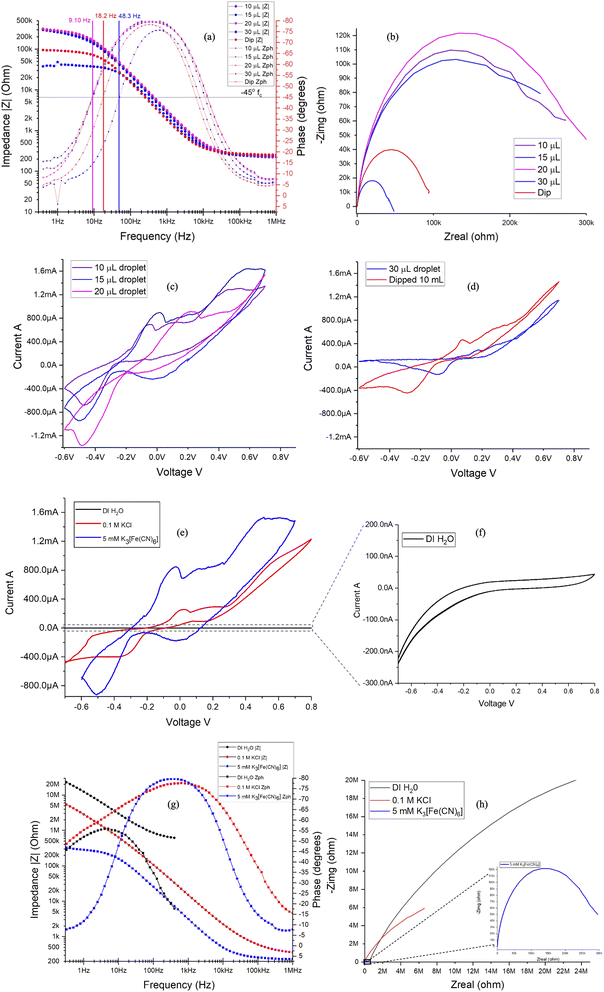
Furthermore, examining the results of EIS data from Fig. 7(a) and (b) corresponding to the Bode and Nyquist plots, significant correlation between the data points and microdroplet volume is clearly evident. Marked overlap of phase angle, critical frequency (fc), modulus of impedance, real and imaginary impedances are observed for 10, 15 and 20 μL droplet. This further supports the conclusion that any droplet volume between 10 to 20 μL produces similar results. This validates the choice of 15 μL as a preferred standard microdroplet volume for the PCB-3T sensors for this study. Data observed for microdroplet size of 30 μL volume and for PCB-3T sensor immersed in 10 mL analyte (conventional method) contrasts the findings of 10, 15 and 20 μL experiments further adding to the evidence that surface tension and contact angle plays a vital role in the characteristic EIS response generated using the PCB-3T sensors. The ideal microdroplet volume and dynamics can therefore be understood to result in enhanced specificity and sensitivity of the electrochemical measurements.
EIS circuit fitting was carried out using the Aftermath software and tabulated in Table 2. Analysis of the data revealed substantial intersection of constant phase element Q1, solution resistance Rs and charge transfer resistance Rct values for 10, 15 and 20 μL with variance below 3%, which is virtually a negligible variance further corroborating that any microdroplet volume within 10 to 20 μL will exhibit identical response. Therefore, any microdroplet volume within this range would elicit an identical and acceptable response for the PCB-3T sensor, hence the study offers insights into the influence of analyte volume on EIS and CV measurements using PCB-3T sensor. CV data from Fig. 7(c) shows a correlated congruent overlapping CV curves for 10, 15 and 20 μL droplets, likewise from Fig. 7(d) CV curves of 30 μL droplet and immersed sensors were relatively proximate in range but deviate from the curves generated by the microdroplets of 10, 15 and 20 μL volume. This complementary study of CV provides additional evidence that microdroplet volumes in the range of 10 to 20 μL would produce identical outcomes on the PCB-3T sensor. In summary, both EIS and CV studies converge on the same conclusions regarding the impact of the microdroplet volume on the PCB-3T sensor.
| Element | Parameter | Unit | 5 mM K3[Fe(CN)6] variable microdroplet on PCB-3T | ||||
|---|---|---|---|---|---|---|---|
| 10 μL | 15 μL | 20 μL | 30 μL | Dip | |||
| a Q is Constant Phase Element (CPE), R is resistance in ohms, α is an empirical constant and χ2 is chi-squared test statistic. | |||||||
| Q1 (CPE) | Q | sα Ω−1 | 1.34 × 10⁻⁷ | 1.40 × 10⁻⁷ | 1.30 × 10⁻⁷ | 2.06 × 10⁻⁷ | 2.17 × 10⁻⁷ |
| Q1 (α) | α | — | 0.891933 | 0.902686 | 0.899089 | 0.884807 | 0.894905 |
| Rs | R | Ω | 225.411 | 225.182 | 228.839 | 242.037 | 253.655 |
| Rct/Rp | R | Ω | 310![[thin space (1/6-em)]](https://www.rsc.org/images/entities/char_2009.gif) 293 293 |
310![[thin space (1/6-em)]](https://www.rsc.org/images/entities/char_2009.gif) 112 112 |
311![[thin space (1/6-em)]](https://www.rsc.org/images/entities/char_2009.gif) 306 306 |
44![[thin space (1/6-em)]](https://www.rsc.org/images/entities/char_2009.gif) 662.5 662.5 |
101![[thin space (1/6-em)]](https://www.rsc.org/images/entities/char_2009.gif) 530 530 |
| χ2 | — | 2.398 | 4.86864 | 1.28512 | 5.11298 | 3.3 | |
For a comprehensive evaluation of the sensor, blank studies using DI H2O and 0.1 M KCl were conducted on the PCB-3T. A visual analysis of Fig. 7(e) and (f) reveals very small currents in the range of −200 nA to 50 nA for DI ultra-pure water, indicating high purity of the water sample. In contrast, when a supporting electrolyte like 0.1 M KCl was employed, significantly higher currents between −400 μA to 1.2 mA were observed (Fig. 7(e)), which is the expected response for supporting electrolytes in an electrochemical system. Furthermore, from analysing Fig. 7(e), the contribution of the redox current due to potassium ferricyanide is clearly evident from the experimental data demonstrating the high sensitivity of the same-metal PCB-3T sensor. The EIS Bode plot data from Fig. 7(g) shows clear differences on the phase and impedances for DI H2O, 0.1 M KCl and 5 mM K3[Fe(CN)6]. DI H2O exhibited very high impedance close to 20 MΩ at lower frequencies and some discontinuities at high frequencies, Nyquist data plot from Fig. 7(h) corroborates the earlier observations. Nyquist data of KCl shows an impedance of close to 5 MΩ at low frequencies that is markedly different from the impedance profile of potassium ferricyanide from inset of Fig. 7(h). These findings are characteristic across the various samples, hence the same-metal PCB-3T sensor has broad applications in the electrochemical field.
3.3 Acquisition of EIS-CV data for multi concentrations analytical studies
To understand the dynamic range, sensitivity and selectivity of the same metal PCB-3T sensor, multi-concentration studies using potassium ferricyanide redox probe at varying concentrations of 1, 5, 10, 15 and 20 mM were studied at 15 μL microdroplet size on PCB-3T sensor using Gamry Reference 600 potentiostat. Bode analysis of EIS data for different concentrations in Fig. 8(a) shows distinct correlation of phase change and impedance magnitude to the concentrations. Using the Randles cell model, critical frequencies, fc were determined to be 164.9 Hz for 20 mM, followed by 93.5 Hz for 15 mM and 10 mM, then 17.6 Hz for 5 mM and 8.66 Hz for 1 mM, implying impedance of the analyte is primarily due to charge transfer resistance at frequencies higher than the critical frequency and capacitive impedance dominates impedance at lower frequencies. The computed fc reveals a direct positive correlation between critical frequency and concentration of the analyte.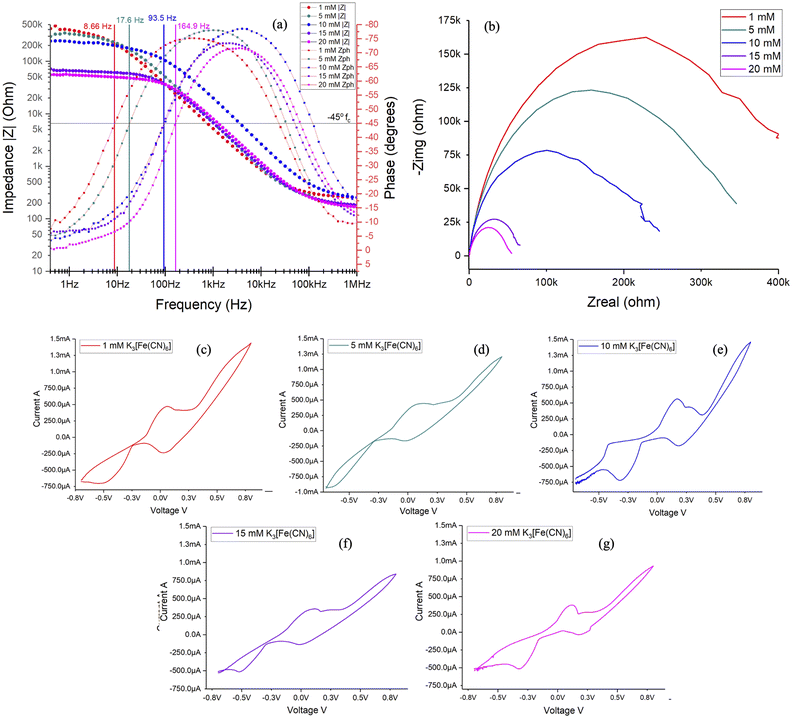 | ||
| Fig. 8 (a) illustrates the Bode plot, (b) Nyquist plot and (c–g) CV profiles of 1, 5, 10, 15 and 20 mM, respectively of potassium ferricyanide performed using Gamry Reference 600 potentiostat. | ||
Nyquist data from microdroplet experiments (Fig. 7(b)) and multi-concentration experiments (Fig. 8(b)) using PCB-3T sensor both demonstrate distinct semi-circular profiles for impedance of potassium ferricyanide, contrasting the results of conventional three-electrode system seen in Fig. 3(b). Consistent with the literature, semi-circular region occurs only at very high frequencies29 for the conventional electrodes, the results from Fig. 3(b) demonstrates the same characteristic in our experiment, however on PCB-3T sensor we observe high degree of correspondence to Randle's cell model at all frequencies which implies that the microdroplet size and PCB-3T sensor electrode design significantly contribute to this characteristic observation. Further with respect to the PCB-3T sensor, Nyquist and Bode plots demonstrated pronounced repeatability and consistent results over multiple iterations, indicative of a sensor with high sensitivity and accuracy. CV data from Fig. 8(c)–(g) shows the redox potentials peaks of potassium ferricyanide at 200 mV with peak separation of 70 mV and peak current of 500 μA congruent to the literature for PCB-3T sensor.19 Typically redox potential of ferricyanide is around 360 mV (versus the standard hydrogen electrode) with peak separation of 50 to 60 mV and peak current of 30 μA for gold disk electrode.2,20 However, the PCB-3T demonstrated peak current more than 20 orders and slight shift in redox potential attributed to the droplet geometry, surface dynamics and the higher intensity of the applied electric field onto a small microdroplet area.
3.4 EIS analysis using equivalent circuit model
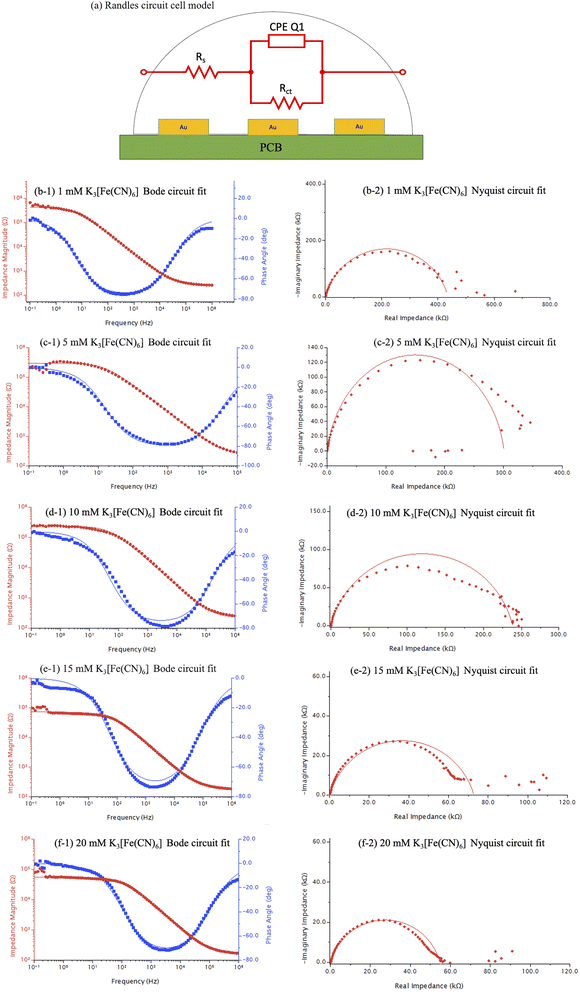
EIS curve fitting were performed using Aftermath software by importing the datasets of Gamry EIS format into the software. Simplified Randles circuit as demonstrated in Fig. 9(a) consists of a resistor (Rs) representing the solution resistance typically observed at frequencies higher than the critical frequency, double layer capacitance represented by a capacitive phase element (CPE Q1) typically found at frequencies below critical frequency, charge transfer resistance (Rct/Rp) between the electrolyte and electrode material, and Warburg impedance (Zw) when diffusional mass transfer is dominant.Critical frequency for a Randles cell refers to the frequency at which the capacitive impedance and charge transfer impedance become comparable in magnitude, at 45° on the phase axis a horizontal line intersecting the phase curve provides the critical frequency from a Bode plot. Likewise, the magnitude of the impedance from the Nyquist plot at the critical frequency can be obtained by finding an intersection point on the Nyquist curve at 45°. From the circuit fit analysis, the use of a simplified Randles cell circuit model was sufficient to accurately model and fit the EIS data curves of Bode plots and Nyquist plots with high degrees of curve overlaps (Fig. 9(b-1) to (f-2)) for potassium ferricyanide on PCB-3T sensors.
From Table 3, solution resistances of 157, 169, 218, 254 and 259 Ω for 20, 15, 10, 5 and 1 mM concentrations, respectively demonstrate a negative correlation between solution resistance and molarities. Similar trend for charge transfer resistances can be observed from the tabular data at 54, 72, 232, 300 and 434 kΩ for 20, 15, 10, 5 and 1 mM concentrations, respectively. The charge transfer resistance decreases with concentration as higher amount of electroactive species in the sample is available at the electrode surface for redox reactions and facilitates electron flows.30 This is consistent and expected from the electrochemical impedance studies found in literature31,32 as well as in the experimental results above. The Tafel plot30,33 for EIS data across concentrations indicates a linear relationship between the logarithm of concentration to charge transfer resistances as deduced from the data for the curve fitting parameters. Q1 (α) parameter indicates a near ideal capacitive response analysis,34,35 when α = 1 and phase angle of −90°, indicative of a pure capacitive impedance response. When 0 < α < 1, the CPE parameter deviates from the ideal capacitive behaviour, exhibiting phase angle between 90° and 0°. This deviation is often attributed to factors of surface roughness, inhomogeneity or adsorption at the electrode–electrolyte interface.5,34
| Element | Parameter | Unit | Potassium ferricyanide 15 μL droplet on PCB-3T | ||||
|---|---|---|---|---|---|---|---|
| 20 mM | 15 mM | 10 mM | 5 mM | 1 mM | |||
| a Q is Constant Phase Element (CPE), R is resistance in ohms, sα Ω−1 is Siemens to the power of N squared per ohm (n = 0 then resistance and n = 1 then capacitance), α is an empirical constant order and χ2 is chi-squared test statistic. | |||||||
| Q1 (CPE) | Q | sα Ω−1 | 8.01 × 10⁻⁸ | 1.11 × 10⁻⁷ | 3.15 × 10⁻⁸ | 5.18 × 10⁻⁸ | 1.15 × 10⁻⁷ |
| Q1 (α) | α | — | 0.839575 | 0.827142 | 0.855273 | 0.909297 | 0.846336 |
| Rs | R | Ω | 157.455 | 169.837 | 218.02 | 254.259 | 259.612 |
| Rct/Rp | R | Ω | 54![[thin space (1/6-em)]](https://www.rsc.org/images/entities/char_2009.gif) 641 641 |
72![[thin space (1/6-em)]](https://www.rsc.org/images/entities/char_2009.gif) 669.4 669.4 |
232![[thin space (1/6-em)]](https://www.rsc.org/images/entities/char_2009.gif) 973 973 |
300![[thin space (1/6-em)]](https://www.rsc.org/images/entities/char_2009.gif) 663 663 |
434![[thin space (1/6-em)]](https://www.rsc.org/images/entities/char_2009.gif) 905 905 |
| χ2 | — | 1.05871 | 1.38213 | 0.64595 | 1.72202 | 0.420694 | |
Values of α observed to be very close to 1 indicates significant capacitive impedances prominent of double layer capacitance between the electrode and electrolyte interface; this also corroborates to the high homogeneity of the gold electrode surface. The EIS characteristics observed in PCB-3T in comparison to conventional three-electrode system demonstrates high degree of dynamic range and sensitivity even at very small measuring analyte concentrations. The simplified Randles cell was able to model the circuit fit with high degree of accuracy for all concentrations and multi-droplet experiments performed on the PCB-3T sensor for potassium ferricyanide whereby the results of the study indicate that the proposed sensor is versatile in its applications.
4 Conclusions
EIS analysis on the PCB-3T sensor exhibits higher resolution, less noise and discrete measurements using EIS circuit fit model compared to CV analysis. The sensors demonstrate versatility across diverse range of electrochemical analytical techniques, requiring only trace analyte volume. Contrary to the conventional three-electrode system, this unconventional approach utilizes horizontal form factor with equidistant electrodes, totally submerged in the microdroplet region. The sensor has an effective electrochemical sensing range at volumes between 10 to 20 μL. 15 μL volume of analyte was deduced as the ideal volume for experimentation based on surface-tension dynamics of the droplet and complete coverage of the loading bay area with the analyte. Further the RWC connection configuration enhanced the sensitivity and current resolution minimising the IR drop across the same metal electrodes in the sensor. We demonstrate for the first time highly reproducible EIS data across different electrochemical platforms with higher dynamic ranges in concentration measurements. Therefore, we infer that this sensor is potentially beneficial for researchers in related fields of study and could be applied in various electrochemical techniques such as square wave voltammetry, differential pulse voltammetry, chronoamperometric studies etc. The PCB-based design proposed in this work enables practical implementation within point-of-care devices for interdisciplinary applications.Data availability
Data for this article, including raw data files, analysis files are available at repository “Experimental data for EIS & CV using PCB-3T” at https://doi.org/10.17605/OSF.IO/R7VBA.Author contributions
P. N. Elumalai performed all experimental works and wrote the manuscript; C. C. Thimmarayappa wrote the manuscript; M. Iwamoto, R. T. Subramaniam, R. Kasi, G. Kumar and S. Talebi provided supervision and discussion; V. Periasamy provided the supervision and wrote the manuscript; all authors have read and approved the final version of the manuscript.Conflicts of interest
There are no conflicts to declare.Acknowledgements
This research was financially supported by the Ministry of Education Malaysia Fundamental Research Grant Scheme (FRGS) (FP065-2023)/1/2023/STG05/UM/02/4.Notes and references
- S. Wang, J. Zhang, O. Gharbi, V. Vivier, M. Gao and M. E. Orazem, Nat. Rev. Methods Primers, 2021, 1, 41 CrossRef.
- M. E. Orazem and B. Tribollet, Electrochemical Impedance Spectroscopy, Wiley, 2011 Search PubMed.
- R. Tatara, P. Karayaylali, Y. Yu, Y. Zhang, L. Giordano, F. Maglia, R. Jung, J. P. Schmidt, I. Lund and Y. Shao-Horn, J. Electrochem. Soc., 2019, 166, A5090 Search PubMed.
- L. I. Daikhin, A. A. Kornyshev and M. Urbakh, Phys. Rev. E: Stat. Phys., Plasmas, Fluids, Relat. Interdiscip. Top., 1996, 53, 6192–6199 CrossRef PubMed.
- V. F. Lvovich, Impedance Spectroscopy: Applications to Electrochemical and Dielectric Phenomena, 2015, ISBN: 9781118164099 Search PubMed.
- B. E. Conway, J. Electrochem. Soc., 1991, 138, 1539 CrossRef.
- B. Padha, S. Verma, P. Mahajan and S. Arya, J. Electrochem. Sci. Technol., 2022, 13, 167–176 CrossRef.
- A. M. Musa, J. Kiely, R. Luxton and K. C. Honeychurch, Biosensors, 2023, 13, 491 CrossRef PubMed.
- N. Waters, R. Connolly, D. Brown and B. Laskowski, PHM 2014 – Proceedings of the Annual Conference of the Prognostics and Health Management Society 2014, 2014, vol. 6, pp. 748–753 Search PubMed.
- I. O. K'Owino and O. Sadik, Electroanalysis, 2005, 17, 2101–2113 CrossRef.
- H. Cesiulis, N. Tsyntsaru, A. Ramanavicius and G. Ragoisha, in Nanostructures and Thin Films for Multifunctional Applications: Technology, Properties and Devices, ed. I. Tiginyanu, P. Topala and V. Ursaki, Springer International Publishing, Cham, 2016, pp. 3–42, DOI:10.1007/978-3-319-30198-3_1.
- L. Fiore, A. Sinha, N. Seddaoui, J. di Biasio, F. Ricci, G. M. Stojanovic and F. Arduini, Chem. Commun., 2023, 59, 4300–4303 RSC.
- J. Huang, Z. Li, B. Y. Liaw and J. Zhang, J. Power Sources, 2016, 309, 82–98 CrossRef CAS.
- D. Morales and M. Risch, J. Phys.: Energy, 2021, 3, 034013 CAS.
- A. J. Bard, L. R. Faulkner and H. S. White, Electrochemical Methods: Fundamentals and Applications, John Wiley & Sons, 2022 Search PubMed.
- A. Rubino and R. Queirós, Talanta Open, 2023, 7, 100203 CrossRef.
- Y. Koç, M. Uğur, S. Erol and H. Avci, Turk. J. Chem., 2021, 45(6), 1895–1915 Search PubMed.
- S. Singh, J. Wang and S. Cinti, ECS Sens. Plus, 2022, 1, 023401 CrossRef CAS.
- V. Periasamy, P. N. N. Elumalai, S. Talebi, R. T. Subramaniam, R. Kasi, M. Iwamoto and G. Gnana Kumar, RSC Adv., 2023, 13, 5744–5752 RSC.
- P. Virbickas, A. Valiūnienė, D. Baryševa, G. Popkirov and A. Ramanavičius, J. Electroanal. Chem., 2021, 895, 115449 CrossRef CAS.
- J. Lazar, C. Schnelting, E. Slavcheva and U. Schnakenberg, Anal. Chem., 2016, 88, 682–687 CrossRef CAS.
- S. Siddhaye and P. Sheng, Integration of environmental factors in process modelling for printed circuit board manufacturing, II. Fabrication, Proceedings of the 1997 IEEE International Symposium on Electronics and the Environment. ISEE-1997, 1997, DOI:10.1109/ISEE.1997.605322.
- L. Cheng, R. Jin, D. Jiang, J. Zhuang, X. Liao and Q. Zheng, Anal. Chem., 2021, 93, 16401–16408 CrossRef CAS PubMed.
- T. Wang, H. Lin, Y. Wu, Z. Guo, T. Hao, Y. Hu, S. Wang, Y. Huang and X. Su, Biosens. Bioelectron., 2020, 163, 112277 CrossRef CAS PubMed.
- G. Jerkiewicz, ACS Catal., 2020, 10, 8409–8417 CrossRef CAS.
- J. E. O'Reilly, Biochim. Biophys. Acta, Bioenerg., 1973, 292, 509–515 CrossRef PubMed.
- D. Menshykau, I. Streeter and R. G. Compton, J. Phys. Chem. C, 2008, 112, 14428–14438 CrossRef.
- A. W. Colburn, K. J. Levey, D. O'Hare and J. V. Macpherson, Phys. Chem. Chem. Phys., 2021, 23, 8100–8117 RSC.
- S. Vogt, Q. Su, C. Gutiérrez-Sánchez and G. Nöll, Anal. Chem., 2016, 88, 4383–4390 CrossRef PubMed.
- O. van der Heijden, S. Park, R. E. Vos, J. J. J. Eggebeen and M. T. M. Koper, ACS Energy Lett., 2024, 9, 1871–1879 CrossRef PubMed.
- P. T. Ha, H. Moon, B. H. Kim, H. Y. Ng and I. S. Chang, Biosens. Bioelectron., 2010, 25, 1629–1634 CrossRef.
- R. Attias, B. Dlugatch, M. S. Chae, Y. Goffer and D. Aurbach, Electrochem. Commun., 2021, 124, 106952 CrossRef.
- D. Li, C. Lin, C. Batchelor-McAuley, L. Chen and R. G. Compton, J. Electroanal. Chem., 2018, 826, 117–124 CrossRef CAS.
- M. Jaugstetter, N. Blanc, M. Kratz and K. Tschulik, Chem. Soc. Rev., 2022, 51, 2491–2543 RSC.
- P. Leuaa, D. Priyadarshani, D. Choudhury, R. Maurya and M. Neergat, RSC Adv., 2020, 10, 30887–30895 RSC.
| This journal is © The Royal Society of Chemistry 2024 |

