DOI:
10.1039/D4RA07079H
(Paper)
RSC Adv., 2024,
14, 39844-39857
Production of pazopanib hydrochloride nanoparticles (anti-kidney cancer drug) using a supercritical gas antisolvent (GAS) method
Received
2nd October 2024
, Accepted 28th November 2024
First published on 18th December 2024
Abstract
Supercritical fluid-based methods have been receiving increasing popularity in the production of pharmaceutical nanoparticles due to their ability to control the size and distribution of the particles and offer high purity products. The gas anti-solvent method is one of the methods in which a supercritical fluid serves as an anti-solvent. The aim of this work is to develop pazopanib hydrochloride nanoparticles as an anti-cancer agent by the supercritical GAS method. For this purpose, nanoparticles were produced at different temperatures (313, 323 and 333 K), pressures (10, 13 and 16 MPa), and initial solute concentrations (12, 22 and 32 mg ml−1) employing the Box–Behnken design. The results showed that pressure had the most significant effect on the particle size. The average initial particle size of unprocessed pazopanib hydrochloride was about 37.5 ± 8.7 μm. The optimum process parameter values were determined to obtain the smallest particle size using the BBD method. The parameters were optimized at 320 K, 16 MPa, and 12.6 mg ml−1. The average particle size was 311.1 nm, close to the predicted value of 302.3 nm. FTIR analysis indicated that the chemical structure remained unaltered. Furthermore, DSC and XRD results confirmed the reduction in particle size.
1 Introduction
The current advancements in the field of cancer treatment have made many cancers curable. The survival rate of kidney cancer patients is very high, and if this disease is diagnosed in time, it can be cured. However, if this cancer progresses and spreads to other organs, the treatment becomes more complicated and the probability of success decreases.1 Pazopanib hydrochloride (PAZ), with the molecular formula of C21H23N7O2S·HCl and molecular weight of 473.991 g mol−1, is one of the drugs for the treatment of kidney- and soft tissue-cancers. Known by the brand name of Votrient, PAZ slows down tumor growth by reducing its blood supply.2 This drug is used in the treatment of kidney cancer, soft tissue carcinoma and also in tumors that develop around muscles, joints, various body organs and blood vessels.3 PAZ has a low water solubility (about 0.0433 mg ml−1), categorizing it in class II of the biopharmaceutical classification system (BCS). At pH 1 (practically at pH > 4), it rarely dissolves in water. Its nanocrystallization, however, increases its dissolution and efficiency in the body.4 New methods have been developed for producing pharmaceutical particles on micro- or nano-scale with controlled particle size distribution and quality of crystals in terms of purity and geometric shape. Exploiting the special characteristics of supercritical fluids (SCFs), these methods are generally flexible, simple, and eco-friendly compared to other processes. The application of SCF as an alternative to the conventional precipitation process has been studied in the last two decades.5–9 Supercritical processes have many variations according to their operational goals. As mentioned above, the solubility of a medicinal substance in supercritical carbon dioxide (SC-CO2) is one of the effective parameters in choosing the production method of nanoparticles. One of the most important of these methods is the supercritical gas antisolvent (GAS), which is widely used in the pharmaceutical industry to produce small pharmaceutical particles. The use of SC-CO2 for the production of nanoparticles has been widely reported in the GAS process.10–19 Compared to other liquid solvents, SCFs allow the production of high purity materials, crystallization of materials, and production of small crystals. In the pharmaceutical industry, nano drugs offer high absorption, low side effects, and more effective performance. The production of uniform crystals in terms of particle size distribution is very important in injectable drugs. This technology is of great interest for hydrophobic drugs.20,21 One of the common fluids used in SCF technology is CO2, with a critical pressure of 7.38 MPa and a critical temperature of 304.2 K making it suitable for various processes. Therefore, it is possible to work with SC-CO2 near the ambient temperature, preventing the decomposition of temperature sensitive materials. Noteworthy, using SC-CO2 will eliminate or reduce the use of toxic or contaminated organic solvents. SC-CO2 can be easily separated from the resulting product by reducing the pressure. The high solubility of most organic solvents in supercritical fluids will result in the formation of a solvent-free product. In addition, carbon dioxide is a non-toxic, non-flammable, and low-cost liquid.22–27 The GAS process was first used for recrystallization. This method is especially useful for the crystallization of sensitive substances such as drugs, biological substances, and flammable substances at normal temperature. In the GAS method, high-pressure gas or SCF acts as an antisolvent for crystallizing or precipitation of a solid substance dissolved in an organic solvent. In this process, the antisolvent gas is highly soluble in the liquid solvent, causing volumetric expansion. Therefore, its density and solubility power decrease, resulting in the crystallization of the dissolved component. Most of the articles in this field address the effects of operating conditions, such as temperature, pressure, and concentration of the solute in the solution, on the size and size distribution of the formed particles, as listed in Table 1. The GAS process exploits the dissolution of gases in organic liquids to lower the solvation power of the liquid compared to the dissolved one, leading to the precipitation of the dissolved solid.28,29 The solid component is dissolved in the organic solvent until saturation, followed by exposure to the SCF under supercritical or near critical conditions. If the SCF dissolves well in an organic solvent (for example, CO2), the dissolved solid substance will be supersaturated when the SCF dissolves in the organic solvent, leading to the crystallization of this component. The main goal of this project was the laboratory production of PAZ nanoparticles by the GAS method for the first time. Given the solubility of this drug as measured in the previous work,2 it was decided to use the GAS method to produce PAZ pharmaceutical nanoparticles. For this purpose, operating conditions such as pressure (10, 13 and 16 MPa), temperature (313, 323 and 333 K), and concentration of solute (12, 22 and 32 mg ml−1) were assessed to produce more effective nanoparticles through the response surface method (RSM) with the help of Design Expert software. Finally, the shape, particle size, particle size distribution, purity, and nature of the particles were evaluated by X-ray diffraction (XRD), Fourier transform infrared spectroscopy (FTIR), differential scanning calorimetry (DSC), scanning electron microscopy (SEM), and dynamic light scattering (DLS) analyses.
Table 1 Some articles on the GAS method in the production of pharmaceutical particles
| Drug |
Method |
Solvent |
Particle size |
Reference |
| Lysozyme |
GAS |
DMSO |
180–300 nm |
30 |
| Paclitaxel |
GAS |
DMSO/H2O |
117–200 nm |
31 |
| Trans-resveratrol |
GAS |
Acetone |
21–32 nm |
32 |
| 5-Fluorouracil |
GAS |
DMSO |
260–600 nm |
33 |
| Crystalline β-carotene |
GAS |
DCM |
0.5–5 μm |
34 |
| Cholesterol |
GAS |
Acetone |
— |
35 |
| Paracetamol |
GAS |
Acetone |
50 and 250 μm |
36 |
| Phenanthrene |
GAS |
Toluene |
21–210 μm |
37 |
| Ginkgo-ginkgolides |
GAS |
Ethanol |
0.8–240 μm |
38 |
| Beclomethason-17,21-dipropionate |
GAS |
Acetone |
1.8–43.9 μm |
39 |
| Caffeine |
GAS |
Chloroform |
26.3–128.3 μm |
40 |
| Carbamazepine |
GAS |
Acetone, ethyl acetate, DCM |
50–285 nm |
41 |
| Theophylline |
GAS |
Ethanol |
10–15 μm |
42 |
| Sulfamethoxazole |
GAS |
Acetone, methanol, ethanol |
27–266 μm |
43 |
| Sertraline hydrochloride |
GAS |
DMSO |
102–500 μm |
44 |
| Puerarin |
GAS |
Acetone, methanol, ethanol |
29.7–49.26 μm |
45 |
| Posaconazole + 4-aminobenzoic acid |
GAS |
Acetonitrile |
20–43 μm |
46 |
| Poly(ε-caprolactone) |
GAS |
Acetone |
53–135 μm |
47 |
| Paracetamol |
GAS |
Ethanol, TEO |
— |
48 |
| Naproxen + nicotinamide |
GAS |
Acetone |
40–80 μm |
49 |
| Mefenamic acid + polyvinylpyrrolidone |
GAS |
Acetone, ethanol |
— |
50 |
| Mefenamic acid + paracetamol |
GAS |
Acetone |
1–350 μm |
51 |
| Liposome |
GAS |
Ethanol, chloroform |
0.1–10 μm |
52 |
| Levothyroxine sodium |
GAS |
Ethanol |
370–500 μm |
53 |
| Ketoconazole-4-aminobenzoic acid |
GAS |
Methanol, ethanol, acetone |
12.8–14 μm |
54 |
| Itraconazole/L-malic acid |
GAS |
THF |
— |
55 |
| Ibuprofen |
GAS |
Methanol, ethanol |
1–3 μm |
56 |
| Griseofulvin |
GAS |
Dimethylformamide |
0.5–500 μm |
57 |
| Gastroresitant |
GAS |
Acetone, DMSO |
1–2 μm |
58 |
| 5-Fluorouracil + nanoclay |
GAS |
Methanol |
— |
59 |
| Finasteride |
GAS |
DMSO |
333.56–1432.9 nm |
60 |
| Curcumin |
GAS |
Acetone, ethanol, acetonitrile, methanol |
— |
61 |
| Copper indomethacin |
GAS |
DMSO, DMF, NMP |
<100 μm |
62 |
| Cimetidine |
GAS |
Methanol, dichloromethane |
3.1–26.7 μm |
63 |
| Carbamazepine–nicotinamide |
GAS |
Ethanol |
— |
64 |
| Carbamazepine |
GAS |
Methanol |
— |
65 |
| Capecitabine |
GAS |
DMSO |
243.3–1090.9 nm |
66 |
| Aspirin |
GAS |
Methanol, acetone |
48–124 μm |
67 |
| Tobramycin |
GAS |
Methanol |
<500 nm |
68 |
| Hydrocortisone/PVP composites |
GAS |
Ethanol |
— |
69 |
| Phentamidine and ethyl cellulose |
GAS |
Acetone, DMSO |
0.5–1 μm |
70 |
| Lysozyme |
GAS |
DMSO |
0.05–0.2 μm |
71 |
| L-Asparagi |
GAS |
C2H6O, H2O |
20–200 μm |
72 |
| L-Ascorbic acid |
GAS |
C2H6O |
<100 μm |
72 |
| C60(CO2)0.95 |
GAS |
Toluene |
1–70 μm |
73 |
| Sulphathiazole |
GAS |
Ethanol |
6 μm |
74 |
| Polyamide |
GAS |
DMSO |
1–10 μm |
75 |
| Barium chloride & ammonium chloride |
GAS |
DMSO |
7–9 μm |
76 |
| 2–400 μm |
| Cobalt chloride |
GAS |
Acetone |
<300 μm |
77 |
| Phenanthrene |
GAS |
Toluene |
150–550 μm |
78 |
| Glibenclamide |
GAS |
DMSO |
99–386 nm |
17 |
2 Experimental section
2.1. Materials
Pazopanib hydrochloride (CAS no.: 635702-64-6) was purchased as a solute with a minimum mass purity of 99.8% from Parsian Pharmaceutical Company (Karaj, Iran). Dimethyl sulfoxide (DMSO) (CAS no.: 67-68-5) solvent with a purity higher than 99.99% was purchased from Merck (Darmstadt, Germany), and the carbon dioxide (CAS no.: 124-38-9) as a supercritical fluid of industrial grade and 99.99% purity was purchased from Zagros (Shiraz, Iran). Table 2 shows the characteristics and molecular structures of the chemicals used.
Table 2 Characteristics and molecular structures of chemicals used
| Compound |
Formula |
CAS number |
Molecular structure |
Mass fraction purity (%) |
Analysis method |
| High-performance liquid chromatography. Gas chromatography. |
| Pazopanib HCl |
C21H23N7O2S·HCl |
635702-64-6 |
 |
99.80% |
HPLCa |
| DMSO |
C2H6OS |
67-68-5 |
 |
99.99% |
GCb |
2.2. Methods
2.2.1. Experimental design (BBD). The design of experiments (DOE) technique is a quality improvement technique. Using statistical experimental design methods can facilitate the design and production stages of new products and improve the existing ones. These principles have been used in most industries, such as the medical equipment, food, pharmaceutical, and chemical processing industries.79 Response surface design methods were first developed for chemistry, physics and biology. Owing to their reliable results, they are also used in the pharmaceutical industry. RSM, in short, involves the use of mathematical methods and statistical techniques to build experimental models. In these methods, in addition to the main effects between factors, it is possible to estimate interactive effects (quadratic) and interaction between factors (mutual effects). The response surfaces, or the local form of the response surfaces, are easily accessible and checked by examining the interactions between the factors. Box–Behnken design (BBD) and central composite designs (CCD) are some response surface design methods.51,80,81 In this article, the BBD experimental design method was used to produce PAZ pharmaceutical nanoparticles by the GAS method. As seen in Table 3, the effects of three effective parameters on the size of produced particles were studied (pressure (X1), temperature (X2) and initial concentration of solutes (X3)).
Table 3 Parameters and their various ranges for the purpose of BBD design
| Coded levels |
Pressure (X1, MPa) |
Temperature (X2, K) |
Solute concentration (X3, mg ml−1) |
| −1 |
10 |
313 |
12 |
| 0 |
13 |
323 |
22 |
| +1 |
16 |
333 |
32 |
As shown in Table 3, the considered variables were designated as pressure (X1), temperature (X2), and solute concentration (X3) and examined at three levels coded as −1, 0, and 1, indicating high, intermediate and low values, respectively. For the sake of statistical calculations, the relationship between the coded and actual values was described as follows.
| |
 | (1) |
Here,
Xi is the coded value of the respective variable,
Zi is the actual value corresponding to the
Xi, and
Z0 denotes the actual value at the center point. Accordingly, Δ
Z expresses the step change of the considered variable. The three variables were mathematically modeled using a quadratic polynomial model whose coefficients were calculated through a multiple regression analysis. The general form of this model is as follows.
| |
 | (2) |
Here,
Y represents the predicted response,
A0 is a constant coefficient,
Ai is the first-order linear coefficient,
Aii is the quadratic coefficient,
Aij is the coefficient of interaction,
Xi and
Xj are coded levels of the respective independent variable, and
ε is the associated random error.
82
2.2.2. GAS process equipment. A schematic of the GAS process equipment is shown in Fig. 1. CO2 was inside the cylinder (E1) and passed through a filter (pore size 1 μm) (E2). Then, the CO2 was liquefied by passing through the condenser (E3). Liquefied CO2 was pumped by a high pressure pump (type-CA 91502, Burbank, CA, USA) (E5). A valve on–off (E6) to control CO2 was located on the output flow from the pump. CO2 was heated by a spiral heat exchanger (E8). The rotary heat exchanger was located inside the oven (E7) and before the precipitation vessel (E9). The volume of the crystallizer was 100 ml. The pressure was adjusted by the back pressure regulating valve (type-1/4FNPT, Xi'an Shelok Instrument Technology Co.) (E11). The particles were collected on a sintered metal filter (E10) located at the end of the crystallizer.
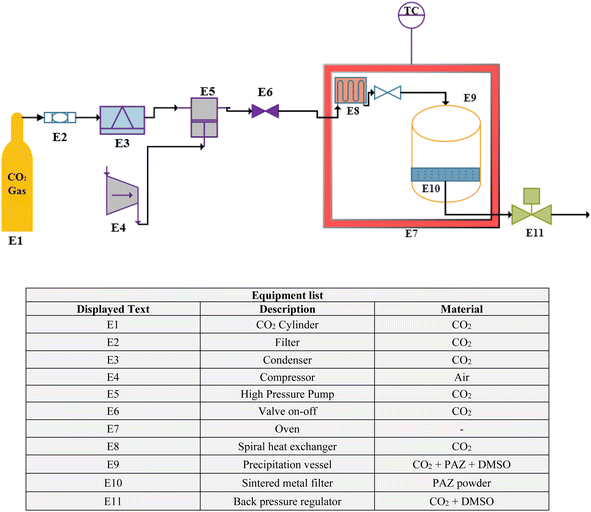 |
| | Fig. 1 Schematic of the GAS process equipment. | |
2.2.3. Experimental procedure. The desired substance for the production of nanoparticles (PAZ) was dissolved in DMSO. The initial concentration in the solvent was considered to be 12, 22 or 32 mg ml−1. 5 ml of this solution was sent into the crystallizer through a syringe. The oven was turned on and the temperature was 313, 323 or 333 K with an accuracy of ±0.1 K. CO2 was injected at a constant rate of 5 bar min−1 until the system reached the desired pressure (10, 13 or 16 MPa) with an accuracy of ±0.1 MPa. Then, the pump was turned off and the system was allowed to equilibrate for 60 min. After that, CO2 was introduced into the system so that the excess solvent was removed from the environment. In this case, it must be ensured that the system pressure is at the same pressure as before the pump was turned off, because, otherwise, there is a possibility that the precipitated materials will dissolve in the solvent from the decline of the pressure. The intensity of the constant flow of CO2 on the particles continued (4 g min−1 for 180 min) until all the solvent was removed from the system and the particles were dried. The particles settled on the filter at the end of the crystallizer. Finally, the pressure of the crystallizer decreased and reached ambient pressure. The crystallizer cell was opened and the particles were collected for FTIR, DLS, XRD, SEM and DSC analyses.
2.2.4. Particle characterization. In this project, in accordance with studies conducted in the field of production of pharmaceutical nanoparticles by the GAS process, various devices were used to characterize the physical and chemical characteristics. Fourier transform infrared (FTIR) (Tensor II, Bruker Co., Germany) spectroscopy is based on the absorption of radiation and the investigation of vibrational mutations of molecules. This method was used to determine the structure and measure the chemical species based on spectra in the range 400–4000 cm−1.In differential scanning calorimetry (DSC) (TA Co., USA), thermal analysis addresses the changes in material characteristics by temperature variations. By interpreting DSC results, a wide range of physical properties of materials can be determined. This analysis was conducted from ambient temperature up to 300 °C and at a maximum rate of 10 °C min−1.
Scanning electron microscopy (SEM) (MIRA III, TESCAN Co., Czech Republic) analysis was used for microstructural examinations to enlarge and analyze different parts of the samples. In this method, imaging is done with the help of electron beams (about 1–30 electron volts).
Dynamic light scattering (DLS) (SZ-100, Horiba Co., Japan) determines the size of particles and their distribution in liquids. However, for a wide range of applications, such as the pharmaceutical field, where it is necessary to disperse particles in a liquid, the behavior of particles in liquids should also be investigated. Therefore, 1 mg of produced PAZ nanoparticles was dissolved in 3 ml of deionized water and placed in a warm water bath (30 °C) for 10 minutes.
X-ray diffraction (XRD) (D8 ADVANCE, Bruker Co., Germany) is a rapid analytical method to identify the phase of a crystalline material. It can also offer some information on the chemical composition. This analysis was done in the angle range of 10° to 80°.
3 Results and discussion
3.1. Experimental design and checking the results of the Box–Behnken method
The goal of this project was to produce PAZ pharmaceutical nanoparticles. First, nanoparticles of this drug were prepared by the GAS method at different process conditions using the BBD response surface method. Based on this design, the average particle size (X50) was considered as the output variable (response) and the required number of experiments was found to be 15. Then experiments (L-15) were conducted using Design Export software 7.0.0 considering 3 parameters of temperature (313, 323 and 333 K), pressure (10, 13 and 16 MPa), and concentration of the solute (12, 22 and 32 mg ml−1) according to Table 4. The response relationships with different variables were determined by the BBD approach considering the coded factors using the multiple regression analysis of the experimental results. The relationship between the response and significant variables (pressure (X1), temperature (X2) and solute concentration (X3)) can be described using the following second-order quadratic polynomial equation.| | |
X50 = 22.88 − 2.94X1 + 1.01X2 + 2.08X3 + 0.31X1X2 + 0.19X1X3 + 0.049X2X3 − 0.94X12 + 1.08X22 + 1.13X32
| (3) |
Table 4 Operational conditions for the production of PAZ nanoparticles in this research with GAS process using the BBD method
| Run |
X1 |
P (MPa) |
X2 |
T (K) |
X3 |
Solute concentration (mg ml−1) |
Mean particle size (x50 – nm) |
Predicted value (nm) |
Polydispersity index (PDI) |
| 1 |
+1 |
16 |
+1 |
333 |
0 |
22 |
455.2 |
461.3 |
0.24 |
| 2 |
−1 |
10 |
+1 |
333 |
0 |
22 |
739.8 |
718.2 |
0.48 |
| 3 |
−1 |
10 |
−1 |
313 |
0 |
22 |
641.9 |
635.8 |
0.60 |
| 4 |
−1 |
10 |
0 |
323 |
+1 |
32 |
759.1 |
779.9 |
0.56 |
| 5 |
0 |
13 |
−1 |
313 |
+1 |
32 |
696.1 |
681.4 |
0.57 |
| 6 |
0 |
13 |
0 |
323 |
0 |
22 |
530.4 |
523.6 |
0.35 |
| 7 |
0 |
13 |
−1 |
313 |
−1 |
12 |
494.1 |
493.6 |
0.46 |
| 8 |
0 |
13 |
0 |
323 |
0 |
22 |
535.7 |
523.6 |
0.19 |
| 9 |
−1 |
10 |
0 |
323 |
−1 |
12 |
570.3 |
576.8 |
0.58 |
| 10 |
0 |
13 |
+1 |
333 |
+1 |
32 |
787.5 |
787.9 |
0.53 |
| 11 |
+1 |
16 |
0 |
323 |
+1 |
32 |
513.3 |
506.8 |
0.49 |
| 12 |
+1 |
16 |
0 |
323 |
−1 |
12 |
331.9 |
311.1 |
0.57 |
| 13 |
+1 |
16 |
−1 |
313 |
0 |
22 |
332.9 |
354.2 |
0.54 |
| 14 |
0 |
13 |
0 |
323 |
0 |
22 |
504.7 |
523.6 |
0.36 |
| 15 |
0 |
13 |
+1 |
333 |
−1 |
12 |
562.2 |
576.9 |
0.29 |
Analysis of variance (ANOVA) is widely used in hypothesis testing and statistical research. In this method, the difference between several statistical populations is analyzed. Due to the dispersion of the total data, it is possible to examine the variance between different groups. In this way, it is possible to test the average equality between various groups. Also, in regression models, the appropriateness of the model can be evaluated by decomposing the total variance into model variance and error variance. Therefore, the quadratic model is proposed by examining the regression models (linear, two-factor interaction (2FI), quadratic, and cubic) with the help of ANOVA analysis in Design Expert software 7.0.0 (Table 5). R2 (R-square), adjusted R2, and predicted R2 were used to check the fit of the quadratic model. The predicted residual error sum of squares (PRESS = 1607.45) presents a measure of model fit for the search points in the design and can be estimated by squaring the difference between the actual predicted values at each point and the sum of squares across the total set of points. Lower PRESS values represent a better model fit into the data points. As seen in Table 5, the values of R2 (R-square) (0.9875), adjusted R2 (0.9650), and predicted R2 (0.8577) indicated the suitability of the BBD model. Moreover, the ANOVA results in Table 6 show the validity of the F-value (more) and P-value (less). The parameters with a p-value below 0.05 have a significant effect on the production process with 95% confidence, while those with a p-value greater than 0.05 have a low impact. The high F-value indicates that the regression equations well express the response variations.26,83,84 Therefore, the parameters of temperature, pressure and initial concentration of the solution have the greatest effects on the particle size, according to the F-values in Table 6.
Table 5 ANOVA results
| Source |
Std dev. |
R-Square |
Adjusted R-square |
Predicted R-square |
Sequential P-value |
Lack of fit P-value |
PRESS |
| Linear |
53.73 |
0.8843 |
0.8528 |
0.7717 |
<0.0001 |
0.0756 |
62675.46 |
| 2FI |
62.71 |
0.8854 |
0.7995 |
0.4714 |
0.9942 |
0.0515 |
1.451 × 10⁵ |
| Quadratic |
24.14 |
0.9894 |
0.9703 |
0.8577 |
0.0051 |
0.2692 |
39062.30 |
| Cubic |
16.58 |
0.9980 |
0.9860 |
|
0.2692 |
|
|
Table 6 Analysis of ANOVA for the production of PAZ pharmaceutical particles
| Source |
Sum of squares |
df |
Mean square |
F value |
P-value |
Significance |
| Model |
2.716 × 10⁵ |
9 |
30177.77 |
51.78 |
0.0002 |
Significant |
| X1 = pressure |
1.452 × 10⁵ |
1 |
1.452 × 10⁵ |
249.16 |
<0.0001 |
Significant |
| X2 = temperature |
18031.01 |
1 |
18031.01 |
30.94 |
0.0026 |
Significant |
| X3 = solute concentration |
79520.72 |
1 |
79520.72 |
136.45 |
<0.0001 |
Significant |
| X1X2 |
148.84 |
1 |
148.84 |
0.26 |
0.6348 |
No significance |
| X1X3 |
13.69 |
1 |
13.69 |
0.023 |
0.8842 |
No significance |
| X2X3 |
134.56 |
1 |
134.56 |
0.23 |
0.6512 |
No significance |
| X12 |
4845.233 |
1 |
4845.233 |
8.31 |
0.0345 |
Significant |
| X22 |
11199.71 |
1 |
11199.71 |
19.22 |
0.0071 |
Significant |
| X32 |
11693.08 |
1 |
11693.08 |
20.06 |
0.0065 |
Significant |
| Residual |
2913.93 |
5 |
582.786 |
|
|
|
| Lack of fit |
2364.07 |
3 |
788.0233 |
2.87 |
0.2692 |
No significance |
| Pure error |
549.86 |
2 |
274.93 |
|
|
|
| Cor. total |
2.745 × 10⁵ |
14 |
|
|
|
|
Fig. 2 presents the diagnostic plots of the model adequacy (model fitting) via the BBD method, which can be applied for comparison of the experimental results with the model calculated ones. As indicated in Fig. 2, the experimental results exhibited a significant proximity to the estimated data, implying good fitting to the empirical results. BBD was employed in the Design Expert software to optimize the operational conditions in order to minimize the PAZ particle size. According to this optimization, a temperature of 320 K, pressure of 16 MPa, and a solute (PAZ) concentration of 12.6 mg ml−1 were the optimum conditions.
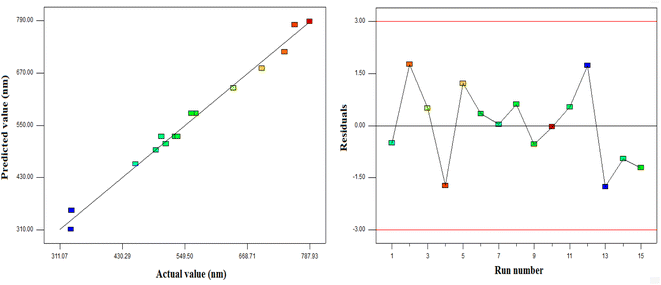 |
| | Fig. 2 Diagnostic plots for model adequacy (model fitting) from the BBD method. | |
A Pareto chart is used to highlight the most important factors. In the Pareto diagram (Fig. 3), it is clear that pressure has a significant impact (p-value < 0.0001) on the size of PAZ particles; initial concentration of the solution (p-value < 0.0001) and temperature (p-value = 0.0026) are placed in the next ranks. Moreover, according to Table 6, other parameters such as the quadratic effect of pressure (X12) (p-value = 0.0345), the quadratic effect of temperature (X22) (p-value = 0.0071), and the quadratic effect of the initial concentration of the solution (X32) (p-value = 0.0065) show that all three parameters have a quadratic effect on the particle size. The effect of other interaction parameters on particle size, such as X1X2, X1X3, and X2X3, are almost the same and are not significant.
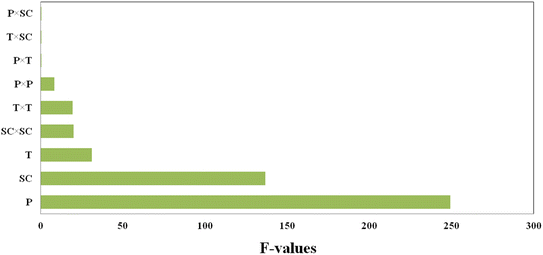 |
| | Fig. 3 Pareto chart for parameters affecting the particle size of PAZ production (P = pressure (X1), T = temperature (X2) and SC = solute concentration (X3)). | |
3.2. Investigating the effect of parameters on produced particles
Several parameters affect the quality and properties of the products, and also increase the yield and the performance of supercritical processes (GAS process), among which temperature, pressure, and initial concentration of the solution can be mentioned.
3.2.1. The effect of pressure on the production of PAZ nanoparticles. Pressure is one of the most important parameters in supercritical processes, including the GAS process, because it is one of the parameters that can be adjusted to optimize operational conditions. In general, the solubility of the anti-solvent in the organic solvent increases while the solubility of the dissolved solid decreases when raising the pressure at a constant temperature due to the volumetric expansion of the liquid phase. As a result, the solid starts to crystallize and smaller particles are produced.5,67,85,86 To check the pressure, experiments were carried out at three pressure levels (10, 13 and 16 MPa). According to Fig. 4a and Table 4, the average particle diameter was smaller when the pressure increased due to the dominance of the nucleation mechanism. It is also clear that the average particle size decreases with increasing pressure. Similar results were obtained by Chen et al.,38 for the preparation of ginkgo medicinal substance, Domingo et al.87 for the production of ultrafine organic crystal particles, Park et al.88 for the production of nanoparticles of sulfa drugs, and Esfandiari et al.,5 for the production of fine pharmaceutical particles of ampicillin. All the mentioned researchers showed that smaller particles were obtained at higher pressures.
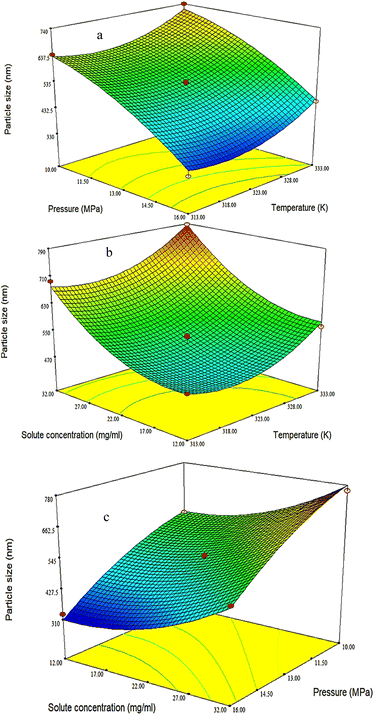 |
| | Fig. 4 3D surface plots indicating the influences of (a) temperature and pressure on particle size (fixed parameter is solute concentration = 22 mg ml−1), (b) solute concentration and temperature on particle size (fixed parameter is pressure = 13 MPa), and (c) solute concentration and pressure (fixed parameter is temperature = 323 K) on particle size. | |
3.2.2. The effect of temperature on the production of PAZ nanoparticles. Temperature affects the volumetric expansion of the solvent, which ultimately influences the shape and physical properties of the products. At lower temperatures (and constant other operational conditions), it is finer. The solubility of the solid substance in the solvent also increases with temperature enhancement at a constant pressure, which leads to crystallization at a lower temperature to increase the production rate of a higher quality product.33,39,89 In this project, the effect of temperature on the production of PAZ nanoparticles by the GAS method was addressed. While changing the temperature to three levels (313, 323 and 333 K), the particle size and particle size distribution were studied. The size distribution of particles and average particle size are shown in Fig. 4b and Table 4. As can be seen, temperature elevation in the precipitation process increased the average particle size of PAZ. The solubility of many medicinal substances in organic solvents is proportional to temperature. In many pharmaceuticals, solubility increases with increasing temperature and reduction of particle size by gas process is based on decreasing solubility. Therefore, the rate of supersaturation and nucleation can be controlled by temperature. Ion et al.90 and Wichianphong et al.51 reported similar results regarding the deposition of other substances (mefenamic acid–paracetamol).
3.2.3. The effect of initial solute concentration on the production of PAZ nanoparticles. The crystal size strongly depends on the initial concentration of the solid dissolved in the solvent (at the same pressure and temperature). At a higher initial concentration of the solid substance, the size of the crystals will be larger and their density will be higher.85,91 To investigate the effect of initial concentration of the solution on the particle size distribution of PAZ, the initial concentration of the solution was changed at three levels (12, 22 and 32 mg ml−1). Fig. 4c shows the variation of average particle size with solute concentration. As can be seen in Fig. 4c and Table 4, larger particles were formed by increasing the concentration of the solute. Nucleation occurs at a smaller volume ratio by raising the initial solute concentration. Therefore, the particles have more time to grow, leading to larger particles.92–95 Ardestani et al.6 for the preparation of phthalocyanine green particles, and Najafi et al.10 for the production of rosuvastatin calcium nanoparticles, reported similar results.
3.3. Investigating the characteristics of produced PAZ nanoparticles
3.3.1. SEM and DLS analysis results of PAZ particles. As seen in Fig. 5, the average size of the original PAZ drug particles was about 37.5 ± 8.7 μm and they had an irregular and polyhedral shape. To calculate the average particle size (37.5 ± 8.7 μm), the sizes of about 50 particles were randomly measured. Fig. 5 shows the SEM images of the original PAZ drug particles before the GAS process.
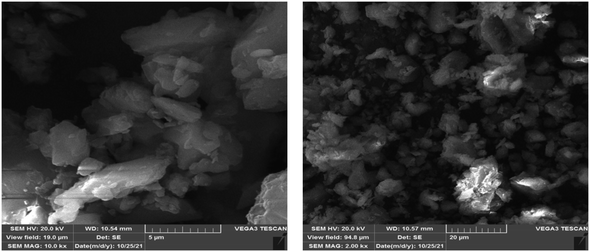 |
| | Fig. 5 SEM image of the original PAZ drug. | |
Fig. 6 depicts the structure and morphology of PAZ nanoparticles obtained (SEM analysis) under different conditions. Table 4 also lists the size distribution of precipitated particles (DLS analysis). The morphology of GAS-processed particles altered from irregular to spherical at higher pressures. With increasing pressure, the nucleation mechanism prevails, so smaller particles are observed. Fig. 6 shows the DLS diagrams (run 1, 2, 13, and 15), which are clearly consistent with the SEM results. Accordingly, the smallest particles were reached at the highest pressure (16 MPa). The particle sizes of PAZ nanoparticles ranged from 330 to 788 nm.
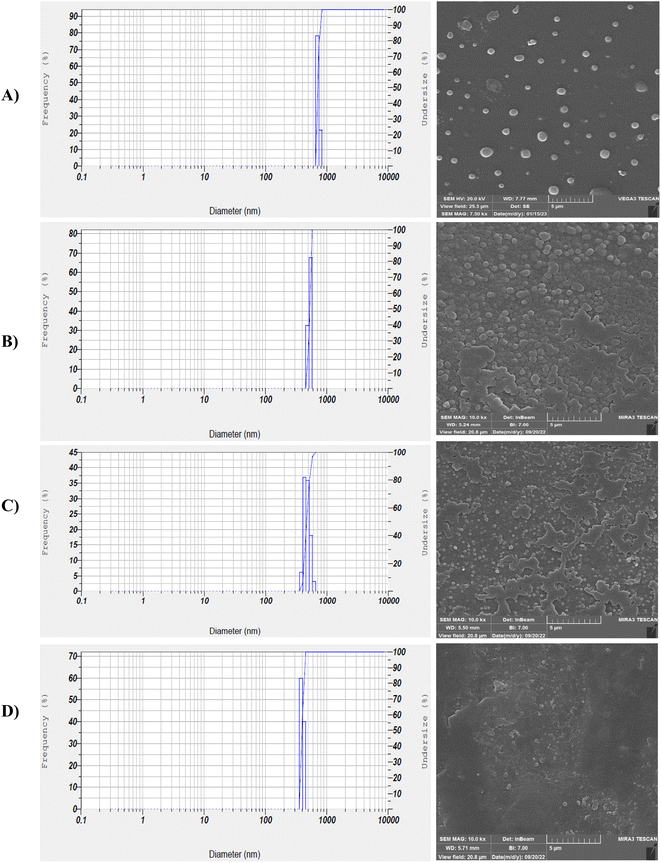 |
| | Fig. 6 SEM images and DLS results (according to Table 4): (A) run 2, (B) run 15, (C) run 1, (D) run 13 (optimum conditions). | |
3.3.2. FTIR analysis result of PAZ particles. This method can also identify organic compounds, because the spectra of these compounds are usually complex and have a number of maximum and minimum peaks that can be used for comparative purposes.96 The measured FTIR spectra, on KBr pellets, within the frequency range of 400–4000 cm−1 are shown in Fig. 7. Fig. 7A and B present the FTIR spectra of the un-processed and processed PAZ samples, respectively. The FTIR spectra exhibit various absorption bands, of which the primary ones are considered herein. As shown in Fig. 7, there is no significant difference in shape and position between the absorption peaks obtained for the two samples (before and after process). As can be seen, the structure of this material did not change during the process. Similar results were found by Ramana et al.,97 Herbrink et al.,98 and Nadaf et al..99 The main peaks were identified by FTIR analysis and are listed in Table 7.
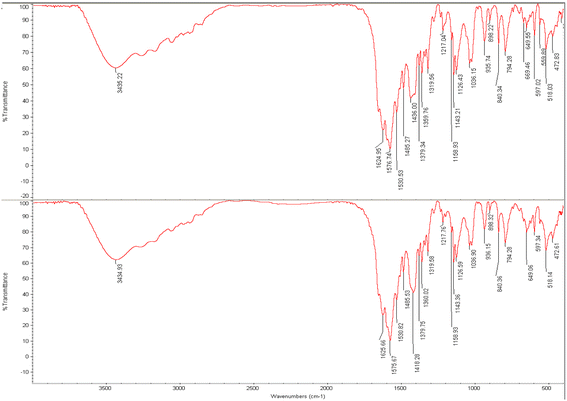 |
| | Fig. 7 FTIR analysis of (a) original PAZ (top) and (b) processed PAZ (at optimum conditions) (bottom). | |
Table 7 FTIR spectra for various bonds of PAZ
| Chemical functional bond |
Original PAZ |
Processed PAZ |
| Stretching bond –NH |
3435.22 |
3434.93 |
| Bending bond –CH |
1576.74 |
1575.67 |
| Bending bond –CH3 |
1485.27 |
1485.53 |
| Stretching bond –C–N |
1143.21 |
1143.36 |
| Stretching bond –S–N |
1036.15 |
1036.90 |
3.3.3. XRD analysis result of PAZ particles. XRD analysis was performed on the original PAZ particles and the sample obtained from the GAS process to compare their crystalline properties. Fig. 8 shows the XRD patterns of the original and the GAS-processed particles. The XRD patterns of the original and GAS-processed particles show that the structure of the particles remained intact. Therefore, the PAZ particles obtained from the GAS process maintained their crystalline structure. However, the intensity of the peaks related to the produced PAZ particles is smaller than that of the original PAZ particles, which can be assigned to two factors: the decrease in the crystallinity degree of the produced sample and the decline of the particle size. Similar results can be found in the articles of Kaduk et al.,100 and Herbrink et al.101
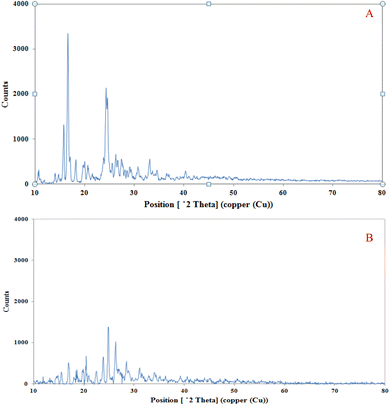 |
| | Fig. 8 XRD spectra of (A) original PAZ and (B) processed PAZ (optimum conditions). | |
3.3.4. DSC analysis result of PAZ particles. In Fig. 9A and B, the thermal behavior of original PAZ and PAZ nanoparticles produced by GAS method is shown. According to Fig. 9A, the melting point peak is at 291.4 °C, which corresponds to the results of Shen et al.102 Fig. 9B also indicates that PAZ nanoparticles (melting point peak at 172.9 °C) show a similar thermal behavior compared to the original PAZ particles. The decrease in the melting point could be due to the decrement in the degree of crystallinity of the nanoparticles and the decrease in the size of the particles, which confirms the results of XRD. Table 8 lists the melting points and enthalpies of original PAZ and PAZ nanoparticles. Based on the values of normal enthalpy change of original PAZ and PAZ particles, the crystalline degree of the nanoparticles is 59.3%. Similar results can be observed in Herbrink et al.98
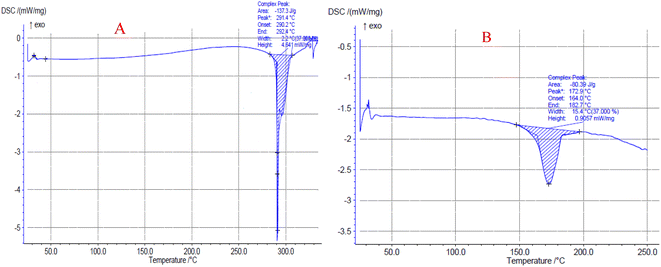 |
| | Fig. 9 DSC curves of (A) original PAZ and (B) processed PAZ (optimum conditions). | |
Table 8 Values of melting temperature and enthalpy change of original PAZ and PAZ nanoparticles
| Item |
Enthalpy change ΔH (J g−1) |
Onset (°C) |
Peak (°C) |
End set (°C) |
| Original PAZ |
137.3 |
290.2 |
291.4 |
292.4 |
| PAZ nanoparticle |
80.39 |
164.0 |
172.9 |
182.7 |
3.3.5. Optimum conditions. The optimum values of the process parameters were determined to obtain the smallest particle size using the BBD method implemented in the Design Expert software. These values were determined to be a temperature of 320 K, a pressure of 16 MPa, and a solute concentration of 12.6 mg ml−1. These values were predicted to yield particles of 302.3 nm in size. The BBD method was used to evaluate the accuracy and validity of the optimization method through experiments, and the average particle size was found to be 311.1 nm, which was very close to the predicted value.
4 Conclusion
The production of PAZ nanoparticles with a GAS process at different operational conditions has been rarely addressed. Thus, this article addresses the comprehensive identification of changes in the physical and chemical properties of PAZ under GAS process. Examining the results of PAZ micronization by GAS process in the current research shows that the size of the drug particles decreased from 37.5 ± 8.7 μm to 330–788 nm. Operating parameters (among the various parameters) for the production of PAZ nanoparticles are pressure (10, 13 and 16 MPa), temperature (313, 323 and 333 K) and solute concentration in the initial solution (12, 22 and 32 mg ml−1). Based on the Box–Behnken experimental design (BBD), the smallest pazopanib hydrochloride particles were produced at 320 K, 16 MPa and a solution concentration of 12.6 mg ml−1. Examination of the chemical structure of nanoparticles by FTIR showed that the structure of this material did not change during the process. The XRD patterns of the original and GAS-processed particles showed that the structure of the particles remained intact. Examination of the thermal behavior of the nanoparticles reveals a decline in the melting point of nanoparticles by 118.5 °C compared to that of the original drug. Furthermore, the degree of crystallinity of the nanoparticles decreased.
Nomenclature
| P | Pressure |
| T | Temperature |
| SC | Solute concentration |
| H | Enthalpy |
| X1, X2, X3 | Parameters of BBD design |
Greek letters
Abbreviations
| ANOVA | Analysis of variance |
| BBD | Box–Behnken design |
| BCS | Biopharmaceutical classification system |
| CCD | Central composite design |
| DMSO | Dimethyl sulfoxide |
| DCM | Dichloromethane |
| DLS | Dynamic light scattering |
| DSC | Differential scanning calorimetry |
| DOE | Design of experiments |
| df | Differential |
| FTIR | Fourier transform infrared |
| GAS | Gas anti solvent |
| PAZ | Pazopanib hydrochloride |
| RSM | Response surface method |
| XRD | X-ray diffraction |
| Std dev. | Standard division |
| SEM | Scanning electron microscope |
| SC-CO2 | Supercritical carbon dioxide |
| SCF | Supercritical fluid |
Data availability
The authors confirm that the data supporting the findings of this study are available within the article.
Author contributions
M. B.: writing original draft, investigation, software, formal analysis, data curation. B. H.: methodology, supervision, conceptualization, review and editing. N. E.: investigation, validation, methodology, conceptualization, and review and editing. S. A. S.: investigation, conceptualization, project administration, and review and editing. Z. A. A.: methodology, validation, and investigation.
Conflicts of interest
The authors declare that they have no known competing financial interests or personal relationships that could have appeared to influence the work reported in this paper.
Acknowledgements
Authors would like to thank the generous financial support provided by the Research Deputy of Islamic Azad University of Marvdasht.
References
- V. Shanmugarajeshwari and M. Ilayaraja, Int. J. Intell. Inf. Technol., 2024, 20, 1–22 CrossRef.
- G. Sodeifian, R. S. Alwi, F. Razmimanesh and A. Roshanghias, J. Supercrit. Fluids, 2022, 190, 105759 CrossRef CAS.
- K. D. LaPlant and P. D. Louzon, Ann. Pharmacother., 2010, 44, 1054–1060 CrossRef CAS PubMed.
- P. R. Sankar, K. S. Latha, A. B. Sailu, S. Taheera and B. Madhuri, Res. J. Pharm. Technol., 2021, 14, 1549–1554 CrossRef.
- N. Esfandiari and S. M. Ghoreishi, AAPS PharmSciTech, 2015, 16, 1263–1269 CrossRef CAS PubMed.
- N. S. Ardestani, G. Sodeifian and S. A. Sajadian, Heliyon, 2020, 6, e04947 CrossRef PubMed.
- N. Esfandiari and S. A. Sajadian, Arabian J. Chem., 2022, 104164 CrossRef CAS.
- M. Askarizadeh, N. Esfandiari, B. Honarvar, S. A. Sajadian and A. Azdarpour, ChemBioEng Rev., 2023, 10, 1006–1049 CrossRef CAS.
- M. Bazaei, B. Honarvar, N. Esfandiari, S. A. Sajadian and Z. Arab Aboosadi, Sci. Rep., 2024, 14, 14955 CrossRef CAS PubMed.
- M. Najafi, N. Esfandiari, B. Honarvar and Z. A. Aboosadi, Period. Polytech., Chem. Eng., 2021, 65, 442–453 CrossRef CAS.
- S. A. Sajadian, N. Esfandiari, M. Najafi and M. R. Derisi, Chem. Thermodyn. Therm. Anal., 2022, 8, 100094 CrossRef.
- A. Rojas, S. A. Sajadian, F. Razmimanesh, G. Aguila, N. Esfandiari and A. Jouyban, Fluid Phase Equilib., 2024, 114165 CrossRef CAS.
- S. A. Sajadian, N. Esfandiari, N. Saadati Ardestani, M. Amani and L. A. Estévez, Chem. Eng. Technol., 2024, 47, 811–821 CrossRef CAS.
- M. Askarizadeh, N. Esfandiari, B. Honarvar, S. A. Sajadian and A. Azdarpour, Arabian J. Chem., 2024, 17, 105707 CrossRef CAS.
- M. Bazaei, B. Honarvar, N. Esfandiari, S. A. Sajadian and Z. A. Aboosadi, Fluid Phase Equilib., 2023, 573, 113877 CrossRef CAS.
- N. Esfandiari, N. Saadati Ardestani, R. S. Alwi, A. Rojas, C. Garlapati and S. A. Sajadian, Sci. Rep., 2023, 13, 17089 CrossRef CAS PubMed.
- S. A. Sajadian, N. Esfandiari and L. Padrela, J. CO2 Util., 2024, 84, 102832 CrossRef CAS.
- N. Esfandiari and S. Ali Sajadian, J. Mol. Liq., 2022, 360, 119467 CrossRef CAS.
- N. S. Ardestani, S. A. Sajadian, N. Esfandiari, A. Rojas and C. Garlapati, Sci. Rep., 2023, 13, 17506 CrossRef CAS PubMed.
- A. Shirafkan, S. M. Nowee and H. Kamali, J. Supercrit. Fluids, 2021, 178, 105386 CrossRef CAS.
- M. Najafi, N. Esfandiari, B. Honarvar and Z. Arab Aboosadi, J. Chem. Pet. Eng., 2020, 54, 297–309 CAS.
- N. Esfandiari, J. Supercrit. Fluids, 2015, 100, 129–141 CrossRef CAS.
- S. D. Yeo, G. B. Lim, P. G. Debendetti and H. Bernstein, Biotechnol. Bioeng., 1993, 41, 341–346 CrossRef CAS PubMed.
- H. Loth and E. Hemgesberg, Int. J. Pharm., 1986, 32, 265–267 CrossRef CAS.
- F. Razmimanesh, G. Sodeifian and S. A. Sajadian, J. Supercrit. Fluids, 2021, 170, 105163 CrossRef CAS.
- N. S. Ardestani, M. Amani and S. A. Sajadian, J. Appl. Res. Med. Aromat. Plants, 2023, 35, 100468 Search PubMed.
- A. Rojas, S. A. Sajadian, C. López-de-Dicastillo, N. S. Ardestani, G. Aguila and A. Jouyban, RSC Adv., 2023, 13, 34210–34223 RSC.
- N. Esfandiari and S. M. Ghoreishi, Chem. Eng. Technol., 2014, 37, 73–80 CrossRef CAS.
- M. Rahmanzadeh Derisi and N. Esfandiari, Iran. J. Chem. Eng., 2020, 17, 37–46 CrossRef.
- G. Muhrer and M. Mazzotti, Biotechnol. Prog., 2003, 19, 549–556 CrossRef CAS PubMed.
- I. Akbari, S. Ghoreishi and N. Habibi, J. Supercrit. Fluids, 2014, 94, 182–188 CrossRef CAS.
- A. S. Pessoa, G. P. S. Aguiar, J. V. Oliveira, A. J. Bortoluzzi, A. Paulino and M. Lanza, J. Supercrit. Fluids, 2019, 145, 93–102 CrossRef CAS.
- N. Esfandiari and S. M. Ghoreishi, J. Supercrit. Fluids, 2013, 84, 205–210 CrossRef CAS.
- M. Cocero and S. Ferrero, J. Supercrit. Fluids, 2002, 22, 237–245 CrossRef CAS.
- Z. Liu, J. Wang, L. Song, G. Yang and B. Han, J. Supercrit. Fluids, 2002, 24, 1–6 CrossRef.
- F. Fusaro, M. Mazzotti and G. Muhrer, Cryst. Growth Des., 2004, 4, 881–889 CrossRef CAS.
- Y. Bakhbakhi, S. Rohani and P. A. Charpentier, Ind. Eng. Chem. Res., 2005, 44, 7337–7344 CrossRef CAS.
- K. Chen, X. Zhang, J. Pan, W. Zhang and W. Yin, Powder Technol., 2005, 152, 127–132 CrossRef CAS.
- Y. Bakhbakhi, P. A. Charpentier and S. Rohani, Int. J. Pharm., 2006, 309, 71–80 CrossRef CAS PubMed.
- S.-J. Park and S.-D. Yeo, J. Supercrit. Fluids, 2008, 47, 85–92 CrossRef CAS.
- M. Moneghini, I. Kikic, D. Voinovich, B. Perissutti and J. Filipović-Grčić, Int. J. Pharm., 2001, 222, 129–138 CrossRef CAS PubMed.
- C. Roy, D. Vrel, A. Vega-González, P. Jestin, S. Laugier and P. Subra-Paternault, J. Supercrit. Fluids, 2011, 57, 267–277 CrossRef CAS.
- S. Phothipanyakun, S. Suttikornchai and M. Charoenchaitrakool, Powder Technol., 2013, 250, 84–90 CrossRef CAS.
- G. Sodeifian, S. A. Sajadian and R. Derakhsheshpour, J. CO2 Util., 2022, 55, 101799 CrossRef CAS.
- Y. Li, Y. Yu, H. Wang and F. Zhao, Asian J. Pharm. Sci., 2016, 11, 281–291 CrossRef.
- B. Long, V. Verma, K. M. Ryan and L. Padrela, J. Supercrit. Fluids, 2021, 170, 105134 CrossRef CAS.
- G. S. Sakata, M. M. Ribas, C. Dal Magro, A. E. Santos, G. P. Aguiar, J. V. Oliveira and M. Lanza, J. Supercrit. Fluids, 2021, 171, 105164 CrossRef CAS.
- Z. Ulker and C. Erkey, J. Supercrit. Fluids, 2017, 120, 310–319 CrossRef CAS.
- A. Erriguible, C. Neurohr, A.-L. Revelli, S. Laugier, G. Fevotte and P. Subra-Paternault, J. Supercrit. Fluids, 2015, 98, 194–203 CrossRef CAS.
- P. Dittanet, S. Phothipanyakun and M. Charoenchaitrakool, J. Taiwan Inst. Chem. Eng., 2016, 63, 17–24 CrossRef CAS.
- N. Wichianphong and M. Charoenchaitrakool, J. CO2 Util., 2018, 26, 212–220 CrossRef CAS.
- G. Shashidhar, G. Pravin and B. Manohar, RSC Adv., 2016, 6, 57739–57750 RSC.
- S. V. de Melo, L. Danh, R. Mammucari and N. Foster, J. Supercrit. Fluids, 2014, 93, 112–120 CrossRef CAS.
- G. Kotbantao and M. Charoenchaitrakool, J. CO2 Util., 2017, 17, 213–219 CrossRef CAS.
- C. A. Ober, S. E. Montgomery and R. B. Gupta, Powder Technol., 2013, 236, 122–131 CrossRef CAS.
- L. Lőrincz, G. Bánsághi, M. Zsemberi, S. de Simón Brezmes, I. M. Szilágyi, J. Madarász, T. Sohajda and E. Székely, J. Supercrit. Fluids, 2016, 118, 48–53 CrossRef.
- D. Arora, R. Sedev, C. C. Beh, C. Priest and N. R. Foster, Ind. Eng. Chem. Res., 2020, 59, 11905–11913 CrossRef CAS.
- A. Tandya, H. Zhuang, R. Mammucari and N. Foster, J. Supercrit. Fluids, 2016, 107, 9–16 CrossRef CAS.
- S. Harikrishnan, R. Sedev, C. C. Beh, C. Priest and N. R. Foster, J. Supercrit. Fluids, 2020, 159, 104756 CrossRef CAS.
- M. Najafi, N. Esfandiari, B. Honarvar and Z. A. Aboosadi, Period. Polytech., Chem. Eng., 2021, 65, 455–466 Search PubMed.
- F. Kurniawansyah, R. Mammucari and N. R. Foster, Powder Technol., 2017, 305, 748–756 CrossRef CAS.
- B. Warwick, F. Dehghani, N. R. Foster, J. R. Biffin and H. L. Regtop, Ind. Eng. Chem. Res., 2002, 41, 1993–2004 CrossRef CAS.
- I. Martausová, T. Sosna and D. Plachá, Modification of the morphology of caffeine and cimetidine using supercritical CO2, presented in the 20th International Electronic Conference on Synthetic Organic Chemistry, November, 2016 Search PubMed.
- A. Shikhar, M. M. Bommana, S. S. Gupta and E. Squillante, J. Supercrit. Fluids, 2011, 55, 1070–1078 CrossRef CAS.
- L. Padrela, J. Zeglinski and K. M. Ryan, Cryst. Growth Des., 2017, 17, 4544–4553 CrossRef CAS.
- M. Amani, N. S. Ardestani and N. Y. Majd, J. CO2 Util., 2021, 46, 101465 CrossRef CAS.
- D. Jafari, I. Yarnezhad, S. M. Nowee and S. H. N. Baghban, Ind. Eng. Chem. Res., 2015, 54, 3685–3696 CrossRef CAS.
- N. R. Foster, A. S. Ng, F. Dehghani and H. L. Regtop, 2003.
- O. I. Corrigan and A. M. Crean, Int. J. Pharm., 2002, 245, 75–82 CrossRef CAS PubMed.
- A. Bertucco and P. Pallado, Understanding gas antisolvent processes of biocompatible polymers and drugs with supercritical CO2, Proceedings of the International Meeting of the GVC, High Pressure Chemical Engineering, Karlsruhe, Germany, March 3–5, 1999 Search PubMed.
- R. Thiering, F. Dehghani, A. Dillow and N. R. Foster, J. Chem. Technol. Biotechnol., 2000, 75, 29–41 CrossRef CAS.
- J. Tschernjaew, T. Berger, A. Weber and R. Kümmel, Chem. Ing. Tech., 1997, 69, 670–674 CrossRef CAS.
- C. N. Field, P. A. Hamley, J. M. Webster, D. H. Gregory, J. J. Titman and M. Poliakoff, J. Am. Chem. Soc., 2000, 122, 2480–2488 CrossRef CAS.
- M. Kitamura, M. Yamamoto, Y. Yoshinaga and H. Masuoka, J. Cryst. Growth, 1997, 178, 378–386 CrossRef CAS.
- S. D. Yeo, P. G. Debenedetti, M. Radosz and H. W. Schmidt, Macromolecules, 1993, 26, 6207–6210 CrossRef CAS.
- S.-D. Yeo, J.-H. Choi and T.-J. Lee, J. Supercrit. Fluids, 2000, 16, 235–246 CrossRef CAS.
- P. Gallagher, V. Krukonis and G. Botsaris, Particle Design via Crystallization, 1991, vol. 284, pp. 96–103 Search PubMed.
- E. M. Berends, O. S. Bruinsma, J. De Graauw and G. M. van Rosmalen, AIChE J., 1996, 42, 431–439 CrossRef CAS.
- S. N. Politis, P. Colombo, G. Colombo and D. M. Rekkas, Drug Dev. Ind. Pharm., 2017, 43, 889–901 CrossRef CAS PubMed.
- G. E. Box and N. R. Draper, Response Surfaces, Mixtures, and Ridge Analyses, John Wiley & Sons, 2007 Search PubMed.
- A. Witek-Krowiak, K. Chojnacka, D. Podstawczyk, A. Dawiec and K. Bubała, Bioresour. Technol., 2014, 160, 150–160 CrossRef CAS PubMed.
- D. C. Montgomery, IIE Transactions, 1992, 24, 4–17 CrossRef.
- G. Sodeifian, N. S. Ardestani, S. A. Sajadian and K. Moghadamian, J. Supercrit. Fluids, 2018, 135, 34–44 CrossRef CAS.
- G. Sodeifian, S. A. Sajadian and N. S. Ardestani, J. Supercrit. Fluids, 2017, 119, 139–149 CAS.
- M. Müller, U. Meier, A. Kessler and M. Mazzotti, Ind. Eng. Chem. Res., 2000, 39, 2260–2268 CrossRef.
- L. Hua, Phys. Chem. Liq., 2009, 47, 296–301 CrossRef CAS.
- C. Domingo, E. Berends and G. M. van Rosmalen, J. Supercrit. Fluids, 1997, 10, 39–55 CrossRef CAS.
- S. J. Park and S. D. Yeo, Sep. Sci. Technol., 2007, 42, 2645–2660 CrossRef CAS.
- D. Amaro-González, G. Mabe, M. Zabaloy and E. A. Brignole, J. Supercrit. Fluids, 2000, 17, 249–258 CrossRef.
- R. Ion, M. Ion, V. Niculescu, I. Dumitriu, R. Fierascu, G. Florea, C. Bercu, S. Serban and J. Rom, Phys, 2008, 53, 781–791 CAS.
- J. De la Fuente Badilla, C. Peters and J. de Swaan Arons, J. Supercrit. Fluids, 2000, 17, 13–23 CrossRef CAS.
- G. Sodeifian, S. A. Sajadian and N. S. Ardestani, J. Taiwan Inst. Chem. Eng., 2016, 60, 165–173 CrossRef CAS.
- G. Sodeifian, S. A. Sajadian and S. Daneshyan, J. Supercrit. Fluids, 2018, 140, 72–84 CrossRef CAS.
- M. Amani, N. S. Saadati Ardestani and S. A. Sajadian, Color. Technol., 2023, 139(6), 703–718 CAS.
- C. J. Chang and A. D. Randolph, AIChE J., 1990, 36, 939–942 CrossRef CAS.
- A. Tsagkaris, K. Bechynska, D. Ntakoulas, I. Pasias, P. Weller, C. Proestos and J. Hajslova, J. Food Compos. Anal., 2023, 119, 105276 CrossRef CAS.
- P. V. Ramana, Y. R. Krishna and K. C. Mouli, J. Mol. Struct., 2022, 1263, 133051 CrossRef CAS.
- M. Herbrink, S. L. Groenland, A. D. Huitema, J. H. Schellens, J. H. Beijnen, N. Steeghs and B. Nuijen, Int. J. Pharm., 2018, 544, 181–190 CrossRef CAS PubMed.
- S. J. Nadaf, S. G. Killedar, V. M. Kumbar, D. A. Bhagwat and S. S. Gurav, Int. J. Pharm., 2022, 628, 122287 CrossRef CAS PubMed.
- J. A. Kaduk, A. M. Gindhart and T. N. Blanton, Powder Diffr., 2021, 36, 205–207 CrossRef CAS.
- M. Herbrink, J. Schellens, J. Beijnen and B. Nuijen, J. Therm. Anal. Calorim., 2017, 130, 1491–1499 CrossRef CAS.
- D. Shen, T. Jin, Y. Xiao, X. Zhu and Y. Hua, Eur. J. Pharm. Sci., 2023, 188, 106530 CrossRef CAS PubMed.
|
| This journal is © The Royal Society of Chemistry 2024 |
Click here to see how this site uses Cookies. View our privacy policy here.  Open Access Article
 *ab and
Zahra Arab Aboosadia


