 Open Access Article
Efficient photoreduction of CO2 to CO by Co-ZIL-L derived NiCo–OH with ultrathin nanosheet assembled 2D leaf superstructure†
Yang Zhanga,
Wenfeng Zhonga,
Linhai Duanb,
Jiaping Zhu a and
Hua Tan
 *a
*a
aCollege of Chemistry, Guangdong University of Petrochemical Technology, Maoming 525000, China. E-mail: huatan@gdupt.edu.cn
bCollege of Chemical Engineering, Guangdong University of Petrochemical Technology, Maoming 525000, China
First published on 21st November 2024
Abstract
The photocatalytic reduction of CO2 into valuable chemicals and fuels is considered a promising solution to address the energy crisis and environmental challenges. In this work, we introduce a Co-ZIL-L mediated in situ etching and integration process to prepare NiCo–OH with an ultrathin nanosheet-assembled 2D leaf-like superstructure (NiCo–OH UNLS). The resulting catalyst demonstrates excellent photocatalytic performance for CO2 reduction, achieving a CO evolution rate as high as 309.5 mmol g−1 h−1 with a selectivity of 91.0%. Systematic studies reveal that the ultrathin nanosheet structure and 2D leaf-like architecture not only enhance the transfer efficiency of photoexcited electrons but also improve the accessibility of active reaction sites. Additionally, the Ni–Co dual sites in NiCo–OH UNLS accelerate CO2 conversion kinetics by stabilizing the *COOH intermediate, significantly contributing to its high activity. This work offers valuable insights for designing advanced photocatalysts for CO2 conversion.
Introduction
The constant increase in greenhouse gases, particularly CO2, due to the consumption of fossil fuels, has elevated widespread public concern.1,2 Photocatalytic reduction of CO2 to value-added carbon chemicals has been regarded as a promising pathway to alleviate the energy and pollution problems simultaneously.3 However, the linear symmetrical structure and chemically inert C![[double bond, length as m-dash]](https://www.rsc.org/images/entities/char_e001.gif) O bond of CO2 (with a dissociation energy of approximately 750 kJ mol−1) make its photocatalytic reduction sluggish.4 Furthermore, the long-distance migration of photoinduced carriers, coupled with severe recombination, leads to kinetic limitations in the photoreduction process.5 Thus, it is crucial to develop efficient photocatalysts for CO2 reduction.
O bond of CO2 (with a dissociation energy of approximately 750 kJ mol−1) make its photocatalytic reduction sluggish.4 Furthermore, the long-distance migration of photoinduced carriers, coupled with severe recombination, leads to kinetic limitations in the photoreduction process.5 Thus, it is crucial to develop efficient photocatalysts for CO2 reduction.
The performance of photocatalytic CO2 reduction largely depends on the reactive sites' ability to effectively adsorb and activate CO2 molecules.6 Recent studies have identified Co(OH)2 as a promising photocatalyst for CO2 reduction due to the strong interaction between the d-orbitals of cobalt and CO2 molecules.7,8 However, single-component Co(OH)2 exhibits low activity and selectivity for CO2 photoconversion, primarily due to its inherent homogeneity. To overcome this issue, introducing heterogeneous components into the catalyst has emerged as a promising strategy for improving photocatalytic performance. For example, decorating Co(OH)2 with noble metal nanoclusters can facilitate charge redistribution, lowering the energy barriers for CO2 reduction.9 Additionally, previous studies have demonstrated that doping transition metals (e.g., Ni, Cu) into the catalyst can optimize the electronic structure and regulate the adsorption and desorption behaviors of intermediates during the photocatalytic CO2 reduction process.10,11
To achieve significant CO2 conversion activity, it is essential to design unique nanostructures with abundant active sites and unimpeded photocarrier migration channels. Two-dimensional (2D) materials, such as nanosheets, have shorter photocarrier migration distances, which help reduce carrier recombination.12–15 Moreover, 2D materials have high specific surface areas per unit volume, maximizing the accessibility of active sites. However, these 2D structures tend to agglomerate during catalytic reactions due to strong intermolecular interactions. As an alternative, assembling 2D nanosheets into self-supporting superstructures can result in advanced photocatalysts with both high activity and long-term stability.
Herein, we present a Co-ZIL-L mediated in situ etching and integration strategy to prepare NiCo–OH with an ultrathin nanosheet-assembled 2D leaf-like superstructure (NiCo–OH UNLS). Notably, this bimetallic hydroxide catalyst delivers an impressive CO yield of 309.5 mmol g−1 h−1 and maintains nearly 100% of its photocatalytic performance even after four catalytic cycles. The 2D morphology enhances the separation of photocarriers, while the complex multi-level self-assembled nanostructure derived from the unique 2D lamellar structure of the Co-ZIL-L precursor significantly increases the exposure and accessibility of reactive sites. This structural advantage leads to highly efficient CO2 photoreduction. This work provides valuable insights for designing efficient photocatalysts for CO2 reduction.
Experimental
Synthesis of catalysts
Catalyst characterization
The crystal structures of the catalysts were analyzed using a powder X-ray diffractometer (XRD, Bruker D8 ADVANCR). The morphological features were examined with scanning electron microscopy (SEM, HITACHI SU8220) and transmission electron microscopy (TEM, JEOL JEM 2100F). Nitrogen sorption isotherms were obtained using a Micromeritics ASAP 2020M. The surface chemical states of the catalysts were investigated through X-ray photoelectron spectroscopy (XPS, F-7000, Thermo Scientific Escalab 250Xi system). Thermogravimetric analysis (TGA, NETZSCH TG209F1) was performed under Ar atmosphere. Ultraviolet-visible diffuse reflectance spectra (UV-vis DRS) were recorded with a U-3010 Spectrophotometer (HITACHI, Japan), using a BaSO4 plate as a reference. The dynamic behavior of photocarriers was analyzed through photoluminescence (PL, HITACHI, Japan) spectra. Fourier-transform infrared (FTIR) spectra and in situ FTIR measurements were conducted using a Thermo Fisher iS50.Photocatalytic CO2 reduction
The photocatalytic CO2 reduction was performed in a 50 mL home-made quartz reactor by using a 36 W 450 nm monochromatic LED lamp as the light resource (1340 W m−2). Typically, a certain amount of catalysts, 20 mg of [Ru(bpy)3]Cl2·6H2O (abbreviated as Ru, where bpy = 2,2-bipyridine), 2 mL of triethanolamine (TEOA), 2.5 mL of H2O, and 6.5 mL of acetonitrile, were added into the reactor and stirred at a speed of 300 rpm. High purity CO2 was then introduced into the reactor after multiple vacuum cycles to remove any residual air. After the photocatalytic reaction, the gas products were quantified by a gas chromatograph (GC 7920, Beijing China Education Au-light Co., Ltd) equipped with a flame ionization detector (FID), a thermal conductivity detector (TCD) and a methane reformer. TDX-01 packed column was used for the separation of H2, CO, and the mixture of N2 and O2. Ar was used as the carrier gas. The electric current for TCD detector was set at 80 mA. The temperatures for TCD detector, FID detector, column oven and methane reformer were set at 80, 200, 70, and 360 °C. External standard method was conducted to determine the yields of H2 and CO.Computational details for calculations
All calculations were performed within the framework of density functional theory (DFT) using the projector augmented wave method, as implemented in the Vienna Ab initio Simulation Package (VASP).17,18 The generalized gradient approximation proposed by Perdew–Burke–Ernzerhof (PBE) was used for the exchange–correlation potential.19,20 The cutoff energy for the plane wave was set at 480 eV, and the energy criterion for the iterative solution of the Kohn–Sham equations was established at 10−4 eV. To minimize interlayer interactions, a vacuum spacing of 20 Å was applied perpendicular to the slab. Brillouin zone integration was conducted using a 3 × 3 × 1 k-mesh. All structures were relaxed until the residual forces on the atoms were reduced to less than 0.05 eV Å−1. Data analysis and visualization were performed using VASPKIT code and VESTA.21,22Results and discussion
Catalyst characterization
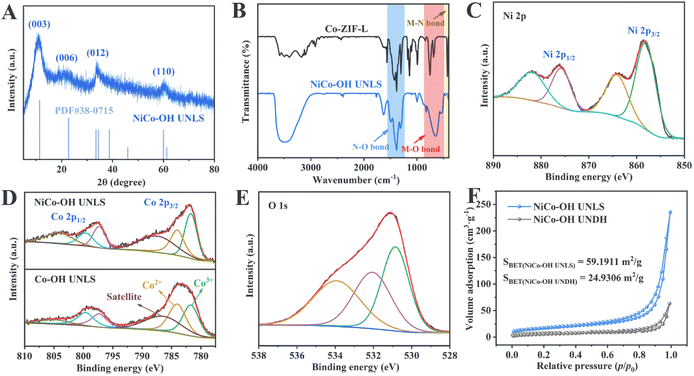
As illustrated in Scheme 1, NiCo–OH with an ultrathin nanosheet-assembled 2D leaf superstructure (NiCo–OH UNLS) was synthesized through a ZIL-L-mediated in situ etching and integration process. In the initial step, leaf-like Co-ZIL-L was formed by mixing aqueous solutions of Co(NO3)2 and 2-MeIm. This was followed by an in situ phase transformation in an ethanol solution of Ni(NO3)2, leading to the formation of NiCo–OH UNLS.To analyze the morphological evolution, scanning electron microscopy (SEM) and transmission electron microscopy (TEM) were employed. As depicted in Fig. 1(A and B), Co-ZIL-L exhibits a leaf-like morphology, measuring approximately 10 μm in length and 2 μm in width. A TEM image further confirms the solid nature of Co-ZIF-L (Fig. 1(C)). Additionally, energy-dispersive X-ray spectroscopy (EDS) elemental mapping reveals that Co, C, and N are uniformly distributed across the leaf-like framework of Co-ZIF-L (Fig. 1(D)). X-ray diffraction (XRD) was performed to investigate the crystal structure of Co-ZIF-L. As shown in Fig. S1,† sharp characteristic diffraction peaks corresponding to the pure ZIF-L phase are evident in the XRD pattern of Co-ZIF-L, confirming its successful synthesis.23 Following the etching and integration process, these characteristic peaks disappear, and four new diffraction peaks located at 10.7°, 21.7°, and 33.8° and 59.8°, emerge in the XRD pattern of NiCo–OH UNLS, which are assigned to the (003), (006), (012) and (110) crystallographic planes of hexagonal nickelous hydroxide (JCPDS #38-0715), respectively (Fig. 2(A)).24 This result demonstrates the formation of Ni–Co bimetallic hydroxide. Notably, the XRD characteristic peaks of the NiCo–OH UNLS exhibit broad and weak features, reflecting the low crystallinity of the formatting ultra-thin Co–Ni bimetallic hydroxide nanosheet structure. Such a low crystallinity is also confirmed by the selected-area electron diffraction (SAED) pattern (Fig. S2†). The above findings clearly demonstrate the complete phase transformation from MOF to hydroxide.
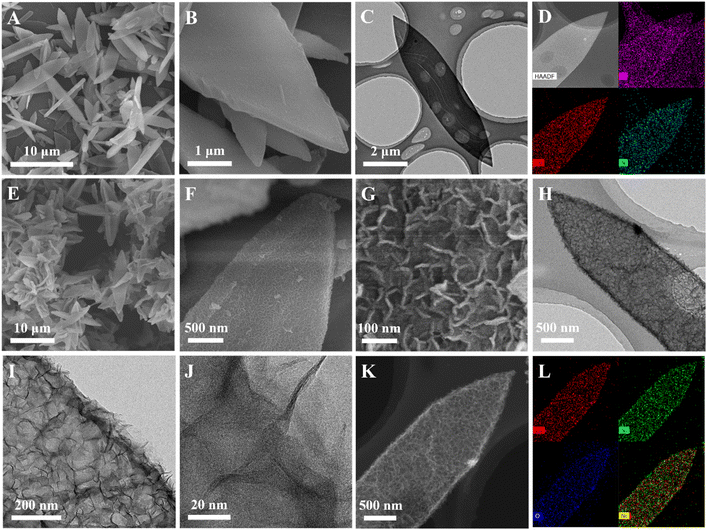 | ||
| Fig. 1 (A and B) SEM, (C) TEM, (D) HAADF-STEM and EDX elemental mapping images of Co-ZIF-L; (E–G) SEM, (H and I) TEM, (J) HRTEM, (K) HAADF-STEM and (L) EDX elemental mapping images of NiCo–OH UNLS. | ||
SEM images show that NiCo–OH UNLS retains the 2D leaf-like morphology of its precursor, Co-ZIL-L, but with a much rougher surface (Fig. 1(E and F)). A closer look through magnified SEM and TEM images reveals the hierarchical surface of the NiCo–OH UNLS, which is composed of 2D nanosheet subunits (Fig. 1(G–I)). Interestingly, a distinct hollow structure is also observed in the NiCo–OH UNLS. High-resolution transmission electron microscopy (HRTEM) indicates that the nanosheets are incredibly thin, with a thickness of approximately 2 nm (Fig. 1(J)). Furthermore, high-angle annular dark-field scanning transmission electron microscopy (HAADF-STEM) and elemental mapping confirm that Ni, Co, and O elements are uniformly distributed across the entire NiCo–OH UNLS (Fig. 1(K and L)). The ratio of Ni/Co is further determined to be 1.07![[thin space (1/6-em)]](https://www.rsc.org/images/entities/char_2009.gif) :
:![[thin space (1/6-em)]](https://www.rsc.org/images/entities/char_2009.gif) 1 according to the inductive coupled plasma emission mass spectrometry (ICP-MS) test (Table S1†).
1 according to the inductive coupled plasma emission mass spectrometry (ICP-MS) test (Table S1†).
Fourier transform infrared spectroscopy (FT-IR) was used to study the structural evolution from ZIL-L to NiCo–OH UNLS. As shown in Fig. 2(B), the FT-IR spectrum of Co-ZIL-L displays characteristic peaks corresponding to the bending vibrations of the imidazole ring and the Co–N bond.25 These bending vibrations disappear after the phase transformation, indicating the breaking of the Co–N bond and the removal of the 2-methylimidazole ligand. Besides, the characteristic peak located at 1384 cm−1 corresponds to the stretching vibration of the N–O bond in NO32−, which verifying the intercalation of anion.26 Additionally, the FT-IR spectrum of NiCo–OH UNLS shows a characteristic peak in the range of 450–600 cm−1, which can be attributed to the stretching vibrations of metal–O bonds (specifically, Co–O and Ni–O).24 The peak at 3500 cm−1 corresponds to the stretching vibrations of O–H bonds, confirming the successful phase transition from MOF to bimetallic hydroxide.
The formation of NiCo–OH UNLS can be explained by the following mechanism: during the phase transformation, the leaf-like Co-ZIL-L is gradually etched by protons generated from the hydrolysis of Ni2+. The released Co species then combine in situ with Ni2+, resulting in the formation of Ni–Co bimetallic hydroxide with an ultrathin nanosheet-assembled 2D leaf superstructure. For comparison, Co–OH UNLS was also synthesized. The XRD pattern confirms the successful fabrication of Co–OH UNLS (Fig. S3†). Furthermore, SEM, TEM, HAADF, and EDX elemental mapping images show that Co–OH UNLS exhibits a similar nanosheet-assembled 2D leaf superstructure to that of NiCo–OH UNLS (Fig. S4†).
The chemical state of Co species in NiCo–OH UNLS was further identified by X-ray photoelectron spectroscopy (XPS). As illustrated in Fig. S5,† sharp characteristic peaks corresponding to Ni, Co, N, and O are observed in the survey spectrum. The high-resolution spectrum of Ni 2p reveals two spin–orbit double peaks at 875.9 eV and 858.2 eV, which correspond to Ni 2p1/2 and Ni 2p3/2 of Ni2+, respectively (Fig. 2(C)). In the high-resolution spectrum of Co 2p, two peaks at 784.1 eV and 799.7 eV are assigned to Co 2p3/2 and Co 2p1/2 orbitals for Co2+ species, respectively (Fig. 2(D)). Additionally, two other peaks at 781.7 eV and 797.3 eV are attributed to Co3+ species. Notably, the content of Co3+ species in NiCo–OH UNLS is higher than in Co–OH UNLS, suggesting that Co2+ is more prone to oxidation to Co3+ in the presence of nickel species. The high-resolution O 1s spectrum can be deconvoluted into three peaks at 533.9 eV, 532.1 eV, and 530.8 eV, corresponding to adsorbed oxygen, hydroxyl ions, and metal–oxygen bonds (Co–O and Ni–O), respectively (Fig. 2(E)).26 The peak located at 406.7 eV could be attributed to NO32−, which is consistent with the FT-IR results (Fig. S6†).27
Thermogravimetric analysis (TGA) was conducted to analyse the composition of NiCo–OH UNLS. As shown in Fig. S7,† the mass loss observed before 140 °C is assigned to the evaporation of the physically adsorbed water. The subsequent mass decrease occurring from 140 to 215 °C is attributed to the removal of interlayer trapped water in NiCo–OH UNLS. The significant mass loss between 215 and 400 °C could be ascribed to the dehydroxylation of NiCo–OH UNLS.28,29
The porous structure of NiCo–OH UNLS was investigated using nitrogen sorption isotherms. As shown in Fig. 2(F), both NiCo–OH UNLS and NiCo–OH UNDH exhibit typical type-IV isotherms with a distinct hysteresis loop in the medium- and high-pressure regions, indicating the presence of a mesoporous structure. The Brunauer–Emmett–Teller (BET) surface area of NiCo–OH UNLS was estimated to be 59.19 m2 g−1, which is nearly 2.4 times larger than that of NiCo–OH UNDH. This significant increase highlights the advantage of the constructed superstructure in enhancing the exposure and accessibility of active sites for reactions.
The above results unambiguously demonstrate the successful fabrication of NiCo–OH UNLS with ultrathin nanosheets-assembled superstructure, which presents enormous potential for improving the photocatalytic performance.
CO2 photoreduction performances
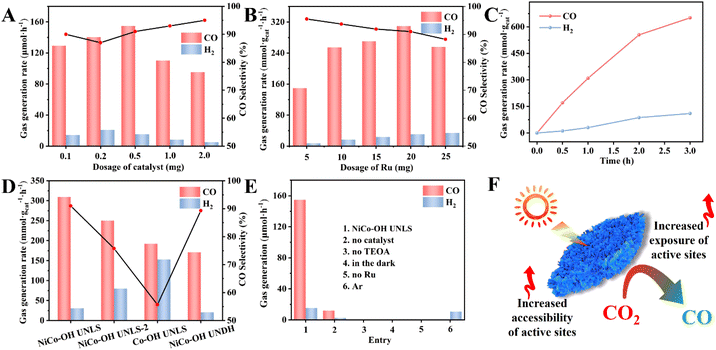
The visible-light-driven photocatalytic conversion of CO2 over NiCo–OH UNLS was tested using a monochromatic LED lamp (36 W, 450 nm). In this system, TEOA and Ru were used as the sacrificial agent and photosensitizer, respectively, with a solvent mixture of acetonitrile and water. CO and H2 were detected as the main gaseous products (Fig. S8†). Notably, the yields of CO and H2 increased significantly with prolonged irradiation time, reaching impressive values of 309.5 and 30.6 mmol g−1 h−1, respectively, under optimal reaction conditions, with a selectivity of 91.0% and an apparent quantum yield (AQY) of 1.36% for CO (Fig. 3(D) and Table S2,† entry 1). The photocatalytic performance of NiCo–OH UNLS surpasses that of previous works under similar conditions, demonstrating the advantages of its hierarchical superstructure (Table S3†). In comparison, Co–OH UNLS showed a moderate CO yield of 192.1 mmol g−1 h−1 and a CO selectivity of 55.7%. In addition, NiCo–OH UNLS-2 exhibits a worse selectivity and activity toward CO compared with NiCo–OH UNLS, highlighting the crucial role of Ni species in enhancing photocatalytic selectivity (Fig. 3(D) and Table S2,† entry 2).For comparison, NiCo–OH with an ultrathin nanosheet-assembled dodecahedron structure (NiCo–OH UNDH) was prepared using a conventional ZIF-67 dodecahedron as the precursor. XRD, XPS, SEM, TEM, HRTEM, HAADF-STEM, and EDX mapping images confirmed the successful synthesis of NiCo–OH UNDH (Fig. S9 and S10†). Besides, there is no significant phase and compositional difference between the NiCo–OH UNDH and NiCo–OH UNLS. As expected, NiCo–OH UNDH exhibited lower photocatalytic CO2 conversion rates, with a CO yield of 170.8 mmol g−1 h−1, emphasizing the importance of the 2D structure in enhancing catalytic performance (Fig. 3(D and F) and Table S2,† entry 3).
Control experiment shows that only trace amount of H2 and CO were generated in the absence of NiCo–OH UNLS catalyst, highlighting the crucial role of the active sites on the NiCo–OH UNLS species (Fig. 3(E) and Table S2,† entry 4). The CO yield steadily increase from 129.34 to 154.8 μmol h−1 as the dosage of NiCo–OH UNLS was increased from 0.1 to 0.5 mg (Fig. 3(A)). However, further increasing the amount of NiCo–OH UNLS did not enhance CO and H2 production, likely due to a light-shielding effect. No gas product were generated in the absence of TEOA, indicating that the electron donor is critical for the reaction (Fig. 3(E) and Table S2,† entry 5). Additionally, neither CO nor H2 was detected under dark condition or without Ru (Fig. 3(E) and Table S2,† entries 6–7), uncovering the key roles of both light and the photosensitizer in driving the CO2-to-CO conversion.
The effect of varying amounts of Ru photosensitizer on the catalytic performance was investigated. As shown in Fig. 3(B), both the yields of CO and H2 increase gradually as the increases of Ru amounts. However, further increases in Ru led to a decline in CO and H2 production, likely due to the light-shielding effect at high Ru concentrations. Notably, the photocatalytic activity of the NiCo–OH UNLS system reached a plateau after approximately 3 h of irradiation, which could be attributed to the deactivation of Ru (Fig. 3(C)).30 Fortunately, the activity can be resumed after supplementing with an equal amount of Ru (Fig. S11†).
The stability is crucial for the practical application of NiCo–OH UNLS. Multicycle photoreduction tests showed that the H2 and CO production rates remained nearly unchanged after four successive cycles (Fig. S12(A)†). Additionally, SEM images of the recycled NiCo–OH UNLS demonstrated that the ultrathin nanosheet-assembled 2D leaf superstructure was well preserved after the cycle tests (Fig. S12(C and D)†). XRD patterns further confirmed that the crystal structure of NiCo–OH UNLS remained almost unchanged after photocatalytic CO2 reduction, indicating excellent structural stability (Fig. S12(B)†).
Photocatalytic CO2 reaction mechanism
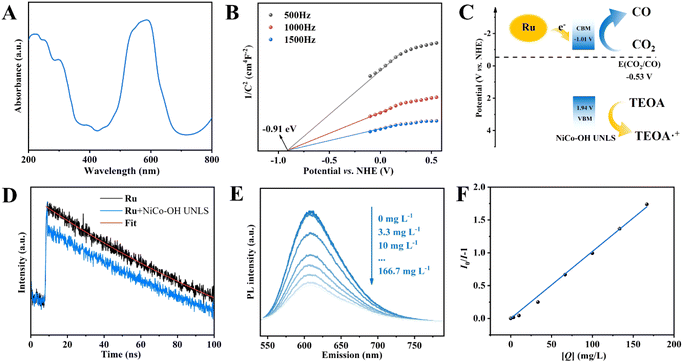
In order to uncover the original mechanism for the enhancement of photocatalytic CO2 reduction performance over NiCo–OH UNLS, the optical properties of catalysts were firstly investigated. The UV-vis diffuse reflectance spectrum of NiCo–OH UNLS exhibits two absorbance bands at approximately 400 and 700 nm, which can be assigned to the 3A 2g (F) → 3T1g (P) and 3A2g (F) → 3T1g (F) transitions in NiCo–OH UNLS, respectively (Fig. 4(A)). The optical band gap of NiCo–OH UNLS was then estimated from the UV-vis spectrum via drawing the plot of (αhν)1/2 against hν. As shown in Fig. S13,† two band gaps at Eg1 = 1.71 eV and Eg2 = 2.95 eV can be determined according to the Tauc equation. Eg1 is resulted from the ligand–metal transition and Eg2 is the energy gap between the conduction and valence bands.Mott–Schottky curve was then conducted to determine the conduction band minimum (CBM) position of NiCo–OH UNLS. As shown in Fig. 4(B), the flat band potential (Efb) of NiCo–OH UNLS is measured to be −0.91 V versus NHE. Consequently, the position of CBM was derived as −1.01 V versus NHE as the CBM is ca. −0.1 eV more negative that the flat band position. Given that the energy gap of NiCo–OH UNLS is 2.95 eV, the valence bands potential can be estimated to be 1.94 V versus NHE. Notably, the conduction band of NiCo–OH UNLS is positive that the lowest unoccupied molecular orbital (LUMO) of Ru (−1.28 V versus NHE) and negative than the reduction potential of CO2/CO (−0.53 V versus NHE).8 Therefore, the photoexcited electrons in Ru will spontaneously transfer to the conduction band of NiCo–OH UNLS, thereby facilitating the photoreduction of CO2 to produce CO (Fig. 4(C)).
The charge migration kinetics were then investigated by transient fluorescence spectroscopy. As shown in Fig. 4(D), upon the excitation of 450 nm laser, the Ru solution exhibits an emission fluorescence that follows the exponential decay with a PL lifetime of 199.8 ns. After adding NiCo–OH UNLS, an ultrafast decay of the singlet-excited state was observed, which can be ascribed to the charger transfer from Ru to NiCo–OH UNLS. Furthermore, the charge transfer behaviors of photoexcited electrons from photosensitizer Ru to the catalysts were further verified by the steady-state photoluminescence (PL). As shown in Fig. S14,† a characteristic emission peak around 610 nm was observed when the Ru solution was excited at 450 nm, which is assigned to the recombination of photogenerated carriers. The intense PL signal is significantly quenched after the addition of NiCo–OH UNLS, suggesting that the catalyst acts as an electron acceptor, thereby inhibiting the recombination of photocarriers. Moreover, NiCo–OH UNLS exhibited the maximum PL quenching compared to NiCo–OH UNDH and Co–OH UNLS, suggesting that the constructed ultrathin nanosheet assembled 2D leaf superstructure and Ni–Co dual metal sites can efficiently promote the transfer of photoexcited electrons and inhibit their recombination.
The PL quenching mechanism was further investigated via the Stern–Volmer equation.
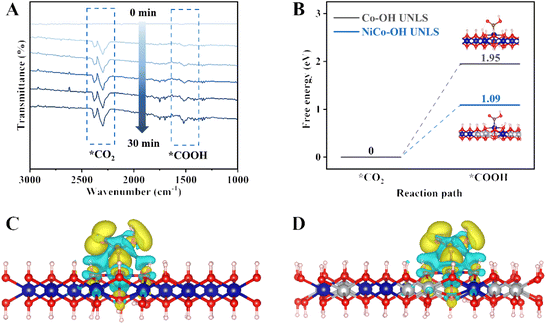
In situ Fourier transform infrared spectroscopy (in situ FTIR) is used to dynamically monitor the interface reaction process during CO2 photocatalytic reduction. As shown in Fig. 5(A), several characteristic infrared peaks emerge and gradually strengthen under visible light irradiation. Notably, two peaks located at 2297 and 2381 cm−1 correspond to the stretching vibration of adsorbed CO2.31 Significantly, the key *COOH intermediate in the CO2–CO photoconversion process is also represented by the peak located at 1513 cm−1, with its signal intensity increasing over time with extended illumination.32,33
Based on the above analysis, the proposed mechanism for the photocatalytic CO2 reduction reaction can be expressed as follows:
| CO2 → *CO2 | (1) |
| H+ + e− + *CO2 → *COOH | (2) |
| H+ + e− + *COOH → H2O + *CO | (3) |
| *CO → CO | (4) |
In this process, a CO2 molecule is first adsorbed onto the catalyst, followed by a proton-coupled electron transfer (PCET) process that forms the *COOH intermediate. Subsequently, *CO is generated through another PCET process involving *COOH, which then escapes from the interface to produce gaseous CO.
Generally, the formation of key *COOH intermediate is regarded as the rate-determining step during the photocatalytic CO2–CO process. To gain an atomic insight into the *COOH formation behavior, we conducted density functional theory (DFT) calculations (Fig. S16 and S17†). Fig. 5(B) illustrates the variation in Gibbs free energy for *COOH formation on NiCo–OH and Co–OH. Notably, the formation barrier of *COOH on Co–OH UNLS is quite high, measured at 1.95 eV. In contrast, the incorporation of a Ni atom significantly reduces the formation barrier to 1.09 eV, indicating that the Ni–Co dual site effectively promotes the formation of *COOH. To further investigate the effect of Ni–Co dual site on the *COOH formation, the differential charge analysis was conducted. As shown in Fig. 5(C and D), there is a substantial accumulation of electrons around the *COOH and NiCo–OH, which is significantly greater than that observed in NiCo–OH alone. This suggests a stronger bond interaction between *COOH and NiCo–OH. Consequently, the Ni–Co dual site in NiCo–OH UNLS enhances CO2 activation and stabilizes the *COOH intermediate, thereby accelerating CO2 conversion kinetics and boosting the generation of CO.
Conclusions
In summary, we successfully fabricated NiCo–OH UNLS, which features an ultrathin nanosheet assembled into a 2D leaf superstructure, using Co-ZIL-L as the precursor. The resulting NiCo–OH UNLS exhibits exceptional photocatalytic activity for CO2 reduction, achieving a CO production rate of 309.5 mmol g−1 h−1 with a selectivity of 91.0% under visible light irradiation, affording an apparent quantum yield of 1.36% for CO. Both in situ experiments and DFT simulations demonstrate that the Ni–Co dual sites in NiCo–OH UNLS enhance CO2 conversion kinetics by stabilizing the *COOH intermediate. Furthermore, the ultrathin nanosheet structure not only facilitates the migration of photoexcited charges but also improves the accessibility of the Ni–Co dual sites. This work provides valuable insights for designing advanced photocatalysts aimed at the transformation of CO2.Data availability
The data supporting this article have been included as part of the ESI.†Author contributions
Yang Zhang: investigation, data curation, writing – original draft. Wenfeng Zhong: investigation, formal analysis. Linhai Duan: project administration, visualization. Jiaping Zhu: methodology, validation. Hua Tan: writing – review&editing, supervision, resources, conceptualization.Conflicts of interest
The authors have declared no conflict of interest.Acknowledgements
This work was supported by the National Natural Science Foundation of China (22478135) and Guangdong Science and Technology Innovation Strategy Special Foundation (240718108184842).Notes and references
- S. Xu and E. A. Carter, Chem. Rev., 2019, 119, 6631–6669 CrossRef CAS PubMed.
- M. Ding, R. W. Flaig, H. Jiang and O. M. Yaghi, Chem. Soc. Rev., 2019, 48, 2783–2828 RSC.
- T. Kong, Y. Jiang and Y. Xiong, Chem. Soc. Rev., 2020, 49, 6579–6591 RSC.
- J. Wang, E. Kim, D. P. Kumar, A. P. Rangappa, Y. Kim, Y. Zhang and T. K. Kim, Angew. Chem., Int. Ed., 2021, 61, e202113044 CrossRef PubMed.
- S. Liu, Z. Tang, Y. Sun, J. C. Colmenares and Y. Xu, Chem. Soc. Rev., 2015, 44, 5053–5075 RSC.
- L. Wang, W. Chen, D. Zhang, Y. Du, R. Amal, S. Qiao, J. Wu and Z. Yin, Chem. Soc. Rev., 2019, 48, 5310–5349 RSC.
- L. Wang, J. Wan, Y. Zhao, N. Yang and D. Wang, J. Am. Chem. Soc., 2019, 141, 2238–2241 CrossRef CAS PubMed.
- G. Qian, W. Lyu, X. Zhao, J. Zhou, R. Fang, F. Wang and Y. Li, Angew. Chem., Int. Ed., 2022, 61, e202210576 CrossRef CAS PubMed.
- M. Li, Z. Zuo and S. Zhang, ACS Catal., 2023, 13, 11815–11824 CrossRef CAS.
- X. Hao, L. Tan, Y. Xu, Z. Wang, X. Wang, S. Bai, C. Ning, J. Zhao, Y. Zhao and Y. Song, Ind. Eng. Chem. Res., 2020, 59, 3008–3015 CrossRef CAS.
- M. Gao, J. Fan, X. Li, Q. Wang, D. Li, J. Feng and X. Duan, Angew. Chem., Int. Ed., 2023, 62, e202216527 CrossRef CAS PubMed.
- J. Ren, Y. Zheng, K. Yuan, L. Zhou, K. Wu and Y. Zhang, Nanoscale, 2020, 12, 755–762 RSC.
- Z. Zhang, Y. Cao, F. Zhang, W. Li, Y. Li, H. Yu, M. Wang and H. Yu, Chem. Eng. J., 2022, 428, 131218 CrossRef CAS.
- H. Wu, X. Y. Kong, X. Wen, S.-P. Chai, E. C. Lovell, J. Tang and Y. H. Ng, Angew. Chem., Int. Ed., 2021, 60, 8455–8459 CrossRef CAS PubMed.
- Z. Xin, M. Huang, Y. Wang, Y. Gao, Q. Guo, X. Li, C. Tung and L. Wu, Angew. Chem., Int. Ed., 2022, 61, e202207222 CrossRef CAS PubMed.
- J. Qin, S. Wang and X. Wang, Appl. Catal., B, 2017, 209, 476–482 CrossRef CAS.
- G. Kresse and J. Hafner, Phys. Rev. B: Condens. Matter Mater. Phys., 1993, 48, 13115–13118 CrossRef CAS PubMed.
- G. Kresse and J. Furthmüller, Phys. Rev. B: Condens. Matter Mater. Phys., 1996, 54, 169–185 CrossRef PubMed.
- J. P. Perdew, K. Burke and M. Ernzerhof, Phys. Rev. Lett., 1996, 77, 3865–3868 CrossRef CAS PubMed.
- W. Kohn and L. J. Sham, Phys. Rev., 1965, 140, A1133–A1138 CrossRef.
- V. Wang, N. Xu, J. Liu, G. Tang and W. Geng, Comput. Phys. Commun., 2021, 267, 108033 CrossRef CAS.
- K. Momma and F. Izumi, J. Appl. Crystallogr., 2008, 41, 653–658 CrossRef CAS.
- H. Pan, X. Wang, F. Li and Q. Xu, J. Mater. Chem. A, 2023, 11, 15006–15013 RSC.
- Y. Su, Z. Song, W. Zhu, Q. Mu, X. Yuan, Y. Lian, H. Cheng, Z. Deng, M. Chen, W. Yin and Y. Peng, ACS Catal., 2020, 11, 345–354 CrossRef.
- J. Wang, X. Zhang, X. Wang, J. Liu, S. Li, Y. Nie, K. Zong, X. Zhang, H. Meng, M. Jin, L. Yang, X. Wang and Z. Chen, Adv. Energy Mater., 2024, 14, 2402072 CrossRef CAS.
- W. Liang, M. Wang, C. Ma, J. Wang, C. Zhao and C. Hong, Small, 2023, 20, 2306473 CrossRef PubMed.
- F. Lu, Y. Ji, D. Shi, P. Zhang, S. Zhang, S. Wang and B. Zhang, J. Energy Storage, 2024, 84, 110628 CrossRef.
- S. Liu, Y. Zhang, L. Hao, A. Nsabimana and S. Shen, J. Colloid Interface Sci., 2025, 678, 924–933 CrossRef CAS PubMed.
- F. Zhong, X. Ge, W. Sun, W. Du, K. Sang, C. Yao, Y. Cao, W. Chen, G. Qian, X. Duan, Z. Yang, X. Zhou and J. Zhang, Chem. Eng. J., 2023, 455, 140536 CrossRef CAS.
- Y. Lu, T. Liu, C. Dong, Y. Huang, Y. Li, J. Chen, Y. Zou and S. Wang, Adv. Mater., 2021, 33, 2007056 CrossRef CAS PubMed.
- W. Lyu, Y. Liu, J. Zhou, D. Chen, X. Zhao, R. Fang, F. Wang and Y. Li, Angew. Chem., Int. Ed., 2023, 62, e202310733 CrossRef CAS PubMed.
- X. Jiao, X. Li, X. Jin, Y. Sun, J. Xu, L. Liang, H. Ju, J. Zhu, Y. Pan, W. Yan, Y. Lin and Y. Xie, J. Am. Chem. Soc., 2017, 139, 18044–18051 CrossRef CAS PubMed.
- J. Di, C. Chen, S. Yang, S. Chen, M. Duan, J. Xiong, C. Zhu, R. Long, W. Hao, Z. Chi, H. Chen, Y. Weng, J. Xia, L. Song, S. Li, H. Li and Z. Liu, Nat. Commun., 2019, 10, 2840 CrossRef PubMed.
Footnote |
| † Electronic supplementary information (ESI) available. See DOI: https://doi.org/10.1039/d4ra07416e |
| This journal is © The Royal Society of Chemistry 2024 |


