 Open Access Article
Influence of side-methyl substitution position on the phase state and microwave dielectric properties of triphenylacetylene-based liquid crystals
Menglong Leia,
Youlan Tua,
Lei Zhanga,
Shengli Wua,
Hongmei Chena,
Peiwen Lv *a,
Xiangru Wangb and
Zhiyong Zhang*a
aCollege of Chemical and Environmental Engineering, Wuhan Polytechnic University, Wuhan, Hubei 430023, China. E-mail: 759124198@qq.com; lvpeiwen@whpu.edu.cn
bSchool of Optoelectronic Science and Engineering, University of Electronic Science and Technology, Chengdu, Sichuan 611730, China
First published on 21st November 2024
Abstract
Liquid crystal materials are well known in display applications, and their unique birefringence and electrical tunability can be utilised in microwave devices. This innovative technology modulates and filters microwave signals, replacing conventional semiconductors for a broad operational frequency band and tunable phase shift. Although isothiocyanatobiphenylacetylene-based liquid crystals exhibit low viscosity and large dielectric anisotropy, their applications in microwave communication are hampered by their broad near-crystalline phase temperature ranges. To address this limitation, this study designed and synthesized six fluorinated biphenylacetylene liquid crystal compounds with various benzene ring side-methyl substitutions (n = 3–5). The molecular structures, liquid crystal phases, and microwave dielectric properties were evaluated. Our findings indicate that compounds with methyl substitution at the Y2 position exhibited reduced melting points, an expanded nematic phase temperature range (ΔTn ≈ 92.3 °C), and an absence of near-crystalline phases. These compounds still maintain high microwave dielectric constants within the 9–30 GHz frequency band (Δεr = 0.9–1.3) and reduced maximum permittivity losses compared to their non-methyl-substituted counterparts, thereby improving the efficiency in the microwave frequency band. In contrast, the Y1 position substitution results in a significantly narrower nematic phase temperature range (approximately 2.6 °C on average) and a substantial decrease in the dielectric constant, with a Δεr reduction of about 0.3 compared to the Y2 substitution. This work shows that the side-methyl substitution can improve the performance of triphenylacetylene-based liquid crystals in microwave communication, providing valuable insight to aid the discovery of novel microwave liquid crystals.
Introduction
In the realm of microwave device technology, liquid crystal microwave phase shifters have garnered considerable attention due to a number of advantages: a broad operational frequency band, tunable phase shift, low power consumption, compact form factor, and cost-effective production.1–4 Despite these advancements, the commercialization of microwave liquid crystal materials is challenging due to the presence of a few undesirable properties, such as high viscosity, high dielectric loss, and pronounced impact of temperature on their dielectric characteristics.5–7 Overcoming these material challenges has become the priority of research on liquid crystal materials for microwave applications.8Isothiocyanatobiphenylacetylene-based liquid crystals, well-known for their low viscosity and favorable dielectric anisotropy, are frequently proposed as microwave liquid crystal materials.9 However, their main disadvantage is the presence of a wide temperature range of near-crystalline phase states or elevated melting points. Pioneering work by O. Catanescu et al. in 2006 (ref. 10) demonstrated that the incorporation of fluorine atoms as benzene ring substituents can attenuate the temperature range of the near-crystalline phase, broaden the temperature range of the nematic phase, and reduce the melting points of the compounds. However, the molecular birefringence (Δn) was reduced due to an increase in the molecular dipole moment. In 2013, R. Dabrowski et al.11 reported that liquid crystal compounds with an ethyl substitution near the benzene ring side of acetylene bonds have a lower melting point than those with a methyl substitution. However, the nematic phase temperature range was greatly reduced, with an average reduction of approximately 30 °C, and no smectic phase state was observed. This suggests that steric hindrance of lateral methyl and ethyl can effectively inhibit the formation of the smectic phase and reduce the melting point of the compound.12 J. Dziaduszek et al. in 2017 (ref. 13) explored the impact of the fluorine atom substitution position on the phase state of the phenyl ring lateral fluorosubstituted biphenyl acetylene isothiocyanate compound liquid crystal molecules. These new compounds exhibited favorable properties, including high refractive indices and low viscosity. However, the dielectric properties pertinent to the microwave application remain unknown. The dielectric properties of liquid crystals under microwave irradiation are of great significance in the context of device applications. The steric hindrance of the lateral methyl group on the benzene ring can modify the mesomorphic properties of liquid crystal molecules.14 Concurrently, the presence of steric hindrance influences the dielectric characteristics of liquid crystals when subjected to microwave radiation, including the dielectric constant and maximum dielectric loss. However, there are few reports on the effect of the methyl substitution position on the side of the benzene ring on the mesogenic and high-frequency dielectric properties of biphenylacetylene liquid crystal compounds.
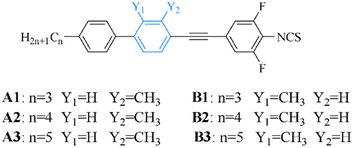
In light of these findings, the present study delineates the design and synthesis of six fluorinated triphenylacetylene isothiocyanate liquid crystal compounds with different lateral methyl substitutions on the benzene ring (as depicted in Fig. 1). This work evaluates their molecular structures, phase temperature ranges, and dielectric properties given a certain microwave frequency band. Moreover, we use density functional theory (DFT) to simulate and calculate the dipole moments and anisotropic polarizabilities of the target molecules to understand the experimental outcomes. With an in-depth understanding of the liquid crystal phase and microwave dielectric properties, the advancement of high-performance liquid crystal materials for microwave applications can be accelerated.
Experimental
Materials
Chemical reagents were purchased from Shanghai Sinopharm Chemical Reagent Co., Ltd. and were used as received, unless otherwise stated. The catalysts used in the experiments, Pd(PPh3)2Cl2, were prepared in accordance with the literature.15 (4′′-Butylbiphenyl)-4-ethynyl-2,6-difluoro-1-isothiocyanatobenzene) and (4′′-pentylbiphenyl)-4-ethynyl-2,6-difluoro-1-isothiocyanatobenzene) were synthesised in accordance with the literature.16Method
Compounds A1–A3 and B1–B3 were synthesized using n-propylphenylboronic acid, n-butylphenylboronic acid, n-pentylphenylboronic acid, 2-methyl-4-bromoiodobenzene or 3-methyl-4-bromoiodobenzene, and 2,6-difluoro-4-iodoaniline. The synthesis scheme involved the Suzuki coupling reaction,17 Sonogashira coupling,18 and isothiocyanate reaction,19 as illustrated in Fig. 2.Synthesis of intermediate compound
In a 500 mL three-necked flask with argon protection, a reaction was conducted by combining 2,6-difluoro-4-iodoaniline (30 g, 117.64 mmol), trimethylsilylacetylene (13.2 g, 117.6 mmol), cuprous iodide (0.68 g, 3.6 mmol), triphenylphosphine (0.94 g, 3.6 mmol), and Pd(PPh3)2Cl2 (0.84 g, 1.2 mmol). After the reaction reached completion, the mixture was washed sequentially with saturated aqueous ammonium chloride (100 mL × 2) and deionized water (2 × 100 mL). The organic material was extracted using ethyl acetate (100 mL × 2). The combined organic extract was dried over anhydrous sodium sulfate for 5–6 hours. Solvent evaporation under reduced pressure yielded 24.2 g of a yellow solid, giving a yield of 91.8%.Synthesis of final product I
In a 500 mL two-necked flask, the intermediate compound (24.2 g, 106.6 mmol) was reacted with K2CO3 (29.42 g, 213.2 mmol) in methanol (250 mL) at room temperature for 6–7 hours. The reaction progress was monitored by thin layer chromatography (TLC). Upon completion, inorganic salts were removed by filtration. The filtrate was extracted with ethyl acetate (100 mL × 2). The organic layer was rinsed with deionized water, dried over anhydrous sodium sulfate, and concentrated by rotary evaporation. Further purification was achieved by recrystallization, yielding 15.5 g of yellow solid I with a total reaction yield of 94.9%.Intermediates synthesis of II-a1
In a 500 mL three-necked flask, a mixture of intermediate 2-methyl-4-iodo-bromobenzene (30 g, 101.22 mmol), intermediate I (15.5 g, 101.22 mmol), cuprous iodide (0.58 g, 3.04 mmol), triphenylphosphine (0.80 g, 3.04 mmol), and Pd(PPh3)2Cl2 (0.71 g, 1.01 mmol) were prepared in triethylamine (250 mL) under argon. The reaction was stirred at 40 °C for 7–8 hours, and was monitored by TLC. The prepared solution was saturated with ammonium chloride (100 mL × 2), and sequentially washed with the same solution and deionized water. The organic phases were extracted using ethyl acetate (100 mL × 2). The extract mixture was dried over anhydrous sodium sulfate for 5–6 hours. The solvent was removed under reduced pressure, and the product was purified by recrystallization, yielding 29.06 g (89.1% yield) of an off-white solid II-a1.Synthesis of intermediate III-a1
A 500 mL two-necked flask was filled with 4-propylphenylboronic acid (10 g, 60.97 mmol), intermediate II-a1 (19.6 g, 60.97 mmol), and anhydrous potassium carbonate (25.24 g, 182.91 mmol). A catalyst solution of Pd(PPh3)4 (0.122 mmol) in deionized water (25 mL, 4.3 mL of a 0.02 g mL−1 solution) was added, and the mixture was heated and stirred under reflux condition at 78 °C for 7–8 hours. The reaction progress was monitored using (TLC). Upon completion, the reaction mixture was cooled to room temperature. The solution was filtered to obtain the solid extract, which was rinsed by deionized water (2 × 100 mL). Ethyl acetate (100 mL × 2) was used to extract the organic phase, which was dried over anhydrous sodium sulfate for 5–6 hours. The solvent was evaporated under reduced pressure to yield the crude product. Further purification by recrystallization afforded 18.2 g of white solid III-a1 with an overall yield of 89.91%.Synthesis of target compound A1
In a 500 mL two-necked flask, the intermediate product III-a1 (10.0 g, 27.7 mmol) was prepared with calcium carbonate (CaCO3, 6.92 g, 69.2 mmol), deionized water (2 mL), and dichloromethane (CH2Cl2, 100 mL). Thiophosgene (CSCl2, 1.508 g mL−1, 4.2 mL, 55.4 mmol) was introduced into a constant pressure dropping funnel, and the mixture was cooled in an ice bath. The reaction solution was added dropwise at 0 °C and stirred at room temperature overnight, which was monitored by TLC. Upon completion, anhydrous ethanol (10 mL) was added, and stirring was continued for an additional 2 to 3 hours. The mixture was then extracted with dichloromethane (50 mL × 2), rinsed with deionized water (two times), and the organic layers were combined and dried over anhydrous sodium sulfate for 5 to 6 hours. The extract was obtained by rotary evaporation, yielding a crude product that was further purified by column chromatography using 100 to 200 mesh silica gel and petroleum ether as the eluent. The purified product was recrystallized from petroleum ether to obtain 9.5 g of white flaky crystals with a purity of 99.9% and a yield of 84.8%. A1: m. p.: 110.28–112.1 °C; FT-IR (KBr, νmax/cm−1): 2951.48, 2931.23, 2852.52, 2205.11, 2042.16, 1601.11, 2042.16, 1601.24, 1560.72, 1504.64, 1461.13, 1432.51, 1422.18, 1375.37, 1041.32. 1H NMR (400 MHz, CDCl3) δ 1H NMR (400 MHz, CDCl3) δ (ppm): 7.56 (dd, J = 8.2, 2.0 Hz, 3H 2.0 Hz, 3H), 7.52 (d, J = 1.8 Hz, 1H), 7.46 (dd, J = 8.0, 1.9 Hz, 1H), 7.31 (d, J = 8.2 Hz, 2H), 7.19–7.10 (m, 2H), 2.69 (dd, J = 8.6, 6.7 Hz, 2H), 2.59 (s, 3H), 1.81–1.67 (m, 2H), 1.04 (t, J = 7.3 Hz, 3H). 13C NMR (101 MHz, CDCl3) δ (ppm): 159.01, 156.48, 145.54, 142.55, 141.99, 140.89, 137.54, 132.53, 129.05, 128.14, 126.89, 124.35, 120.31, 115.03, 114.98, 114.80, 92.35 114.80, 92.35, 37.77, 24.63, 20.92, 13.96.19 F NMR (376 MHz, CDCl3) δ (ppm): −117.33.Structure and phase characterization
The molecular structures of the synthesized intermediates and target compounds were confirmed using a Nicolet iS10 Fourier Transform Infrared Spectrometer (Thermo Fisher Scientific, USA) and an INOVO-400 MHz nuclear magnetic resonance instrument (Varian, USA). The purity of the target compounds was assessed with an LC-1260 High Performance Liquid Chromatography (Agilent Technologies, USA). The mesocrystalline properties were investigated using an X-4 Digital Microscope melting point apparatus (Tektronix, China), a CX40P hot stage polarizing optical microscope (Ningbo Shunyu Instrument Co., Ltd.), and a SETARAM DSC 141 differential scanning calorimeter (TA Instruments, USA). Birefringence values (Δn) of the target compounds were measured by the subject-object method.20Microwave dielectric property characterization
Liquid crystal mixtures were prepared using a low-melting-point lateral ethyltriphenylenediyne as a solvent M,21 and then 20 wt% of the tested compounds A1–A3 and B1–B3 were mixed with 80 wt% of M, respectively, to form 6 liquid crystal compositions. These mixtures were magnetically stirred at 80 °C for 30 minutes and subsequently cooled to room temperature naturally. The microwave dielectric properties of the liquid crystal materials in the K-band were assessed using the rectangular resonant cavity perturbation method.22 The dielectric loss can be described by the perpendicular (tan![[thin space (1/6-em)]](https://www.rsc.org/images/entities/char_2009.gif) δεr⊥) and parallel (tan
δεr⊥) and parallel (tan![[thin space (1/6-em)]](https://www.rsc.org/images/entities/char_2009.gif) δεr‖) components, of which the perpendicular loss represents the maximum dielectric loss of the liquid crystal materials (i.e., tan
δεr‖) components, of which the perpendicular loss represents the maximum dielectric loss of the liquid crystal materials (i.e., tan![[thin space (1/6-em)]](https://www.rsc.org/images/entities/char_2009.gif) δεr·max = tan
δεr·max = tan![[thin space (1/6-em)]](https://www.rsc.org/images/entities/char_2009.gif) δεr⊥).
δεr⊥).
Given the linear relationship between the dielectric anisotropy of the liquid crystal compositions and that of the constituent compounds within the hybrid system,23 the dielectric constants and loss values of the individual compounds can be calculated according to the Debye relaxation equation, eqn (1) and (2).24,25
 | (1) |
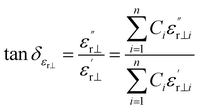 | (2) |
Liquid crystal molecular calculations
This study employed Molecular Simulation Gaussian 09 software to calculate the polarizabilities and dipole moments of the compounds of interest. The calculations were executed at the density functional theory (DFT) level in vacuum, utilizing the Becke three parameter hybrid functional with the Lee Yang Parr correlation functional (BLYP) and the 6-31G(d,p) basis set for molecular orbital calculations.26 The optimized geometries were determined prior to these calculations. The computational outcomes for the liquid crystal molecules are detailed in Table 2. VMD and Multiwfn were employed for molecular visualization and wave function analysis, respectively.27Results and discussion
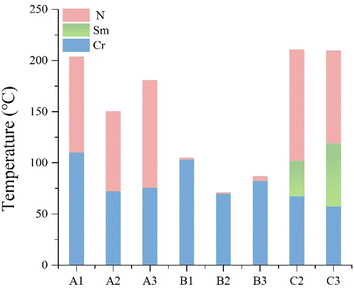
Examination of Table 1 and Fig. 3 reveals significant differences in the mesophase characteristics of compounds A1–A3 and B1–B3. The nematic phase temperature range for the A1–A3 series is notably broad, averaging 92.3 °C. Compound A3 exhibits the widest range at 105.58 °C. In contrast, the B1–B3 series displays a significantly narrow range of the liquid crystalline phase, averaging 2.6 °C.| Compound | n | Y1 | Y2 | Phase transition temperatures/°C (ΔH/kJ mol−1) | ΔTN/°C | Δn |
|---|---|---|---|---|---|---|
| a Cr denotes the crystal melting point, which can affect the low co-melting point of the liquid crystal compositions. Sm denotes the Smectic phase, which can affect the mutual solubility of the liquid crystal compositions and the stability of the microwave transmission. N denotes the Nematic phase, which can maintain the. The liquid crystal molecules adopt a more ordered structure, which is conducive to microwave transmission. Iso denotes isotropic liquid, while ΔTN denotes the temperature range of the Nematic phase. Δn denotes the birefringence tested at 20 °C in 589.2 nm. | ||||||
| A1 | 3 | H | CH3 | Cr 110.28 (31.77) N 203.57 Iso | 93.29 | 0.461 |
| A2 | 4 | H | CH3 | Cr 72.25(24.69) N 150.32 Iso | 78.07 | 0.455 |
| A3 | 5 | H | CH3 | Cr 75.58 (21.53) N 180.84 Iso | 105.58 | 0.453 |
| B1 | 3 | CH3 | H | Cr 103 (31.51) N105 Iso 105 N 77 Cr | 2.0 | 0.416 |
| B2 | 4 | CH3 | H | Cr 70 (28.71) N 71 Iso 25 Cr | 1.0 | 0.412 |
| B3 | 5 | CH3 | H | Cr 82.3 (39.79) N 87 Iso 40 Cr | 4.7 | 0.415 |
| C2 | 4 | H | H | Cr 67.2 (12.35) Sm 102.3 N 210.9 Iso | 113.19 | 0.485 |
| C3 | 5 | H | H | Cr 57.4 (13.8) Sm 119.2 N 209.9 Iso | 87.5 | 0.474 |
The measured melting points and birefringence values show interesting patterns. The melting points of compounds with identical carbon chain lengths exhibit insignificant variance. For instance, A2 melts at 72.25 °C, 2.25 °C higher than B2 at 70.0 °C. Similarly, A3's melting point is 6.72 °C lower than B3's, at 75.58 °C and 82.3 °C, respectively. Furthermore, the birefringence (Δn) for the A1–A3 series is consistently around 0.45, whereas for B2–B3, it is slightly lower at approximately 0.41. The A1–A3 series demonstrates a birefringence exceeding that of B1–B3 by more than 0.04. It should be noted that the Δn values of the target compounds were calculated using the subject-object method, as described by ref. 20.
Thus, it can be seen that substitution of the methyl group at the Y2 position on the benzene ring side appears to be more favorable to improve the mesocrystalline properties of isothiocyanatotriphenylacetylene-based liquid crystals than that at the Y1 position. Additionally, the melting points and phase transition temperature ranges of these compounds correlate with whether the number of carbon atoms in the terminal alkyl chain is odd or even. Compounds with an even number of carbon atoms in the alkyl chain exhibit lower melting points and nematic phase temperature ranges compared to those with an odd number of carbon atoms.28
The butyl and pentyl biphenyl ethynyl isothiocyanate compounds, C2 and C3, share an identical core structure and both lack methyl substitution on the benzene ring side positions. Despite exhibiting broader phase temperature ranges than compounds A2–A3, C2 and C3 possess a more prominent near-crystalline phase (as illustrated in Fig. 3). This characteristic adversely affects the formulation of the nematic phase liquid crystal materials, impeding the achievement of a low eutectic point and weakening the low temperature performance of these materials.
Fig. 4 illustrates the maximum dielectric loss and anisotropy of the target compounds across the 9–30 GHz frequency band. As depicted in Fig. 4(a), the maximum dielectric losses for the compounds exhibit a fluctuating decrease with increasing frequency. Specifically, compounds B1–B3 demonstrate lower maximum dielectric losses (tan![[thin space (1/6-em)]](https://www.rsc.org/images/entities/char_2009.gif) δεr⊥: 0.0064–0.0082) compared to A1–A3 with a similar alkyl chain length (tan
δεr⊥: 0.0064–0.0082) compared to A1–A3 with a similar alkyl chain length (tan![[thin space (1/6-em)]](https://www.rsc.org/images/entities/char_2009.gif) δεr⊥: 0.0067–0.0084). C2 and C3, lacking the methyl substitution, show higher losses (tan
δεr⊥: 0.0067–0.0084). C2 and C3, lacking the methyl substitution, show higher losses (tan![[thin space (1/6-em)]](https://www.rsc.org/images/entities/char_2009.gif) δεr⊥: 0.0070–0.0087) than their substituted counterparts with the same carbon chain length, suggesting that methyl substitution on the benzene ring, particularly at the Y1 position, is conducive to reducing microwave dielectric loss. The change in the dielectric anisotropy by varying frequencies, presented in Fig. 4(b), reveals that all target compounds have Δεr values exceeding the threshold of 0.75 for high-frequency device applicability.29 Compounds A1–A3 display the highest Δεr values (1.0–1.24), while B1–B3 have the lowest (0.77–1.11). In contrast, C2–C3 without any substitutions exhibit Δεr values (1.15–1.32) that slightly surpass those of the substituted compounds with the same carbon chain lengths. This phenomenon suggests that benzene ring methyl substitution generally diminishes the molecular dielectric anisotropy. It is interesting that the substitution at the Y1 position exerts a marginally greater impact than that at the Y2 position, which could be caused by the electronic and steric effects of the methyl group on molecular conjugation.
δεr⊥: 0.0070–0.0087) than their substituted counterparts with the same carbon chain length, suggesting that methyl substitution on the benzene ring, particularly at the Y1 position, is conducive to reducing microwave dielectric loss. The change in the dielectric anisotropy by varying frequencies, presented in Fig. 4(b), reveals that all target compounds have Δεr values exceeding the threshold of 0.75 for high-frequency device applicability.29 Compounds A1–A3 display the highest Δεr values (1.0–1.24), while B1–B3 have the lowest (0.77–1.11). In contrast, C2–C3 without any substitutions exhibit Δεr values (1.15–1.32) that slightly surpass those of the substituted compounds with the same carbon chain lengths. This phenomenon suggests that benzene ring methyl substitution generally diminishes the molecular dielectric anisotropy. It is interesting that the substitution at the Y1 position exerts a marginally greater impact than that at the Y2 position, which could be caused by the electronic and steric effects of the methyl group on molecular conjugation.
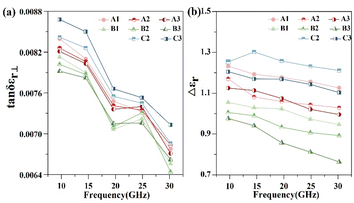 | ||
| Fig. 4 Line plots of the (a) vertical dielectric loss and (b) dielectric constant variation of the liquid crystal compounds (9–30 GHz, 20 °C). | ||
The relatively low dielectric anisotropy of B1–B3 is disadvantageous for microwave phase tunability, which is not suitable for the application of microwave phase shifters. Consequently, the design and synthesis of liquid crystal compounds for microwave applications must carefully consider the influence of substituents on the molecular structure and properties.
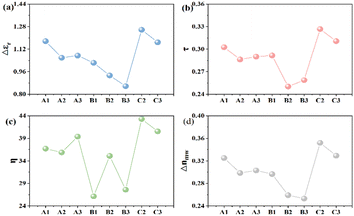
Liquid crystal materials, widely adopted in K-band microwave communication devices, are commonly assessed based on their dielectric properties at 19 GHz. Fig. 5 presents the dielectric properties of the target compounds measured at this frequency. The quality factor (η) of these compounds correlates inversely with the maximum dielectric loss (tan![[thin space (1/6-em)]](https://www.rsc.org/images/entities/char_2009.gif) δεr max) and directly with the phase tunability (τ) at a given microwave frequency,28,30 as depicted in relation (3). Furthermore, τ is positively correlated with the high-frequency dielectric anisotropy (εr),21 as expressed in eqn (4). The microwave dielectric constants εr‖ and εr can be experimentally determined by applying an electric field, allowing for the calculation of microwave birefringence (ΔnMW),2 outlined in eqn (5).
δεr max) and directly with the phase tunability (τ) at a given microwave frequency,28,30 as depicted in relation (3). Furthermore, τ is positively correlated with the high-frequency dielectric anisotropy (εr),21 as expressed in eqn (4). The microwave dielectric constants εr‖ and εr can be experimentally determined by applying an electric field, allowing for the calculation of microwave birefringence (ΔnMW),2 outlined in eqn (5).
η = τ/tan![[thin space (1/6-em)]](https://www.rsc.org/images/entities/char_2009.gif) δεr·max = τ/tan δεr·max = τ/tan![[thin space (1/6-em)]](https://www.rsc.org/images/entities/char_2009.gif) δεr⊥ δεr⊥
| (3) |
| τ = εr/εr∥ = (εr∥ − εr⊥)/εr∥ | (4) |
| ΔnMW = εr∥ − εr⊥ | (5) |
The target liquid crystal compounds exhibit a consistent trend in their Δεr, τ, and ΔnMW values, with higher Δεr correlating with increased τ, η, and ΔnMW (Fig. 5). Compounds A1–A3 demonstrated significantly higher values in terms of these parameters than B1–B3, yet they are slightly lower than those of C2 and C3. As shown in Fig. 5(c), among all these compounds, C2–C3 possessed the highest η values, A1–A3 had intermediate values, and B1–B3 showed the lowest values. This pattern suggests that methyl substitution at the Y2 position on the benzene ring cam mitigate the impacts of the π-electron conjugation, thus preserving the desirable microwave dielectric properties. However, B1–B3, featuring the Y1 substitution, displayed reduced dielectric anisotropy and diminished microwave dielectric characteristics. Although C2 and C3 presented enhanced microwave dielectric anisotropy, their prominent near-crystalline phase and elevated dielectric loss are detrimental to the application of low loss, low temperature nematic phase liquid crystal formulations.
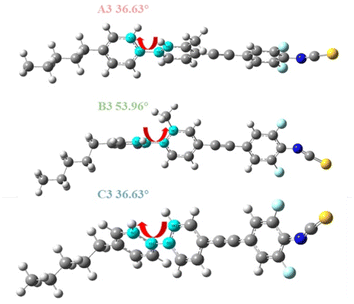
To elucidate the impact of side methyl substitution on the benzene ring properties, we employed DFT simulations to calculate the changes in the molecular aspect ratio and π-electron conjugation degree, as depicted in Fig. 6. When the methyl group is situated at the Y2 position of the benzene ring, as in A3, the steric hindrance results in minimal spatial distortion, with a dihedral angle of 36.62° that is akin to C3 at 36.63°. This similarity indicates that Y2 substitution does not enhance the dihedral angle, preserving the π-electron conjugation and planar rigidity, thereby giving the compounds favorable mesogenic properties and high birefringence.23 Conversely, Y1 substitution, exemplified by B3, intensifies the spatial distortion, elevating the dihedral angle to 53.96°. This increase in distortion diminishes the π-electron conjugation and molecular planarity, leading to a pronounced curvature in the rod-like structure and a reduced aspect ratio, averaging 2.86 (Table 1). Consequently, this structural alteration changes the dielectric crystalline properties and attenuates the photodielectric anisotropy (Δε and Δn). Compounds A1–A3 and C2–C3, with smaller dihedral angles, exhibit large aspect ratios and enhanced π-conjugation and planarity, correlating with a broader temperature range of the nematic phase.31 In contrast, B1–B3 lack a nematic phase and exhibit weak dielectric anisotropy. The methyl group's inductive effect and hyperconjugation alter the π-electron density within the liquid crystal molecules, changing their polarizability and dipole moments, as detailed in Table 2. These electronic perturbations directly modulate the dielectric characteristics of the liquid crystal compounds.
| Compound | Δα | μ | Θ | Molecular 3D size | |||
|---|---|---|---|---|---|---|---|
| L | W | H | L/W | ||||
| a Δα: polarizability; μ: dipole moment; θ: dihedral angle; L: length; W: width; H: height; L/W: aspect ratio. | |||||||
| A1 | 630.21 | 5.92 | 36.24 | 24.94 | 8.35 | 5.77 | 2.987 |
| A2 | 640.7 | 6.01 | 36.62 | 26.33 | 8.08 | 6.86 | 3.259 |
| A3 | 644.32 | 5.98 | 36.62 | 27.18 | 8.28 | 6.79 | 3.283 |
| B1 | 601.9 | 6.3 | 54.75 | 25 | 8.89 | 6.01 | 2.812 |
| B2 | 606.27 | 6.42 | 54.25 | 26.26 | 9.14 | 6.72 | 2.873 |
| B3 | 601.44 | 6.42 | 53.96 | 26.99 | 9.31 | 6.6 | 2.899 |
| C2 | 632.07 | 6.21 | 36.62 | 26.17 | 7.935 | 6.86 | 3.298 |
| C3 | 648.44 | 6.22 | 36.29 | 27.33 | 7.84 | 6.80 | 3.487 |
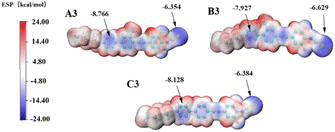
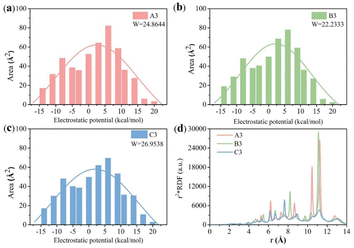
To quantify these effects, we conducted DFT27,32,33 simulation calculations as presented, and the electron density of the molecule was extracted and quantified using the wave function analysis program Multiwfn in Fig. 7 and 8. First, other related compounds were compared with C3 without methyl substitution. As depicted in Fig. 7, the inductive effect of the methyl group at the Y2 position on the benzene ring is exerted in the opposite direction of the electron-withdrawing nature of the isothiocyanate group. This behavior opposition results in the highest negative electron density in the benzene ring near the alkyl chain of compound A3 (−8.776 kcal mol−1), reducing the electron density at the isothiocyanate terminus and lowering the molecule's longitudinal dipole moment from 6.22 D to 5.98 D. In contrast, the inductive effect at the Y1 position augments the electron affinity of the isothiocyanate group, increasing the dipole moment of compound B3 from 6.22 D to 6.42 D. Molecular polarizability alterations stem from shifts in the electrostatic potential distribution, as illustrated in Fig. 8(a)–(c). These figures present the statistical maps of molecular surface area distribution across varying electrostatic potentials, which are Gaussian-fitted to highlight the differences in the compound half-peak widths. Notably, compound C3 exhibits broad half-peak widths compared to A3 and B3. The π-electron cloud density map shows that the B3 compound has the highest concentration, as indicated by the smallest half-peak width of 22.2. This pattern suggests a centralized π-electron density distribution, affirming that the side methyl group substitution can alter the π-electron distribution. Furthermore, the radial distribution of the electron density was obtained to assess the polarizability. Leveraging the radial distribution function (RDF) of the π-electron density and its correlation with the electron spatial extent 〈r2〉, as delineated in eqn (6) and (7),34,35 this method graphically represents the contribution of distinct regions to 〈r2〉. This approach provides a quantitative measure of how the π-electron density distribution influences the molecular polarizability.
 | (6) |
 | (7) |
The radial distribution function g(r) provides insights into the local electron density ρ(r) at a distance r2 from the reference point (0 as origin, which is designated as the center of nuclear charge in this work), with ρ0 representing the average electron density. The squared distance r2 is given by the equation r2 = x2 + y2 + z2. It is evident from the equation that 〈r2〉 increases with the deviation of the electron distribution from the origin, assuming a constant total electron count. This relationship allows for comparative analysis of the electron distribution breadth across different systems or states.
Fig. 8(d) illustrates the regional electron density probability distributions as a function of radial distance r from the nuclear charge centers, revealing contributions to 〈r2〉 within the range between 0 and 15 Å. C3 exhibits a uniform contribution across the radial distances, which is attributed to the absence of electron-donating methyl groups. In contrast, the electron density maps of A3 and B3 show that electrons prefer to concentrate more 〈r2〉 at distances further from the origin. Specifically, B3 exhibits a peak of electron density that is between r = 11–12 Å, whereas A3 shows a peak that is between r = 10–12 Å. This observation suggests a more centralized distribution of electrons in B3 than A3, corroborating the pattern observed in Fig. 8(a)–(c). Consequently, the radial distribution of π-electron density for A3 and C3 is less populated, which indicates a high polarizability rate compared to B3. In conclusion, it can be observed that the alteration in the dielectric characteristics of liquid crystal molecules is a consequence of the modification in the distribution of π-electrons within the molecules under microwave irradiation. The rationale behind the enhancement in the dielectric loss of liquid crystal compounds is that the π-electrons in the molecules are more prone to polarisation under the influence of microwaves, and the greater the polarisation rate, the higher the dielectric loss. In the K-band's high-frequency range (9–30 GHz), the polarization of molecules due to the electromagnetic field is more pronounced than that at lower frequencies, leading to increased absorption of microwave energy and consequently higher dielectric loss.36 The quantitative relationship between the dielectric loss and polarizability is expressed in eqn (8):37,38
 | (8) |
In the context of liquid crystal compounds, the dielectric loss is intricately linked to molecular polarizability, where γ1 represents the rotational viscosity and kii denotes the elastic constant. The coefficients αo and αe correspond to the microwave absorption. Table 2 illustrates that compounds A1–A3 and C2–C3, despite their moderate dipole moments, exhibit polarization rates exceeding 630, indicating a propensity for π-electron polarization. In contrast, compounds B1–B3, with large dipole moments, exhibit reduced polarization with an average rate of 602.99, which is attributed to their enhanced electron binding. Consequently, within the 9–30 GHz frequency range, compounds A1–A3 and C2–C3 demonstrate greater maximum dielectric losses than B1–B3.
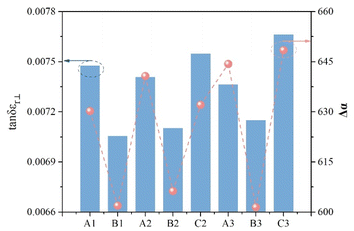
Fig. 9 delineates the correlation between the dielectric loss and polarization rate at 19 GHz, highlighting that higher polarization rates correlate with increased dielectric loss. C3, with a polarizability of 648.44, notably surpasses other compounds and reaches a maximum dielectric loss of 0.0076 at 19 GHz. These observations confirm that the polarizability and dipole moment of liquid crystal molecules are sensitive to methyl substitution at the Y1 or Y2 positions of the benzene ring, thereby adjusting the dielectric properties of the compound.
Conclusions
This study presents the design and synthesis of six fluorinated biphenyl acetylenic liquid crystal compounds, A1–A3 and B1–B3 (n = 3–5), which are achieved through Sonogashira coupling and related reactions. The dielectric and microwave dielectric properties of these compounds were evaluated and analyzed using the Debye relaxation equation. Additionally, the effects of molecular polarizabilities and electrostatic potentials on the dielectric properties were investigated via DFT simulations. The molecular polarizabilities, dipole moments, and aspect ratios were calculated to understand their influence on the dielectric behavior. The findings are summarized as follows: (1) methyl substitution at the Y2 position of the benzene ring resulted in a small dihedral angle (average 36.62°), conducive to nematic phase formation for compounds A1–A3 by inhibiting near-crystalline phase generation. Conversely, substitution at the Y1 position led to a larger dihedral angle (average 53.96°), impeding the formation of the liquid crystalline state for compounds B1–B3; (2) the enhanced π-electron conjugation in A1–A3, compared to B1–B3, exhibited high optical anisotropy (Δn), giving high microwave dielectric constants (Δεr ≥ 1.0) and phase tunability (τ ≥ 0.3) for A1–A3; (3) within the 9–30 GHz frequency range, the dielectric loss is positively correlated with molecular polarizability. Methyl substitution at the Y1 position reduces molecular polarizability, leading to low maximum dielectric losses for B1–B3. In contrast, A1–A3 and C2–C3 exhibit higher maximum dielectric losses due to greater polarizability. With an in-depth understanding of the influence of the diverse lateral methyl substitutions on the benzene ring's liquid crystal phase and microwave dielectric properties, the advancement of high-performance liquid crystal materials for microwave applications can be accelerated. In summary, by introducing methyl substitutions at various positions within liquid crystal molecules, we have successfully maintained the residual dielectric properties of the compounds at a high level, while effectively reducing the dielectric loss. Additionally, this modification has suppressed the formation of near-crystalline phases, contributing to a lowering of the eutectic point of liquid crystal compositions. However, despite these advancements, the research and development of liquid crystal compounds have yet to achieve industrial production or generate commercial benefits. This obstacle is primarily attributed to the viscosity of the liquid crystal components, which impacts the transmission speed of microwave signals. Therefore, our next focus will be on developing low-viscosity liquid crystal compounds with minimal dielectric loss, in order to overcome this challenge and further advance liquid crystal technology.Data availability
The data supporting the findings of this study are available within the article.Conflicts of interest
There are no conflicts to declare.Acknowledgements
This study is sponsored in part by the Pre-Research Fund Project (61409230701) of the Ministry of National Installations and Developments and the Guangdong Provincial Key Areas R&D Programme Funded Project (No. 2019B010158001), for which the authors express their gratitude.References
- D. C. Zografopoulos, F. Antonio and B. Romeo, Liquid-Crystal High-Frequency Microwave Technology: Materials and Characterization, Adv. Mater. Technol., 2019, 4, 1800447 CrossRef.
- S. Li, Q. Cao and C. Wang, et al., Studies on The Dielectric Properties of Laterally Fluorine-Substituted Multiphenylacetylene-Type Liquid Crystal Compounds at Microwave Region, J. Mol. Liq., 2021, 337, 116600 CrossRef CAS.
- S. Bildik, S. Dieter and C. Fritzsch, et al., Reconfigurable Folded Reflectarray Antenna Based upon Liquid Crystal Technology, IEEE Trans. Antennas Propag., 2014, 63, 122–132 Search PubMed.
- L. L. Qiu, L. Zhu and Y. Xu, Wideband Low-Profile Circularly Polarized Patch Antenna Using 90° Modified Schiffman Phase Shifter and Meandering Microstrip Feed, IEEE Trans. Antennas Propag., 2020, 68, 5680–5685 Search PubMed.
- Y. Garbovskiy, V. Zagorodnii and P. Krivosik, Liquid Crystal Phase Shifters at Millimeter Wave Frequencies, J. Appl. Phys., 2012, 111, 263 CrossRef.
- N. Kundtz, Next Generation Communications for Next Generation Satellites, Microw. J., 2014, 57, 56–64 Search PubMed.
- G. Perez-Palomino, P. Baine and R. Dickie, et al., Design and Experimental Validation of Liquid Crystal-Based Reconfigurable Reflectarray Elements with Improved Bandwidth in F-Band, IEEE Trans. Antennas Propag., 2013, 61, 1704–1713 Search PubMed.
- C. Y. Chen, T. R. Tsai, C. L. Pan and R. P. Pan, Room Temperature Terahertz Phase Shifter Based on Magnetically Controlled Birefringence in Liquid Crystals, Appl. Phys. Lett., 2003, 83, 4497–4499 CrossRef CAS.
- P. Yaghmaee, O. H. Karabey and B. Bates, et al., Electrically Tuned Microwave Devices Using Liquid Crystal Technology, Int. J. Antennas Propag., 2013, 2013, 824214 Search PubMed.
- O. Catanescu and L. C. Chien, High Birefringence Difluoroisothiocyanate Biphenyl Tolane Liquid Crystals, Liq. Cryst., 2006, 33, 115–120 CrossRef CAS.
- J. Herman, J. Dziaduszek and R. Dąbrowski, et al., Novel High Birefringent Isothiocyanates Based on Quaterphenyl and Phenylethynyltolane Molecular Cores, Liq. Cryst., 2013, 40, 1174–1182 CrossRef CAS.
- V. Lapanik, G. Sasnouski and S. Timofeev, et al., New Highly Anisotropic Liquid Crystal Materials for High-Frequency Applications, Liq. Cryst., 2018, 45, 1242–1249 CrossRef CAS.
- J. Dziaduszek, R. Dąbrowski and S. Urban, et al., Selected Fluorosubstituted Phenyltolanes with A Terminal Group: Ncs, Cn, F, OCF3 and Their Mesogenic and Dielectric Properties and Use for The Formulation of High Birefringence Nematic Mixtures to GHZ and THZ Applications, Liq. Cryst., 2017, 44, 1277–1292 CrossRef CAS.
- Y. M. Liao, H. L. Chen and C. S. Hsu, et al., Synthesis and Mesomorphic Properties of Super High Birefringence Isothiocyanato Bistolane Liquid Crystals, Liq. Cryst., 2007, 34, 507–517 CrossRef CAS.
- L. Piros, G. Krajsovszky and D. Bogdán, et al., Energy-Efficient Synthesis of Haloquinazolines and Their Suzuki Cross-Coupling Reactions in Propylene Carbonate, ChemistrySelect, 2024, 9, e202304969 CrossRef CAS.
- O. Catanescu and C. Liang-Chy, High Birefringence Difluoroisothiocyanate Biphenyl Tolane Liquid Crystals, Liq. Cryst., 2006, 33, 115–120 CrossRef CAS.
- Y. Cui, X. Guo and Y. Wang, et al., Carbonylative Suzuki Coupling Reactions of Aryl Iodides with Arylboronic Acids Over Pd/Sic, Chin. J. Catal., 2015, 36, 322–327 CrossRef CAS.
- D. Eißmann, F. Katzsch and E. Weber, X-ray Crystal Structures and Conformational Analysis of Cyclic Acetals Derived from Tartaric Acid and Rigid Spacer Units, Struct. Chem., 2012, 23, 1131–1142 CrossRef.
- S. Harusawa and T. Shioiri, Recent Advances of the Preparation of Thiocyanates, J. syn org chem jpn., 1981, 39, 741–753 CrossRef CAS.
- Z. Peng, Q. Wang and Y. Liu, et al., Electrooptical Properties of New Type Fluorinated Phenyl-Tolane Isothiocyanate Liquid Crystal Compounds, Liq. Cryst., 2016, 43, 276–284 CrossRef CAS.
- R. Dąbrowski, P. Kula and J. Herman, High Birefringence Liquid Crystals, Crystals, 2013, 3, 443–482 CrossRef.
- C.-Y. Yu, E. Li and Z.-Y. Zhang, et al., Broadband Complex Permittivity Measurements of Nematic Liquid Crystals Based on Cavity Perturbation Method, Liq. Cryst., 2020, 47, 89–98 CrossRef CAS.
- Y. Qian, S. Li and H. Tang, Effect of Substituents on The Properties of Fluorine-Containing Polyphenyl Liquid Crystal Compounds, J. Mol. Liq., 2023, 391, 123289 CrossRef CAS.
- J. Ma, J. Choi and S. Park, et al., Liquid Crystals for Advanced Smart Devices with Microwave and Millimeter-Wave Applications: Recent Progress for Next-Generation Communications, Adv. Mater., 2023, 35, 2302474 CrossRef CAS PubMed.
- R. Camley, Z. Celinski and Y. Garbovskiy, et al., Liquid Crystals for Signal Processing Applications in The Microwave and Millimeter Wave Frequency Ranges, Liq. Cryst. Rev., 2018, 6, 17–52 CrossRef CAS.
- R. Chen, Z. An and W. Wang, et al., Lateral Substituent Effects on UV Stability of High-Birefringence Liquid Crystals with The Diaryl-Diacetylene Core: DFT/TD- DFT Study, Liq. Cryst., 2017, 44, 1515–1524 CrossRef CAS.
- T. Lu and F. Chen, Multiwfn, A Multifunctional Wavefunction Analyzer, J. Comput. Chem., 2012, 33, 580–592 CrossRef CAS PubMed.
- H. Liu, M. Liu and S. Gao, et al., Synthesis and Microwave Dielectric Properties of Polyphenylene Liquid Crystal Compounds with Lateral Substitution by Methyl and Fluorine, Liq. Cryst., 2021, 48, 1581–1592 CrossRef CAS.
- V. Lapanik, G. Sasnouski and S. Timofeev, et al., New Highly Anisotropic Liquid Crystal Materials for High-Frequency Applications, Liq. Cryst., 2018, 45, 1242–1249 CrossRef CAS.
- O. H. Karabey, Microwave Material Properties of Nanoparticle-Doped Nematic Liquid Crystals, Frequenz, 2015, 69, 105–109 Search PubMed.
- D. Wan, X. Gu and J. Li, et al., Synthesis and Properties of Isothiocyanate Liquid Crystals Containing Cyclohexene Unit, Liq. Cryst., 2021, 48, 1392–1401 CrossRef CAS.
- S. Manzetti and T. Lu, The Geometry and Electronic Structure of Aristolochic Acid: Possible Implications for A Frozen Resonance, J. Phys. Org. Chem., 2013, 26, 473–483 CrossRef CAS.
- T. Lu and S. Manzetti, Wavefunction and Reactivity Study of Benzo [A] Pyrene Diol Epoxide and Its Enantiomeric Forms, Struct. chem., 2014, 25, 1521–1533 CrossRef CAS.
- P. J. Visser, S. Luding and S. Srivastava, Advanced Programming in Engineering Lecture Notes, Small, 2011, 19, 2 Search PubMed.
- B. A. F. Kopera and M. Retsch, Computing the 3d Radial Distribution Function from Particle Positions: An Advanced Analytic Approach, Anal. Chem., 2018, 90, 13909–13914 CrossRef CAS PubMed.
- J. Li, M. Hu and R. Chen, et al., Low Dielectric Loss and Good Miscibility of The Tolane Liquid Crystals by Tuning Their Lateral Substituents, J. Mol. Liq., 2021, 325, 115236 CrossRef CAS.
- T. F. Y. Matsuda and M. Yoshida, et al., Optical Material of High Refractive Index Resin Composed of Sulfur-Containing Aliphatic and Alicyclic Methacrylates, J. Appl. Polym. Sci., 2000, 76, 45–49 CrossRef CAS.
- X. Li, N. Tan and M. Pivnenko, et al., High-Birefringence Nematic Liquid Crystal for Broadband Thz Applications, Liq. Cryst., 2016, 43, 955–962 CrossRef CAS.
| This journal is © The Royal Society of Chemistry 2024 |

