 Open Access Article
Biochar made from Luffa cylindrica and applied as a bifunctional electrocatalyst in Zn–air batteries
Natalia Tsoukalaa,
Antonios-Alkinoos Papadopoulosa,
Vasiliki Premetia,
Alexandros K. Bikogiannakisa,
Eftychia Martinoa,
Angelos Amoiridis b,
Eleana Kordoulicd,
Katerina Govatsie,
Ioannis D. Manariotis
 f,
Georgios Kyriakou
 a,
Anastasios Keramidas
 *b,
Dionissios Mantzavinosa and
Panagiotis Lianos
 *a
*a
aDepartment of Chemical Engineering, University of Patras, Patras 26500, Greece. E-mail: lianos@upatras.gr
bDepartment of Chemistry, University of Cyprus, Nicosia 2109, Cyprus. E-mail: keramidas.anastasios@ucy.ac.cy
cDepartment of Chemistry, University of Patras, 26504 Patras, Greece
dSchool of Science and Technology, Hellenic Open University, Parodos Aristotelous 18, Patras 26335, Greece
eLaboratory of Electron Microscopy and Microanalysis, School of Natural Sciences, University of Patras, Patras 26500, Greece
fDepartment of Civil Engineering, Environmental Engineering Laboratory, University of Patras, University Campus, Patras 26500, Greece
First published on 9th December 2024
Abstract
Biochar has been prepared by pyrolysis of Luffa cylindrica (the vegetable sponge produced by Luffa aegiptiaca) and activated by mixing the pyrolyzed powder with KOH and pyrolyzed again. Non-activated and activated biochar have both been structurally and then electrochemically characterized to record their differences and assess their suitability as bifunctional oxygen reduction and oxygen evolution reaction electrocatalysts in Zn–air batteries. Non activated biochar carries several functional groups; however, the activation procedure led to a material with mainly O and Mg groups. Biochar activation improved its electrocatalytic properties, but both activated and non-activated luffa biochar were functional as bifunctional electrocatalysts to a satisfactory degree. This is justified by the fact that both carried a large percentage of carbon and graphitic carbon. The advantage of the non-activated biochar versus the activated biochar was its variety of functional groups while that of the activated biochar was its large specific surface area.
Introduction
Biochar is a carbonaceous material which is obtained by pyrolysis of biomass. Biochar has recently become a popular target of scientific research because it is easily made from various types of biomass, both of plant and animal origin, and it finds many and very interesting applications. Pyrolysis is carried out in the absence of oxygen or in the presence of a limited amount of oxygen which leads to the evaporation of volatile components leaving behind a porous material with very high specific surface area (SSA), frequently achieving over 1000 m2 g−1.1 A large percentage of the carbon atoms in biochar develop chemical bonds of the sp2 hybridization (C![[double bond, length as m-dash]](https://www.rsc.org/images/entities/char_e001.gif) C), which endows biochar with electric conductivity. Furthermore, biochar is intrinsically enriched with functional groups, and it can be additionally enriched with metal or non-metal active sites. These properties characterize a material that can be used as a catalyst or electrocatalyst in many and interesting physicochemical processes, including processes for environmental remediation purposes. For example, because of its porous structure and its large SSA, as well as its electric conductivity, surface charge and abundant functional groups (–OH, C
C), which endows biochar with electric conductivity. Furthermore, biochar is intrinsically enriched with functional groups, and it can be additionally enriched with metal or non-metal active sites. These properties characterize a material that can be used as a catalyst or electrocatalyst in many and interesting physicochemical processes, including processes for environmental remediation purposes. For example, because of its porous structure and its large SSA, as well as its electric conductivity, surface charge and abundant functional groups (–OH, C![[double bond, length as m-dash]](https://www.rsc.org/images/entities/char_e001.gif) O, –COOH, –NH2, etc.), biochar demonstrated strong catalytic activity2–5 and high adsorption capacity for water contaminants.2,6–9 For the same reason, it has been studied as material to make supercapacitors2,10–13 and for other energy applications, especially, as electrocatalyst for fuel cell and metal–air batteries,1,14–22 which are of interest also in the present work.
O, –COOH, –NH2, etc.), biochar demonstrated strong catalytic activity2–5 and high adsorption capacity for water contaminants.2,6–9 For the same reason, it has been studied as material to make supercapacitors2,10–13 and for other energy applications, especially, as electrocatalyst for fuel cell and metal–air batteries,1,14–22 which are of interest also in the present work.
Zn–air batteries (ZAB), which are the object of the present work, are promising alternatives to Li-ion batteries. Zn–air batteries are easy to make,1 they possess high theoretical energy density (1086 W h kg−1 (ref. 23)) and they depend on Zn, a metal which is abundant, inexpensive, easy to handle and environmentally benign. Zn–air batteries operate by oxidation of the metal at the anode electrode and reduction of oxygen at the cathode (air) electrode.1 In the case of rechargeable Zn–air batteries, the cathode electrode plays a double role: it supports oxygen reduction during battery discharging (oxygen reduction reaction, ORR) and water oxidation (oxygen evolution reaction, OER), i.e. reversal of the process, during battery charging.1 Both ORR and OER are 4e− reactions1 and they are only functional in the presence of an efficient electrocatalyst. Noble-metal-carrying supported catalysts are so far the choice of an efficient electrocatalyst but their cost and instability has offered strong reasons for the search of other more attractive materials. Fortunately, recent research shows that biochar offers a good alternative for bifunctional ORR and OER electrocatalysts.1,14,16
The capacity of a biochar to function as bifunctional electrocatalyst in a Zn–air battery has also been studied in the present work by choosing luffa as biomass origin for making biochar. Luffa, the vegetable sponge, is produced by a plant with interesting appearance and properties. The so-called Luffa cylindrica (obtained from the plant Luffa aegyptiaca) is the dried interior of a kind of pumpkin (see Graphical abstract), which is characterized by a fibrous structure and demonstrates macroscopic hierarchical porosity, as seen in Fig. 1A. This unusual structure has incited strong interest among researchers and lead to the production of biochar from luffa and to its application in several studies of environmental interest.24–31 The employment of luffa-derived biochar was almost always related with its adsorption capacity for water contaminants. For this purpose, pure luffa-biochar or biochar loaded with active additives have been employed. Despite of the several works published on luffa, we managed to locate only one publication related to the application of luffa biochar as electrocatalyst in Zn–air batteries.17 That work was concerned with the comparison between natural and forced convection operation of a battery, to determine ideal conditions for long term battery operation. Biochar was then made by means of one step pyrolysis of NH4Cl treated luffa fibers. The present work extends the above study by focusing on the process of biochar activation and a two-step pyrolysis, aiming at determining favorable conditions for making a bifunctional biochar electrocatalyst.
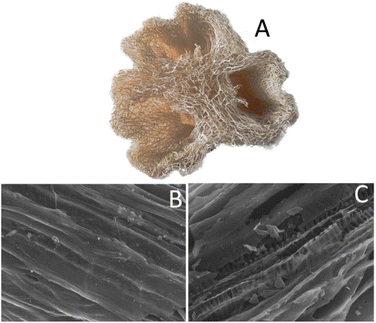 | ||
| Fig. 1 A picture of the original luffa (A); and SEM images of non-activated (B) and activated (C) luffa biochar. The scale bar for SEM is 50 μm. | ||
Experimental
Materials
All reagents were supplied by Sigma-Aldrich, unless otherwise specified. Thus, carbon cloth (CC) was from Fuel Cell Earth (Wobum, MA, USA) and carbon black (CB) from Cabot Corporation (Vulcan XC72, Billerica, MA, USA).Biochar synthesis and electrode construction
Commercial cylindrical luffa was first grinded into very small pieces, which were weighed and then packed inside a vertical quartz vessel. Then, the vessel was placed in a gradient temperature furnace (LH 60/12, Nabertherm GmbH, Germany) and pyrolyzed at 800 °C under limited air supply. The heating and cooling rate was 10 °C per min. The obtained powder was used to make the measurements assigned to the non-activated luffa biochar. In a second step, the original powder was further treated by mixing it with KOH. The mixture contained 3 parts of KOH and 1 part of biochar (by weight). Then it was again placed in a quartz vessel and heated again at 800 °C, as above. It should be noted at this point, that by increasing temperature, KOH melts and the ensuing liquid is well mixed with the biochar minority. Upon completion of this second pyrolysis step, the obtained material was washed and filtered a few times, and at the end, it was dried for 2 h at 80 °C in a vacuum furnace (Nüve, EV018). This final product was used for measurements assigned to the activated luffa biochar. Electrodes were made of carbon cloth with either non-activated or activated biochar deposited on them. To do so, 0.27 g of biochar, 0.03 g of carbon black, and 5 mL of isopropanol were vigorously mixed in a homogenizer (Silverson L5M) until a uniform dispersion was formed. Then 0.1 g of polytetrafluoroethylene (60% wt dispersion in water) was added to this dispersion, sonicated for 30 min, and homogenized again until a uniform suspension was obtained. A layer of this suspension was then deposited onto a carbon cloth of active dimension 2 cm × 2 cm by doctor blading. The cloth was then dried at 80 °C for 30 min and calcined at 340 °C for 1 h. This procedure was repeated once more to ensure uniform deposition of the biochar on the carbon cloth and load approximately the same amount of material, which was 5 mg cm−2 (i.e. a total of 20 mg). In addition, an electrode made only with carbon black on carbon cloth (CB/CC) has also been constructed by mixing 0.3 g of CB with 5 ml of isopropanol and by following the rest of the above procedure. Care was taken to deposit the same quantity of CB on CC, i.e. 5 mg cm−2, as in the case of biochar electrodes.Characterizations
Electron microscopy images for characterizing the morphologies of the prepared powders were recorded with a Scanning Electron Microscope (SEM) (JEOL, JSM-6300) operating at 20 kV, equipped with an X-ray Energy Dispersive Spectrometer (EDX) (Oxford). Measurements were performed in a UHV chamber (P ∼5 × 10⁻¹⁰ mbar) equipped with a SPECS Phoibos 100-1D-DLD hemispherical electron analyzer and a non-monochromatized dual-anode Mg/Al X-ray source.The specific surface area (SSA) of the samples was determined by using the BET equation from N2 adsorption isotherms at liquid N2 temperature recorded by using a Tristar 3000 porosimeter (Micromeritics Instrument Corporation, Norcross, GA, USA). X-ray diffraction (XRD) patterns were recorded using a Bruker D8 Advance diffractometer (Bruker, Billerica, MA, USA), equipped with a nickel-filtered CuKα (1.5418 Å) radiation source.
X-ray photoelectron spectroscopy (XPS) experiments were performed in an ultra-high vacuum (UHV) equipment, the details of which have been described elsewhere.32 Briefly, the system was operated at a base pressure of 2 × 10⁻⁹ mbar with the measurements being carried out with a non-monochromatic AlKα source, 1486.6 eV and a Leybold LH EA11 hemispherical electron energy analyzer operated at 100 eV constant pass energy. The catalyst powder was carefully pressed on a thin Pb sheet with the analyzed area being a rectangle of 1.5 × 5 mm2. Finally, atomic ratios were derived using experimentally derived Relative Sensitivity Factors (Wagner experimental RSF database corrected for the analyzer transmission function).33
Electrochemical measurements were carried out with an Autolab potentiostat PGSTAT128N (Utrecht, The Netherlands).
Electrochemical characterization of the electrodes
Electric capacitance of the biochar/CC or the CB/CC electrode was measured in a symmetric cell containing aqueous 0.5 M KOH electrolyte where two identical electrodes were submerged and kept at a distance of 5 mm parallel to each other. The active area of each electrode was 4 cm2 (i.e. 20 mg biochar load).Impedance measurements were made in the same electrolyte using the biochar/CC or the CB/CC as working electrode and a Pt wire as counter electrode.
Cyclic voltammetry and round disk electrode (RDE) voltammetry experiments were recorded using an EG&G Princeton Applied Research 273A potentiostat/galvanostat. Electrochemical procedures were performed with a three-electrode configuration: a rotating disk electrode covered with a thin film of a paste, either of activated or non-activated biochar, with one drop of liquid Nafion was used as the working electrode, a platinum wire as the auxiliary electrode, and an Ag/AgCl electrode as the reference. All potential values are referred to NHE. The electrochemical measurements were carried out in water solutions of KOH (0.1 M) purged with N2 or Ar prior to the measurement at 298 K. The experiments with O2 were performed after saturating the solutions with gaseous O2. The electrode surface A was calculated from the maximum current of the cyclic voltammogram of 1.000 mM aqueous Na3[FeCN6] using the Randles–Sevcik equation and the diffusion coefficient for Na3[FeCN6] D = 7.6 × 10⁻⁶ cm2 s−1. The number of electrons for O2 reduction was calculated by applying the Koutecky–Levich equation at various rotation rates. For the calculations, the concentration of oxygen in the bulk CO2 = 0.2 × 10⁻⁶ mol cm−3, diffusion coefficient of oxygen = 1.9 × 10⁻⁵ cm2 s−1 and the kinematic viscosity of the solution v = 0.01 cm2 s−1 were used.
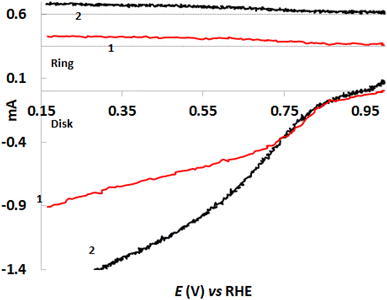
Platinum Ring Rotating Disc Electrode (RRDE) experiments were performed by using RRDE as working electrode, Ag/AgCl as reference and platinum wire as the counter electrode.34 The experiments were performed using 5–25 mV s−1 scan rate with various rotating disc speeds (0, 300, 600, 900, 1200 and 1500 rpm). The collection efficiency of RRDE (N) was calculated experimentally by the reversible redox couple [Fe(CN)6]3−/4− using the bare RRDE in a 2 mM [Fe(CN)6]3− aqueous KOH (0.1 M) solution. The ring electrode was kept constant at +0.4 V than E0 of [Fe(CN)6]3−/4− throughout the experiment while performing linear sweep at the disc electrode from −0.1 to −0.8 V (vs. RHE). N was calculated according to the relationship N = abs(IR/ID) for a potential where I is saturated at both electrodes. The experiment was performed by varying the rotation speeds (300–1500 rpm) and N was found to be similar for every rotation speed tested (∼0.244).35 The disc of the RRDE electrode was covered by a mixture of either non-activated or activated biochar and Nafion, just as described earlier for the RDE. The number of electrons was then calculated using the current from the RRDE LSV curves for both non-activated and activated biochar at 1500 rpm at a scan rate of 25 mV s−1. The formula used for the calculation was n = [4 × ID]/[ID − (IR/N)] for a potential where I is saturated at both electrodes. All experiments were repeated five times.
Construction and operation of the Zn–air battery
Zn–air batteries were constructed by using a Zn foil (Alfa Aesar) anode and a biochar/CC or CB/CC cathode electrode. The distance between the two electrodes was 5 mm and the electrolyte was 5 M NaOH containing 0.2 M ZnO.36 The active area of both electrodes was 1 cm × 1 cm. All measurements were carried out by employing the aforementioned Autolab potentiostat.Results and discussion
As detailed in the Experimental section, Luffa cylindrica pieces were pyrolyzed in two steps. Simple non-activated biochar was obtained by the first pyrolysis. In the second step, biochar powder was mixed with KOH and pyrolyzed again thus producing activated biochar. Both non-activated and activated biochar were characterized by a few techniques, as described in the following subsection.Structural characterization of non-activated and activated luffa-biochar
Scanning Electron Microscopy (SEM) images of the biochar can be seen in Fig. 1B and C. An interesting feature revealed by these images is that after the treatment with KOH and the second pyrolysis step, part of the original material was removed, and its form was reduced to an array of palisades. This resulted in increased porosity, verified by N2 adsorption measurements, discussed in the following paragraph. Recording of the SEM images was supplemented with Electron Dispersive X-ray (EDX) spectroscopy data, which are presented in Table 1. Both non-activated and activated biochar were mainly composed of carbon and oxygen. Non-activated biochar also contained a small percentage of Na, Mg, P, Si, S, Cl, K and Ca. After activation, only Mg, Si and Ca survived, at least within the detection limits of the employed apparatus. The increase in the oxygen content in the activated biochar may be justified by interaction with –OH groups from KOH. It is interesting to note that no K was detected in the activated biochar, despite of the KOH treatment. This indicates that washing of the powder after activation has successfully removed any species which were not strongly attached to the biochar body.| Biochar | C | O | Na | Mg | P | Si | S | Cl | K | Ca |
|---|---|---|---|---|---|---|---|---|---|---|
| Non activated | 89.58 | 7.21 | 0.88 | 0.39 | 0.09 | 0.12 | 0.10 | 1.11 | 0.24 | 0.28 |
| Activated | 87.86 | 10.75 | — | 0.25 | — | 0.15 | — | — | — | 0.20 |
Fig. 2 shows the results of the N2 adsorption–desorption measurements. The information extracted from these data showed that the BET specific surface area of the biochar was 330 m2 g−1 before and increased to 1377 m2 g−1 after activation. The corresponding total pore volume was 0.16 cm3 g−1 and 0.67 cm3 g−1, respectively. The improvement of textural characteristics provoked by activation is easily attributed to the creation of new pores with diameters lower than 7.5 nm and some macro-pores wider than 50 nm (Fig. 2B). This finding is in accordance with the SEM results discussed previously.
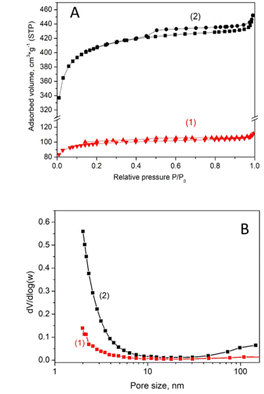 | ||
| Fig. 2 N2 adsorption–desorption isotherms at liquid nitrogen temperature (A) and pore size distribution curves (B) for the non-activated (1) and the activated (2) luffa biochar. | ||
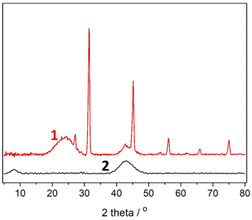
XRD results for the activated and non-activated biochar are shown in Fig. 3. The broad band between 20° and 30° is identified with carbon crystal plane (002) while the band at 44° corresponds to the (100) plane of graphitic and hexagonal carbon. The first band disappeared in the activated biochar. The peak in the range 20–30° is an evidence of the graphite crystallite layers multitude,37 while the peak at 44° is related to the plane size of the graphite crystallites. The disappearance of the first peak in the XRD pattern of activated biochar indicates a reduction in the multitude of the graphite crystallite layers, while the increase in the second peak shows a simultaneous increase of the plane size. The sample of non-activated biochar exhibits a few sharp peaks assigned to crystalline cellulose I,38 indicating that a fraction of crystalline cellulose remains induct upon pyrolysis, apparently for kinetic reasons. These peaks do not appear in the XRD pattern of activated biochar showing that activation finally destroys the above-mentioned structure. The presence of graphitic carbon is a useful property of the biochar since it is responsible for electric conductivity. This property was better assessed by X-ray Photoelectron Spectroscopy (XPS), detailed in the following paragraph.
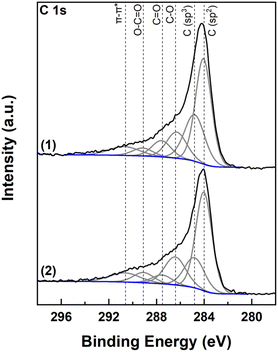
Fig. 4 shows XPS C 1s spectra of the biochar before and after activation. Deconvolution reveals the presence of six carbon species contributing to the spectra, including sp2 hybridized carbon at 284.2 eV, sp3 hybridized carbon at 285.0 eV, C–O species at 286.6 eV, C![[double bond, length as m-dash]](https://www.rsc.org/images/entities/char_e001.gif) O species at 287.7 eV, O–C
O species at 287.7 eV, O–C![[double bond, length as m-dash]](https://www.rsc.org/images/entities/char_e001.gif) O at 289.3 eV and finally a contribution from the π–π* shake up peak at 290.8 eV (Table 2).39,40 The peak shape for all carbon species was set to GL(30) and the FWHM of the peaks was set to 1.6 ± 0.1 eV for sp2 hybridized carbon, 3.0 ± 0.1 eV for π–π* shake up transition peak, and 2.0 ± 0.1 eV for the other carbon species. Quoted binding energies are accurate to 0.1 eV. After activation, oxygen/carbon surface atomic ratio rose from 0.18 to 0.24, while sp2/sp3 carbon species ratio rose from 1.8 before treatment to 2.6 after. Analysis of the samples also revealed trace amounts of a few elements shown in Table 3. Thus Na and Mg were detected in the non-activated and Si and Mg in the activated biochar. The presence then of Mg detected by EDX and XRD was additionally verified with XPS. Si was present in 4+ state (SiO2) at BE 103.6 eV for the 2p peak41 while Na was present in 1+ state at 1071.0 eV for the 1s peak (possibly NaOH).42 It should be noted that when comparing XPS and EDX results one should take into account that XPS is a surface sensitive technique detecting the presence of elements at the topmost layer of the sample. Contrary to this, EDX provides information for the entire volume of the sample (both surface and bulk). In this respect, the absence of a species in the XPS spectra could be attributed to the absence of this species from the surface of the sample and not necessarily from the bulk. Interestingly, no trace of K was detected with XPS either, again verifying complete wash out of the KOH reagent.
O at 289.3 eV and finally a contribution from the π–π* shake up peak at 290.8 eV (Table 2).39,40 The peak shape for all carbon species was set to GL(30) and the FWHM of the peaks was set to 1.6 ± 0.1 eV for sp2 hybridized carbon, 3.0 ± 0.1 eV for π–π* shake up transition peak, and 2.0 ± 0.1 eV for the other carbon species. Quoted binding energies are accurate to 0.1 eV. After activation, oxygen/carbon surface atomic ratio rose from 0.18 to 0.24, while sp2/sp3 carbon species ratio rose from 1.8 before treatment to 2.6 after. Analysis of the samples also revealed trace amounts of a few elements shown in Table 3. Thus Na and Mg were detected in the non-activated and Si and Mg in the activated biochar. The presence then of Mg detected by EDX and XRD was additionally verified with XPS. Si was present in 4+ state (SiO2) at BE 103.6 eV for the 2p peak41 while Na was present in 1+ state at 1071.0 eV for the 1s peak (possibly NaOH).42 It should be noted that when comparing XPS and EDX results one should take into account that XPS is a surface sensitive technique detecting the presence of elements at the topmost layer of the sample. Contrary to this, EDX provides information for the entire volume of the sample (both surface and bulk). In this respect, the absence of a species in the XPS spectra could be attributed to the absence of this species from the surface of the sample and not necessarily from the bulk. Interestingly, no trace of K was detected with XPS either, again verifying complete wash out of the KOH reagent.
| Biochar | C–C sp2 | C–C sp3 | C–O | C![[double bond, length as m-dash]](https://www.rsc.org/images/entities/char_e001.gif) O O |
O–C![[double bond, length as m-dash]](https://www.rsc.org/images/entities/char_e001.gif) O O |
π–π* | sp2/sp3 | O/C |
|---|---|---|---|---|---|---|---|---|
| BE (eV) | 284.2 | 285.0 | 286.6 | 287.7 | 289.3 | 290.8 | ||
| Non activated | 43.0 | 24.1 | 13.4 | 8.0 | 4.6 | 6.9 | 1.78 | 0.182 |
| Activated | 46.0 | 17.7 | 17.2 | 5.1 | 6.0 | 8.0 | 2.60 | 0.242 |
| Biochar | C | O | Na | Si | Mg |
|---|---|---|---|---|---|
| Peak used | 1s | 1s | 1s | 2p | LLM |
| Non activated | 80.6 | 14.7 | 3.5 | 0 | 1.2 |
| Activated | 76.4 | 18.4 | 0 | 2.8 | 2.4 |
In conclusion, activated luffa biochar is a material composed of a substantial percentage of graphitic carbon, ensuring electric conductivity. It contains an important percentage of active O sites while the presence of Mg was verified by multiple techniques with possible presence of other element sites, for example Ca and Si. More metal and non-metal sites were detected in the non-activated luffa biochar. Interestingly, the percentage of C–C sp2, was larger in the case of activated biochar but close to that of the non-activated biochar. Therefore, non-activated luffa biochar, which carries a rich variety of functional groups and an important percentage of graphitic carbon, is also a good candidate to act as electrocatalyst. This will be judged by the data of the following subsection.
Electrochemical characterization of the non-activated and the activated luffa biochar
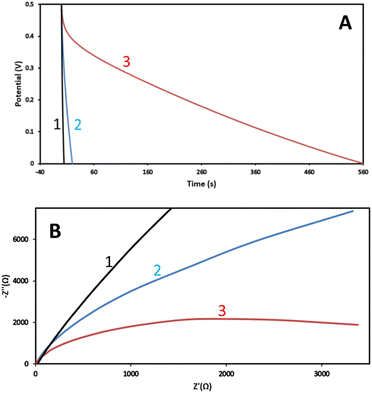
The final goal of this work was to assess the suitability of the luffa biochar to act as electrocatalyst for Zn–air batteries. Subsequently, the next step was to characterize its electrochemical behavior. When an electrode encounters an electrolyte, a Helmholtz double layer is formed at the interface between the two materials, which can act as capacitor. In the case of a porous conductive material with large SSA, like biochar, the accumulation of charges may be so high that the electrode may act as a supercapacitor. Thus, the specific capacity of electrodes made with the present biochar has been measured, as a means to characterize their behavior. Specific capacity measurements were made by depositing 5 mg cm−2 of biochar on carbon cloth (CC) electrodes, as detailed in the Experimental section. Two identical electrodes were submerged in 0.5 M aqueous KOH and then were connected in series. The specific capacity was measured by the following formula:where I is the current flowing through the electrodes, in amperes, t the time, in seconds, V the maximum potential to which the capacitor is charged, in volts, and m the mass of the biochar on each electrode, in grams. Number 2 appears, because the current is flowing through two electrodes in series. The measurement is systematically made by a galvanostatic procedure during which the capacitor is first charged to reach a specific potential and then it is completely discharged. Only the discharge process was monitored, as seen in Fig. 5A. For reasons of comparison, a measurement has also been made with electrodes carrying only carbon black (CB), with the same mass load (i.e., 5 mg cm−2). According to the data of Fig. 5A, the specific capacities were 0.01, 0.80 and 22.4 F g−1 for the CB, the non-activated and the activated luffa biochar, respectively. CB is always found to give very small specific capacities. What is interesting here is the dramatic difference between non-activated and activated biochar (about 30 times larger). This difference is justified by the large difference in their SSA, which, as already said, was 330 and 1377 m2 g−1, for the non-activated and the activated biochar, respectively.
As an additional means of comparison between non-activated and activated luffa biochar as well as comparison of both with CB, impedance measurements have been carried out in a two-electrode reactor, at V = 0, with biochar/CC or CB/CC acting as working and a Pt wire as counter electrode. The results are shown in Fig. 5B. By fitting a RRC Nyquist plot, the charge transfer resistance was calculated, and the following values have been found: 34.4, 14.9 and 4.1 kΩ for CB, non-activated and activated biochar, respectively. The smallest charge transfer resistance was measured in the case of activated biochar; once more, its marked superiority was verified. The smallest charge transfer resistance can be a result of several factors but the most important is specific surface and sp2/sp3 ratio, which were the highest in the case of activated biochar. Indeed, high SSA offers more sites for charge transfer while high sp2/sp3 ratio offers higher electric conductivity.
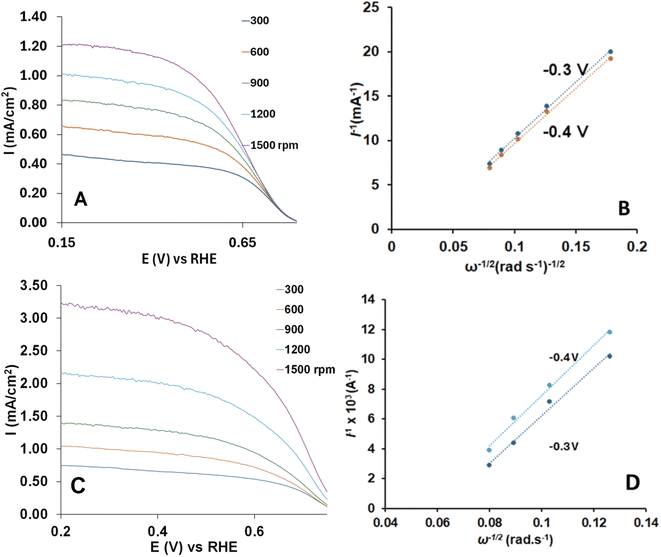
ORR capacity of electrodes made with non-activated or activated luffa biochar has been studied using a rotating disk electrode at various rotation speeds, as shown in Fig. 6. The electron transfer number for the ORR were calculated from the Koutecky–Levich plots using the Koutecky–Levich equation:
 | (1) |
The maximum currents at 1500 rpm were 1.25 and 3.50 mA cm−2 for non-activated and activated biochar, respectively. The obtained current values indicate that activated catalyst provides a higher current for the ORR process for the applied potential range, while both catalyst currents were short of the highest currents for the Pt/C electrode (4.15 mA cm−2) at the same conditions (not shown).
The Koutecky–Levich RDE technique is not an accurate method to characterize porous carbon materials for oxygen reduction because the Koutecky–Levich equation is based on flat and smooth coatings and does not consider the porous surface of the materials.34 In order to make the K–L measurements as accurate as possible and take in consideration the porosity of the electrode, we measured the area of the covered electrode from the maximum current of the CVs of a 1.0 mM aqueous solution of [FeCN6]3− using Randles–Sevcik equation.43
RRDE voltammetry is considered to be more accurate technique to determine the number of electrons transferred.34 Thus the number of the electrons was calculated from RRDE voltammographs (Fig. 7) using the eqn (2)
| n = 4ID/(ID − IR/N) | (2) |
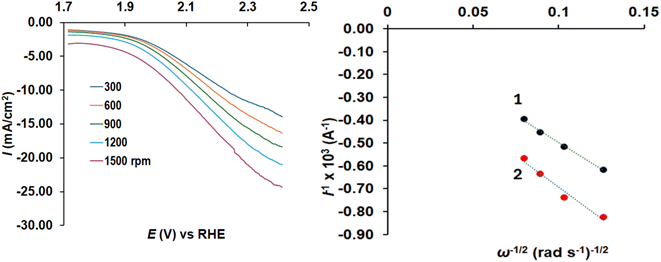
The behavior of the two electrodes was also studied for the oxygen evolution reaction (OER, i.e. water oxidation) and the results can be seen in Fig. 8 showing oxidation curves and the Koutecky–Levich plots for the two samples. The activated biochar gave substantially lower inverted currents, therefore, higher OER currents than the non-activated luffa biochar. The maximum current densities at 2.4 V vs. RHE were −8.9 and −8.0 mA cm−2 for non-activated and activated biochar respectively which are lower than the respective electrode with IrO2 ∼12 mA cm−2.
In conclusion, the superiority of the activated compared to the non-activated luffa biochar is out of question, examined both as supercapacitor and as bifunctional electrocatalyst. Nevertheless, as will be seen in the following subsection, they can both serve as electrocatalyst in the construction of Zn–air batteries.
Application of the non-activated and the activated luffa biochar in the construction of Zn–air batteries
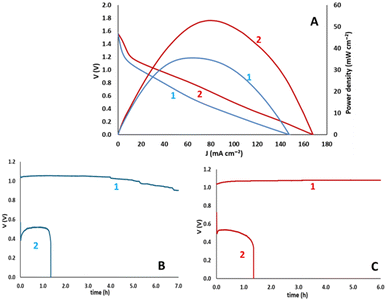
Zn–air batteries were made by using Zn foil as anode electrode and carbon cloth loaded with biochar as cathode electrode. The deposition of biochar on carbon cloth is detailed in the Experimental section. The aqueous electrolyte contained 5.0 M KOH and 0.2 M Zn acetate. Fig. 9 summarizes all data characterizing the devices obtained. Fig. 9A shows voltage and power density vs. current density characteristics while Fig. 9B and C show battery discharge efficiencies for the non-activated and the activated luffa biochar, respectively. The devices had the same open-circuit voltage while short-circuit current density was about 13% higher in the case of activated biochar, resulting in substantially higher maximum power density. It is of interest at this point to compare the present data with those of ref. 17, also studying application of luffa biochar to Zn–air batteries. The open-circuit voltage was approximately the same but the current falls short of that in ref. 17. In addition to the lower electron transfer number for ORR presently reported, it further verifies the advantage of forced convection functionality introduced in ref. 17. The discharge efficiencies of the batteries were studied galvanostatically with currents equal to 20 and 100 mA and were calculated by the following procedure. The area below each discharge curve multiplied by the corresponding discharge current in Amperes gives the total energy produced by the battery in Wh. By dividing by the Zn mass consumed during each operation, the energy density can be calculated in W h kg−1. The obtained value was then compared with the theoretical energy density of 1086 W h kg−1 (ref. 23) to give the actual battery efficiencies. The related data are listed in Table 4. It is noted that in both cases, lower discharge currents lead to higher efficiencies. Thus, for I = 100 mA, the efficiencies dropped below 35%, while for I = 20 mA, the efficiencies were higher than 65%. Batteries made with activated biochar reached larger efficiencies but the differences with those made with non-activated biochar were not substantially larger. In addition, it is worth noting at this point that the current benchmark energy densities of primary Zn–air batteries ranges between 400 and 450 W h kg−1. Since the present batteries offered energy densities ranging between 337 and 793 W h kg−1, it is understood that they both approach or even overpass the current standards.| Biochar | Current (mA) | Potential × time (V h) | Energy (W h) | Zn mass (mg) | Energy density (W h kg−1) | η (%) |
|---|---|---|---|---|---|---|
| Non-activated | 20 | 7.17 | 0.143 | 200 | 715 | 66 |
| 100 | 0.663 | 0.066 | 196 | 337 | 31 | |
| Activated | 20 | 6.93 | 0.138 | 174 | 793 | 73 |
| 100 | 0.667 | 0.067 | 182 | 368 | 34 |
By taking into consideration the bifunctional ORR and OER character of the non-activated and the activated biochar, it is necessary to also examine the charge–discharge functionality of the batteries made by these biochars. Indeed, the batteries were subjected to galvanostatic charge–discharge cycles and the obtained results are shown in Fig. 10. For reasons of comparison, batteries made by depositing pure carbon black on the air electrode were also examined. Some interesting conclusions can then be extracted from these data. The superiority of the activated biochar is obvious, compared with both non-activated and carbon black electrocatalysts, since it offers devices with the highest output voltage while it requires the smallest input voltage to charge the battery. Indeed, in the curves of Fig. 10, the lowest potential corresponds to battery discharge and the highest to battery charge. Correspondingly, discharge corresponds to ORR and charge to OER. Activated biochar is then a better bifunctional electrocatalyst, in accordance with the data of Fig. 6.
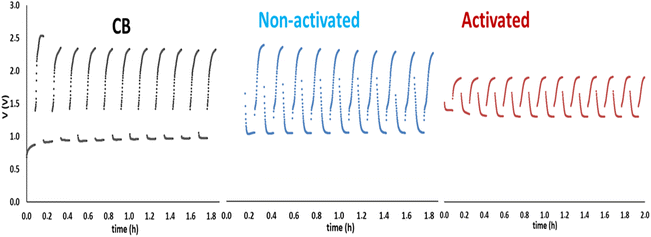 | ||
| Fig. 10 Charge–discharge cycles for rechargeable Zn–air batteries made by using CB, non-activated and activated luffa biochar as electrocatalysts on the air–electrode. | ||
In conclusion, it has been found that both non-activated and activated biochar can be used as electrocatalysts to make Zn–air batteries. There exists a definite superiority of the activated luffa biochar, but the battery made with the non-activated biochar does not dramatically fall short of the activated equivalent, at least as far as construction of Zn–air batteries is concerned. This is an interesting conclusion, since the non-activated biochar can be made with minimum energy expenditure.
Conclusions
Luffa biochar is an interesting material, which can be used as bifunctional electrocatalyst to make Zn–air batteries. There exists a definite superiority of the activated versus the non-activated biochar, which obtained dramatic dimensions in the case the two materials were used to make supercapacitors. However, these differences were substantially smoothened in the case of the batteries. The large difference in supercapacity is associated with the corresponding difference in specific surface area. The smaller differences demonstrated in battery functionality can be justified by the fact that both biochars have a similar carbon and graphitic carbon content while the smaller porosity is counterbalanced by the richer active sites in the case of the non-activated biochar.Data availability
Data are available upon request from the authors.Author contributions
Natalia Tsoukala, investigation and formal analysis; Antonios-Alkinoos Papadopoulos, investigation and formal analysis; Vasiliki Premeti, investigation and formal analysis; Alexandros K. Bikogiannakis, investigation, formal analysis and funding acquisition; Eftychia Martino, investigation and funding acquisition; Angelos Amoiridis, investigation and formal analysis; Eleana Kordouli, investigation, formal analysis, resources and writing original draft; Katerina Govatsi, investigation, formal analysis, resources and writing original draft; Ioannis D. Manariotis, investigation, formal analysis and resources; Georgios Kyriakou, resources, supervision and writing original draft; Anastasios Keramidas, resources, supervision and writing original draft; Dionissios Mantzavinos, resources and supervision; Panagiotis Lianos, conceptualization, project administration, resources and writing review and editing.Conflicts of interest
There are no conflicts of interest to report.Acknowledgements
Part of this research was supported by the Hellenic Foundation for Research and Innovation (H. F. R. I.) under the “3rd Call for H. F. R. I. Research Projects to support Post-Doctoral Researchers” (Project Number: 7165). Alexandros K. Bikogiannakis gratefully acknowledges financial support from Andreas Mentzelopoulos foundation.Notes and references
- T. Kottis, N. Soursos, K. Govatsi, L. Sygellou, J. Vakros, I. D. Manariotis, D. Mantzavinos and P. Lianos, J. Colloid Interface Sci., 2024, 665, 10–18 CrossRef CAS PubMed.
- A. Ratheesh, B. R. Sreelekshmy and S. M. A. Shibli, Sustainable Energy Fuels, 2023, 7, 1454 RSC.
- D. Kalampaliki, G. D. T. M. Jayasinghe, E. Avramiotis, I. D. Manariotis, D. Venieri, S. G. Poulopoulos, J. Szpunar, J. Vakros and D. Mantzavinos, Chem. Eng. Res. Des., 2023, 194, 306–317 CrossRef CAS.
- S. Giannakopoulos, J. Vakros, Z. Frontistis, I. D. Manariotis, D. Venieri, S. G. Poulopoulos and D. Mantzavinos, Catalysts, 2023, 13, 233 CrossRef CAS.
- A. C. M. Vilas-Boas, L. A. C. Tarelho, H. S. M. Oliveira, F. G. C. S. Silva, D. T. Pio and M. A. A. Matos, Sustainable Energy Fuels, 2024, 8, 379 RSC.
- X. Jia, T. Yin, Y. Wang, S. Zhou, X. Zhao, W. Chen and G. Hu, Biochar, 2023, 5, 84 CrossRef CAS.
- W. Zhang, R. Chen, J. Li, T. Huang, B. Wu, J. Ma, Q. Wen, J. Tan and W. Huang, Biochar, 2023, 5, 25 CrossRef CAS.
- M. R. Elkatory, M. Yılmaz, M. A. Hassaan and A. E. Nemr, Sci. Rep., 2024, 14, 6830 CrossRef CAS PubMed.
- Z. Phiri, N. T. Moja, T. T. I. Nkambule and L. A. de Kock, Heliyon, 2024, 10, e25785 CrossRef CAS PubMed.
- S. Giannakopoulos, J. Vakros, V. Dracopoulos, I. D. Manariotis, D. Mantzavinos and P. Lianos, J. Cleaner Prod., 2022, 377, 134456 CrossRef CAS.
- R. Dhawle, J. Vakros, D. Mantzavinos, V. Dracopoulos and P. Lianos, Electrochim. Acta, 2022, 427, 140846 CrossRef CAS.
- L. Zhang, Y. Zhang, S. Jiao, J. Zhang, X. Zhao, H. Chen and J. Jiang, ChemSusChem, 2023, 16, e202202393 CrossRef CAS.
- V. Kumar and P. Verma, J. Appl. Sci. Environ. Manage., 2024, 352, 120052 CAS.
- S. Zago, L. C. Scarpetta-Pizo, J. H. Zagal and S. Specchia, Electrochem. Energy Rev., 2024, 7, 1 CrossRef CAS.
- S.-W. Kim, Y. Son, K. Choi, S.-I. Kim, Y. Son, J. Park, J. H. Lee and J.-H. Jang, ChemSusChem, 2018, 11, 4203–4208 CrossRef CAS PubMed.
- T. Zhou, X. Wu, S. Liu, A. Wang, Y. Liu, W. Zhou, K. Sun, Sh. Li, J. Zhou, B. Li and J. Jiang, ChemSusChem, 2024, 14, e202301779 CrossRef PubMed.
- Sh. Han, Y. Wu, Sh. Peng, Y. Xu, M. Sun, X. Su, Y. Zhong, H. Wen, J. He and L. Yu, Chem. Eng. Sci., 2023, 272, 118615 CrossRef CAS.
- M. A. A. Mahbub, A. Mulyadewi, C. Gustine Adios and A. Sumboja, AIP Conf. Proc., 2022, 2652, 040011 CrossRef.
- Sh. Han, Sh. Peng, Z. Gao, M. Sun, G. Cheng, H. Zhang, X. Su, M. Chen and L. Yu, Electrochim. Acta, 2022, 424, 140667 CrossRef CAS.
- W. Miao, W. Liu, Y. Ding, R. Guo, J. Zhao, Y. Zhu, H. Yu and Y. Zhu, J. Environ. Chem. Eng., 2022, 10, 108474 CrossRef CAS.
- Z. Zhang, Z. Yi, J. Wang, X. Tian, P. Xu, G. Shib and S. Wang, J. Mater. Chem. A, 2017, 5, 17064 RSC.
- Z. Zhang, X. Zhao, S. Xi, L. Zhang, Z. Chen, Z. Zeng, M. Huang, H. Yang, B. Liu, S. J. Pennycook and P. Chen, Adv. Energy Mater., 2020, 10, 2002896 CrossRef CAS.
- Y. Li and H. Dai, Chem. Soc. Rev., 2014, 43, 5257–5275 RSC.
- I. Liatsou, I. Pashalidis, M. Oezaslan and C. Dosche, J. Environ. Chem. Eng., 2017, 5, 4069–4074 CrossRef CAS.
- M. Philippou and I. Pashalidis, J. Radioanal. Nucl. Chem., 2023, 332, 1395–1398 CrossRef CAS.
- Y.-J. Shih, C.-D. Dong, Y.-H. Huang and C. P. Huang, Sci. Total Environ., 2019, 673, 296–305 CrossRef CAS PubMed.
- F. Yao, Q. Yang, M. Yan, X. Li, F. Chen, Y. Zhong, H. Yin, Sh. Chen, J. Fu, D. Wang and X. Li, J. Hazard. Mater., 2020, 386, 121651 CrossRef CAS.
- Z. Hao, Q. Wang, Z. Yan and H. Jiang, J. Hazard. Mater., 2021, 401, 123859 CrossRef CAS PubMed.
- M. Salimi, Z. Salehi, H. Heidari and F. Vahabzadeh, J. Environ. Chem. Eng., 2021, 9, 105403 CrossRef CAS.
- P. H. C. de Souza, S. D. F. Rocha and D. B. de Rezende, Waste Biomass Valor., 2023, 14, 1753–1768 CrossRef CAS.
- F. Zhi, W. Zhou, J. Chen, Y. Meng, X. Hou, J. Qu, Y. Zhao and Q. Hu, Bioresour. Technol., 2023, 387, 129695 CrossRef CAS.
- S. Tsatsos, S. Ladas and G. Kyriakou, J. Phys. Chem. Sci., 2020, 124, 26268–26278 CAS.
- C. D. Wagner, L. E. Davis, M. V. Zeller, J. A. Taylor, R. H. Raymond and L. H. Gale, Surf. Interface Anal., 1981, 3, 211–225 CrossRef CAS.
- L. Bouleau, S. Perez-Rodríguez, J. Quílez-Bermejo, M. T. Izquierdo, F. Xu b, V. Fierro and A. Celzard, Carbon, 2022, 189, 349–361 CrossRef CAS.
- Rotating electrode methods and oxygen reduction electrocatalysts, ed. W. Xing, G. Yin and J. Zhan, Elsevier, 2014 Search PubMed.
- M. Katsaiti, E. Papadogiannis, V. Dracopoulos, A. Keramidas and P. Lianos, J. Power Sources, 2023, 555, 232384 CrossRef CAS.
- Y. Lin, H. Xu, Y. Gao and X. Zhang, Biomass Conv. Bioref., 2023, 13, 3785–3796 CrossRef CAS.
- S. Gokulkumar, I. Suyambulingam, D. Divakaran, G. Suganya Priyadharshini, M. Aravindh, J. Iyyadurai, M. Sanju Edwards and S. Siengchin, Macromol. Res., 2023, 31, 1163–1178 CrossRef CAS.
- X. Chen, X. Wang and D. Fang, Fullerenes, Nanotubes Carbon Nanostruct., 2020, 28, 1048–1058 CrossRef CAS.
- P. Ntzoufra, J. Vakros, Z. Frontistis, S. Tsatsos, G. Kyriakou, S. Kennou, I. D. Manariotis and D. Mantzavinos, J. Environ. Chem. Eng., 2021, 9, 105071 CrossRef CAS.
- M. Di, E. Bersch, R. Clark, S. Consiglio, G. Leusink and A. Diebold, J. Appl. Phys., 2011, 108, 114107 CrossRef.
- J. Gorham, NIST X-Ray Photoelectron Spectroscopy Database – SRD 20, National Institute of Standards and Technology, 2012 Search PubMed.
- A. D. Keramidas, S. Hadjithoma, C. Drouza, T. S. Andrade and P. Lianos, New J. Chem., 2022, 46, 470–479 RSC.
| This journal is © The Royal Society of Chemistry 2024 |

