 Open Access Article
Sunlight-activated heterostructure MoS2/CdS nanocomposite photocatalyst with enhanced photocatalytic activity: band alignment and mechanism study†
Kaysar Hamid,
Muhammad Zobayer Bin Mukhlish and
Md. Tamez Uddin *
*
Department of Chemical Engineering and Polymer Science, Shahjalal University of Science and Technology, Sylhet, 3100, Bangladesh. E-mail: mtuddin_cep@yahoo.com; mtuddin-cep@sust.edu
First published on 9th December 2024
Abstract
A high recombination rate is a major limiting factor in photocatalysis. Mitigating recombination through material engineering and photocatalyst optimization is key to enhancing photocatalytic performance. In this study, a heterostructure MoS2/CdS nanocomposite was synthesized through a hydrothermal method in a Teflon-lined autoclave subjected to a temperature of 200 °C for 16 hours. The resulting photocatalysts were characterized using a variety of techniques to understand their structural, surface, and optical properties. The photocatalytic activity of the as-synthesized photocatalysts was investigated by degrading methyl orange dye under both sunlight and visible light irradiation. Regardless of its MoS2 content, the heterostructure MoS2/CdS NC exhibited enhanced degradation efficiency relative to that of pure CdS, MoS2, and commercial TiO2 P25, with 5 wt% MoS2/CdS NCs exhibiting the highest degradation performance among all the evaluated photocatalysts. This behavior was justified by improved charge separation and reduced charge recombination, which were attributed to the valence band and conduction band offsets at the MoS2/CdS interface, as evidenced by band alignment study. The enhanced charge separation and reduced charge recombination were further validated by photoluminescence (PL), electrochemical impedance spectroscopy (EIS) and linear sweep voltammetry (LSV) measurements. Furthermore, an active species trapping experiment confirmed that electron transfer to oxygen and the subsequent formation of superoxide anions (O2−) radical play the most significant roles in photocatalytic degradation under visible light illumination. Finally, the ability to reuse the MoS2/CdS NCs multiple times without substantial loss of activity evidenced their stability, thus paving the way for advancements in large-scale environmental remediation and other industrial applications.
1. Introduction
A wide range of different chemical sectors, such as the textile, food, paper, printing, leather, and cosmetics industries, employ significant amounts of synthetic dyes to color their completed products.1,2 The textile sector is responsible for around two-thirds of global dye consumption, with about 10–15% of these dyes being discharged into the environment as effluent.1 The dyeing process in the textile industry necessitates a substantial quantity of water, which is subsequently released as effluent once it has been used. Furthermore, the increasing demand for textiles and the corresponding rise in manufacturing, along with the usage of dyes, have collectively resulted in dye wastewater emerging as a significant source of pollution in recent times. Most of these dyes are carcinogenic, and their anaerobic degradation in sediments could produce toxic amines, making them a potential health hazard.3 The discharge of color wastes into receiving waters harms the environment by reducing light penetration and, thus, photosynthesis in aquatic life.4 Therefore, the removal of such dyes from process effluent becomes environmentally important. Reducing pollution levels to the expected level using current technologies, such as adsorption, chemical oxidation, photo-degradation, flocculation, coagulation, electro-chemical oxidation, and biological processes, is usually challenging and expensive.5–13 Each process possesses a unique array of benefits and drawbacks. For example, both chemical coagulation and adsorption do not induce color degradation; nevertheless, they can pose a challenge in waste management as these processes produce huge amounts of secondary sludge.14,15 Consequently, one of the challenges that we face today is developing dye-containing wastewater processing technologies that are both secure and commercially viable. In this context, reactive systems that are significantly more effective than conventional ones are required.Over recent years, heterogeneous photocatalysis has gained considerable interest due to its promising potential in addressing environmental pollution, particularly for the reduction of heavy metals, CO2 and degradation of organic pollutants in both water and air.16–23 The versatility and efficiency of various photocatalysts, such as metal oxides, sulfides, and heterostructure composites, have made them attractive candidates for environmental remediation.7,24–28 However, the implementation of this approach in industry has been limited because of the quick recombination of charge carriers created by light. In addition, most commercially available photocatalysts have large band gaps that are not effective when exposed to sunlight. Cadmium sulfide (CdS) and molybdenum disulfide (MoS2) have recently demonstrated significant potential as photocatalysts for the decomposition of organic pollutants under visible light exposure.29,30 CdS has garnered significant attention because of its small energy gap of 2.4 eV, favorable position of its band edges, and outstanding ability to catalyze chemical reactions using visible light in the areas of breaking down pollutants by photocatalysis, separating water into hydrogen and oxygen, and converting solar energy.31–33 In addition, MoS2 has recently gained significant attention because of its potent oxidizing action, exceptional stability and repeatability, affordability, and non-toxic nature.34–36 The MoS2 absorbs light well in the visible spectrum because of its narrow band gap of 1.73 eV at ambient temperature.37 Nevertheless, the extensive utilization of these materials is greatly restricted by the quick recombination of photogenerated electron–hole pairs and the significant photo-corrosion impact.
To enhance the photocatalytic activity of CdS or MoS2, researchers have concentrated on creating heterostructure nanocomposites, such as TiO2–CdS,38 CuS–CdS,39 ZnO–CdS,40 MoS2-RGO,41 MoS2–TiO2,42,43 MoS2–CuO,44 MoS2–CuS,45 and MoS2–MoO3.46 According to reports, CdS is classified as an n-type semiconductor, while MoS2 is classified as a p-type semiconductor. These two semiconductors have different work functions. The conduction band position of CdS is more negative than that of MoS2, but the valence band position of CdS is higher than that of MoS2. Hence, when CdS and MoS2 come into contact, there exists a valence band and conduction band offset at the interface between CdS and MoS2. The presence of band offsets is anticipated to cause the vectorial separation of photogenerated electron–hole pairs, leading to a reduction in charge recombination. Therefore, the combination of CdS and MoS2 is anticipated to decrease the recombination of charge carriers generated by light. Recently, MoS2/CdS nanocomposites have been widely used for hydrogen evolution reaction47–53 and environment clean-up.54–57 Zhou et al. synthesized CdS/MoS2 nanooctahedron heterostructure using a hydrothermal method.52 The resulting CdS/MoS2 nanooctahedrons exhibited a higher photocatalytic H2 production rate of 27.16 mmol h−1 g−1 under visible light irradiation. This enhanced photocatalytic performance was attributed to the improved separation of photogenerated charge carriers facilitated by the CdS/MoS2 heterostructure, which helps to minimize charge recombination and maximize the photocatalytic efficiency for hydrogen production. In another study, Zhang et al. reported that MoS2/CdS heterostructure exhibited much higher visible-light photoelectrocatalytic activity and higher stability toward the water splitting than pure CdS film.48 The enhanced visible light absorption and the formation of a p–n junction between CdS and MoS2 significantly contributed to the improved photoelectrochemical performance of the MoS2/CdS heterojunction film. Notably, the loading of 0.2 wt% of MoS2 as a co-catalyst on CdS resulted in a 36-fold increase in photocatalytic activity for hydrogen evolution over pure CdS.50 Similarly, Zhao et al. discovered that MoS2/CdS nanocomposites with 6 wt% MoS2 achieved H2 evolution rates that were 14.61 times higher than pristine CdS nanorods.53 This substantial increase was likely due to the improved charge separation at the MoS2/CdS interface. Wang et al. synthesized flower-like MoS2/CdS heterostructures using a one-pot hydrothermal process and observed that these structures exhibited superior photocatalytic activity for methylene blue degradation under visible light, outperforming pure MoS2 and CdS.55 Similarly, Xia et al. synthesized flower-like CdS@MoS2 nanocomposites using the hydrothermal method, which also demonstrated enhanced degradation efficiency of methylene blue. In another study, MoS2/CdS nanohybrid synthesis by the solvothermal method exhibited higher photocatalytic activity for the degradation of Rhodamine B.57 The consistently enhanced photocatalytic activity in these studies was largely attributed to effective charge separation at the MoS2/CdS interface, minimizing electron–hole recombination and optimizing photocatalytic reactions.
Despite substantial progress, significant gaps in knowledge persist in understanding the fundamental mechanics of MoS2/CdS heterostructures, particularly regarding band offset and charge separation at the MoS2/CdS interface. The concepts of band offset, pertaining to the alignment of conduction and valence bands between MoS2 and CdS, are crucial for regulating electron flow and promoting efficient charge carrier separation inside the heterostructure. An in-depth examination of the influence of these band offsets on charge dynamics may provide essential insights for enhancing the photocatalytic efficiency of the MoS2/CdS system. Such findings would facilitate the development of more efficient MoS2/CdS systems specifically designed for hydrogen production, pollutant degradation, and other photocatalytic activities under visible light irradiation. Additionally, identifying the active species participating in the degradation of pollutants by photocatalysis under visible light irradiation is an area that has yet to be fully explored. Finding the specific reactive oxygen species (ROS)—including hydroxyl radicals (OH˙), superoxide anions (O2˙−), or hydrogen peroxide (H2O2)—facilitating the degradation process could reveal the mechanisms of photocatalytic processes. Assessing and delineating these species will enhance our comprehension of their specialized functions, hence facilitating the development of more precise and effective photocatalysts for environmental remediation and pollutant degradation applications.
The objective of this work is to synthesize heterostructure CdS/MoS2 nanocomposite (NC) photocatalysts using the hydrothermal method. The prepared photocatalysts were characterized with different techniques, such as X-ray diffraction (XRD), transmission electron microscopy (TEM), X-ray photoelectron spectroscopy (XPS), UV-vis diffuse reflectance spectroscopy and the surface area analyzer. The photocatalytic activity of the prepared photocatalysts was examined by degrading methyl orange dye under visible light and sunlight irradiation. To gain a better understanding of the relationship between the electronic characteristics and the photocatalytic activity of the MoS2/CdS photocatalyst, electrochemical and band alignment analyses were carried out. An active species trapping experiment using different scavengers was performed to unveil the role of active species in the photodegradation mechanism of dyes on MoS2/CdS nanocomposites (NCs).
2. Materials and methods
2.1. Chemicals and reagents
To synthesize CdS, MoS2, and MoS2/CdS NCs, analytical grade reagents were procured and utilized as received without any additional purification. The sodium sulfide used in the study was obtained from Merck (India), while cadmium acetate dihydrate and thiourea were purchased from Sigma Aldrich (India). Sodium molybdate dihydrate was procured from Sigma Aldrich (USA), and 80% thioglycolic acid was purchased from Finar (India). Ethanol was obtained from Sigma Aldrich (Germany), and methyl orange (MO) (C14H14N3NaO3S) was collected from Alfa Aesar (USA). The pH of the solutions was modified to the desired level by adding an appropriate quantity of diluted HNO3 and NH3 solutions.2.2. Synthesis of heterostructure MoS2/CdS NCs
The pure MoS2 and CdS nanoparticles (NPs) were synthesized by applying the hydrothermal method and described in detail in ESI.† The heterostructure MoS2/CdS NC photocatalysts were synthesized through the hydrothermal method using synthesized MoS2 and CdS. In a particular procedure, 0.01 grams of MoS2 and 0.19 grams of CdS were combined at a ratio of 5![[thin space (1/6-em)]](https://www.rsc.org/images/entities/char_2009.gif) :
:![[thin space (1/6-em)]](https://www.rsc.org/images/entities/char_2009.gif) 95 by weight. The mixture was then added to 50 milliliters of deionized water. The solution was agitated using a magnetic stirrer at ambient temperature for 30 minutes, followed by the addition of 2–3 drops of concentrated HNO3 to the mixture. Subsequently, it was transferred to a 100 mL Teflon-lined autoclave and was subjected to hydrothermal treatment at a temperature of 200 °C for 16 hours, followed by cooling to room temperature without any external intervention. The products were separated from the reaction mixture by centrifuging at 6000 rpm and washed several times with deionized water and ethanol to remove any impurities, unreacted reagents, or by-products. Finally, the washed products were then dried at 105 °C for 10 hours to remove any remaining moisture or solvents. Upon obtaining the NC material, it was labeled as 5 wt% MC and then stored for later use. To prepare MoS2/CdS NCs with different weight percentages of MoS2, the same procedure was used with the corresponding MoS2/CdS ratio. The resulting MoS2/CdS heterostructure photocatalysts are expected to possess different photocatalytic properties depending on the weight percentage of MoS2 in the NC material.
95 by weight. The mixture was then added to 50 milliliters of deionized water. The solution was agitated using a magnetic stirrer at ambient temperature for 30 minutes, followed by the addition of 2–3 drops of concentrated HNO3 to the mixture. Subsequently, it was transferred to a 100 mL Teflon-lined autoclave and was subjected to hydrothermal treatment at a temperature of 200 °C for 16 hours, followed by cooling to room temperature without any external intervention. The products were separated from the reaction mixture by centrifuging at 6000 rpm and washed several times with deionized water and ethanol to remove any impurities, unreacted reagents, or by-products. Finally, the washed products were then dried at 105 °C for 10 hours to remove any remaining moisture or solvents. Upon obtaining the NC material, it was labeled as 5 wt% MC and then stored for later use. To prepare MoS2/CdS NCs with different weight percentages of MoS2, the same procedure was used with the corresponding MoS2/CdS ratio. The resulting MoS2/CdS heterostructure photocatalysts are expected to possess different photocatalytic properties depending on the weight percentage of MoS2 in the NC material.
2.3. Characterizations of NCs
The crystallinity, phase, and crystal size of the synthesized nanoparticles were investigated by applying a Rigaku Smart Lab X-ray diffractometer (XRD) (Rigaku, SmartLab, Japan). This was done using the continuous scan mode within the 2θ range of 10–80°. The Scherrer's formula was employed to ascertain the mean crystallite size. A K-Alpha X-ray photoelectron spectrometer (XPS) from Thermo Scientific (Thermo Fisher Scientific, UK) was utilized to record the X-ray photoelectron spectra. The excitation was performed using a monochromatic X-ray (Kα: 1486.61 eV) source generated by an aluminum anode. The particle size, shape, morphology and crystallinity of the synthesized were analyzed using a Talos F200X G2 TEM instrument (Thermo Fisher), operated at 200 kV accelerating voltage, equipped with a field-emission gun. A drop of aqueous particle solution was deposited on copper TEM grids coated with carbon film to prepare the TEM samples. High-resolution (HRTEM) images and selected-area electron diffraction (SAED) patterns were obtained at a low electron dose in the range of 70–240 e A−2 for HRTEM and below 70 e A−2 for SAED patterns. The pore volume, pore size and specific surface area of the nanoparticles were measured using a porosimetry analyzer (ASAP 2020 Plus, Micromeritics Instrument Corporation, USA) by analyzing the nitrogen adsorption–desorption isotherms at 77 K. Before performing the measurements, the samples underwent degassing in an ultra-high vacuum at a temperature of 120 °C for 6 hours. The specific surface areas of the photocatalysts were determined using the Brunauer–Emmett–Teller (BET) equation. The pore size distributions were examined using the Barrett–Joyner–Halenda (BJH) method, which was applied to the adsorption branch of the nitrogen adsorption isotherm. The single-point BET method was employed to evaluate the porosity (pore volume) of the products using adsorption data. The band gap energy of the prepared nanoparticles was determined using UV-vis diffuse reflectance spectroscopy (DRS) at room temperature. The samples were scanned in the range of 400–800 nm using a UV-vis-NIR spectrometer (LAMDA 750, PerkinElmer, Inc., USA), with sintered PTFE serving as a standard reference. The determination of the point of zero charge (pHPZC) for 5 wt% MC NPs was determined using the pH drift method described in the ESI.†2.4. Photocatalytic study
The photocatalytic degradation efficiency of the as-synthesized MoS2/CdS NCs, pure MoS2, and pure CdS for the decomposition of methyl orange (MO) dye was examined under visible light irradiation. The visible light source used for the photocatalytic reaction was LUMATEC Superlite S 04 (Lumatec GmbH, Germany). The photocatalytic activity was also investigated in sun light where the daylight available from 10:00 am to 2:00 pm was utilized to conduct the experiment. The photocatalytic degradation studies were conducted in a 1 L Pyrex beaker, where 0.01 g of photocatalyst was added to 100 mL of dye solution with an initial concentration of 10 mg L−1. The pH of the solution was maintained at 3 during the experiments. The beaker was placed at a distance of 14.3 cm below the light source and continuously stirred at 250 rpm using a magnetic stirrer for uniform distribution of the photocatalyst throughout the solution. Prior to irradiation, the suspension was allowed to achieve adsorption/desorption equilibrium between the photocatalyst and dye by placing it in a dark environment for 10 min. At predetermined time intervals, 5 mL of the suspensions were collected, followed by separating the photocatalyst by centrifugation at a speed of 6000 rpm for 10 minutes. The concentration of the dye was then measured by observing the absorption maximum at 503 nm using a UV-visible spectrometer (UV-1650, SHIMADZU, Japan). To confirm the precision of the photocatalytic degradation studies, control experiments were performed in two scenarios: one with photocatalysts in the absence of light, and another without the addition of photocatalysts while the dye solution was being lighted. In addition, comparative tests were conducted utilizing commercially available TiO2 (Degussa, P-25) as a benchmark for photocatalysis under identical experimental conditions. The efficiency of MO dye degradation was determined by applying eqn (1):
 | (1) |
2.5. Electrochemical study
The photoluminescence (PL) properties of CdS, MoS2 and 5 wt% MC nanocomposites were evaluated at room temperature using a Shimadzu RF-5301PC fluorescence spectrophotometer (Japan), equipped with a 150 W xenon lamp. Based on spectrum data, an excitation wavelength of 238 nm was selected for CdS and 5 wt% MC to capture their most intense emission peaks, while MoS2 showed its most intense peak at 260 nm. For absorbance measurements, a 10 ppm solution of each sample was prepared, and the absorbance spectra were obtained using a UV-visible spectrophotometer. Electrochemical properties—including linear sweep voltammetry (LSV), electrochemical impedance spectroscopy (EIS) and Mott–Schottky (M–S) analyses—were performed using electrochemical workstations (Autolab PGSTAT128 N, Netherlands) in a 0.5 mol L−1 Na2SO4 aqueous solution. A glassy carbon (GC) disk electrode with a 0.07 cm2 geometric area served as the working electrode, a copper wire acted as the counter electrode, and an Ag/AgCl electrode was used as the reference electrode. The GC electrode surface was prepared following standard cleaning methods from the literature. The electrode surface was then modified by drop-casting an electrocatalyst ink prepared by sonicating a mixture of 1 mg of photocatalyst powder, 95 μL of ethanol, 95 μL of distilled water, and 10 μL of Nafion solution for 10–20 minutes. A 6 μL drop of this ink (CdS or MoS2 or CdS/MoS2) was applied onto the GC surface to prepare the GC-CdS, GC-MoS2 and GC-CdS/MoS2 electrodes, which were subsequently dried for several hours at room temperature before use in electrochemical measurements.3. Results and discussion
3.1. Characterization of synthesized NCs
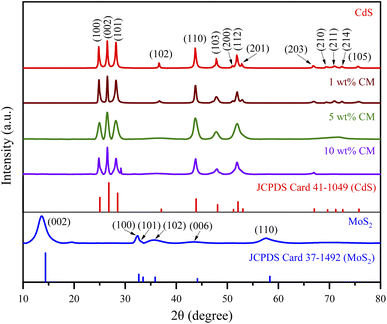
An XRD study was performed to investigate the crystallinity and crystal structure of the nanoparticles produced. Fig. 1 displays the XRD patterns of MoS2, CdS, and the heterostructure MoS2/CdS NCs. The XRD spectra of CdS are illustrated in Fig. 1. The primary diffraction peaks at 2θ = 24.7°, 26.5°, 28.3°, 36.6°, 43.8°, 47.8°, 51.0°, 51.9°, and 52.9° correspond to the (100), (002), (101), (102), (110), (103), (200), (112), and (201) crystal planes of wurtzite CdS, respectively, according to JCPDS card no. 411049.58–61 The XRD diffraction peaks of MoS2 shown in Fig. 1 at 2θ = 13.7, 32.5, 35.7, 43.5 and 57.6° correspond to the crystal planes (002), (100), (101), (006), and (110) of hexagonal MoS2, respectively, as indicated by the JCPDS card no. 371492.62–64Regardless of the MoS2 contents, the XRD patterns of MoS2/CdS NCs exhibited peaks similar to CdS nanoparticles, but no diffraction peaks associated with MoS2 were observed, which was attributed to the low concentration of MoS2 in the nanocomposites.59,65 The lack of additional peaks indicated that both MoS2 and CdS nanoparticles were of high purity. The crystallite size (D) of synthesized nanoparticles was calculated using Debye–Scherrer's formula  which incorporates the Scherrer constant (K = 0.9), wavelength of X-rays (λ), complete width at half maximum of the diffraction peak (β), and peak position (θ).66 The average crystallite sizes of various samples, including pure MoS2, CdS, 1 wt% MC, 5 wt% MC, and 10 wt% MC, were determined using the (002) plane and found to be 4.38, 37.53, 32.67, 14.75, and 3.49 nm, respectively. The inclusion of MoS2 in the heterostructure caused a decrease in the size of the CdS crystallites. The MoS2 and CdS have different lattice constants and crystal structures, and this mismatch in lattice structure can introduce strain or distortion at the interface, disrupting the regular arrangement of CdS atoms and reducing overall crystallinity.67 The smaller crystallite of CdS in MoS2/CdS was further confirmed by the broadening of the XRD peaks of MoS2/CdS.
The existence and chemical states of the elements in the MoS2/CdS nanocomposite were confirmed by XPS elemental analysis. The survey XPS spectra of the 5 wt% MC NC, as shown in Fig. 2(A), display peaks corresponding to the Cd, Mo, and S atoms. The O 1s peak at 532.1 eV indicates adsorbed H2O and O2 on the surface of the photocatalyst, while the C 1s peak located at 286.1 eV comes from adventitious carbons.68 The Cd 3d high-resolution spectrum in Fig. 2(B) offers valuable information on the binding energies and oxidation state of cadmium in pure CdS and the MoS2/CdS nanocomposite. The XPS peaks for pure CdS observed at 405.08 eV and 411.88 eV correspond to the binding energies of the Cd 3d5/2 and Cd 3d3/2 core levels, respectively. The splitting between these two peaks is 6.8 eV. The specific binding energies and the splitting observed in the XPS spectra confirm that cadmium is in the +2 oxidation state, which is typical for cadmium in CdS.47,59,69
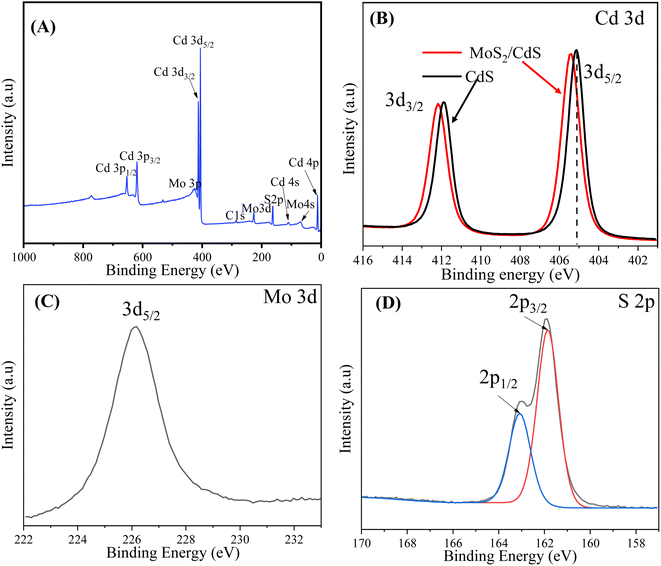 | ||
| Fig. 2 (A) Survey scan spectrum and high-resolution XPS spectra of (B) Cd 3d, (C) Mo 3d, and (D) S 2p energy core-levels of 5 wt% MC NCs. | ||
In addition, the high-resolution XPS peaks of Cd 3d in the 5 wt% MoS2/CdS composite are centered at 405.18 eV and 412.38 eV, corresponding to the 3d5/2 and 3d3/2 of Cd2+, respectively. The emission lines of Cd 3d in MoS2/CdS NC shift toward higher binding energy by 0.20 eV compared to pure CdS. This shift of core level peaks toward higher binding energy can be attributed to the interaction between MoS2 and CdS in the composite, supporting the formation of a heterostructure that aligns and modifies the electronic environment at the interface. Fig. 2(C) shows the high-resolution peak of Mo 3d. The peak centered at 228.50 eV corresponds to the Mo 3d5/2. This confirms the presence of molybdenum in the +4 oxidation state, typical of the MoS2 in the MoS2/CdS heterostructure.70 Notably, there is no obvious peak at 233.1 eV corresponding to the Mo6+ oxidation state, suggesting that Mo6+ is completely reduced into Mo4+. As depicted in Fig. 2(D), the S 2p emission is split into two asymmetric peaks at 161.9 eV for S 2p3/2 and 163.1 eV for S 2p1/2, indicating the presence of divalent sulfide ions (S2−). The energy separation of 1.2 eV between S 2p3/2 and S 2p1/2 is consistent with previous findings.68,71 The XPS analysis provides clear evidence of both MoS2 and CdS components in the MoS2/CdS NCs, confirming its composition and validating the photocatalyst's structure for efficient photocatalytic applications.
The morphological and structural information of the as-synthesized MoS2/CdS NC was obtained using a Transmission Electron Micrograph (TEM), as shown in Fig. 3. The TEM image of 5 wt% MC NC displayed in Fig. 3(A) reveals that the synthesized NC were found to be spherical or nearly spherical with an average size of 13.60 ± 0.50 nm. The crystalline nature of the synthesized nanoparticles was investigated from the lattice fringes of high-resolution TEM (HRTEM), as shown in Fig. 3(B) and (C). The clearly observable lattice fringes evidenced the highly crystalline nature of the prepared MC NCs. The rings with spots in the SAED pattern clearly indicate the polycrystalline nature of the prepared nanocrystals. The CdS lattice spacings were determined to be 0.358 nm and 0.334 nm as shown in the HRTEM image (Fig. 3(C)) corresponding to the (100) and (002) planes of hexagonal wurtzite structure of CdS, respectively. This crystallographic structure was further confirmed by the SAED pattern, as shown in Fig. 3(D). The well-defined ring in the SAED pattern suggested the poly crystalline nature of the synthesized nanoparticles. The rings in the SAED pattern correspond to the (100) and (002) planes with lattice spacings of 0.358 nm and 0.334 nm, respectively, confirming the hexagonal wurtzite phase in the CdS nanoparticles. In addition, a lattice spacing of 0.625 nm corresponds to the (002) plane of hexagonal MoS2. The surface morphology of the CdS, MoS2, and MoS2/CdS nanocomposites (NCs) was analyzed with FESEM, as shown in Fig. S1.† The FESEM image of CdS (Fig. S1(A)†) reveals a cauliflower-like arrangement of spherical CdS nanoparticles interspersed with elongated nanorods. In contrast, the MoS2 image (Fig. S1(B)†) exhibits a lamellar, nanoflower-like structure characteristic of MoS2 nanoparticles. The FESEM image of 5 wt% MoS2/CdS NCs (Fig. S1(C)†) shows a significant reduction in the assembly of CdS structures, a transformation that is favorable for enhancing photocatalytic degradation efficiency by promoting better dispersion and increasing the active surface area in the composite.
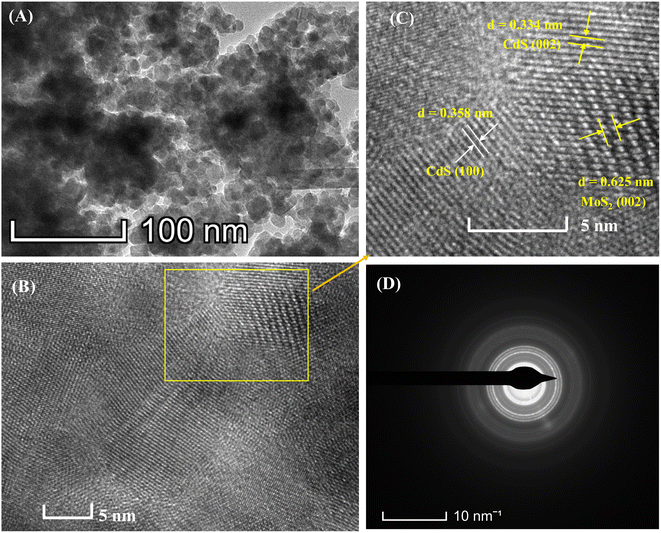 | ||
| Fig. 3 (A) TEM image, (B) HRTEM image, (C) enlarged view of the HRTEM image and (D) SAED pattern of 5 wt% MC NCs. | ||
It is essential to investigate the surface area of the synthesized photocatalysts, as a high surface area is a crucial criterion for the efficacy of a photocatalyst in photocatalytic processes.72 Fig. 4 displays the N2 adsorption–desorption isotherms and pore size distribution (inset) of MoS2/CdS NCs and pure CdS. It is evident from Fig. 4 that the synthesized photocatalysts exhibit isotherms characteristic of type IV, a common feature observed in mesoporous materials.16,73 As per the IUPAC classification, the shape of the hysteresis loop corresponds to the H2 type, which suggests that the solids have ink-bottle-shaped pores.
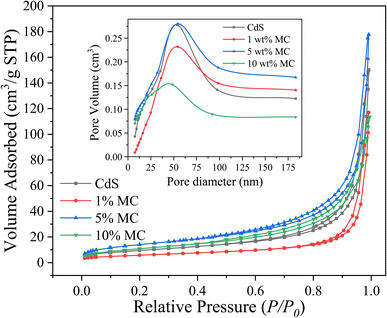 | ||
| Fig. 4 N2 adsorption–desorption isotherms and pore diameter distribution curve (inset) of the synthesized nanoparticles. | ||
These pores are likely made up of aggregates or agglomerates of spherical particles.74 The change in shape and position of hysteresis loops with an increase in MoS2 content indicated a variation in pore size and pore volume. Table 1 provides a summary of the physical characteristics, including pore volume, pore diameter, and BET surface area, for comparison. Pure CdS has a BET surface area of 34.92 m2 g−1, while 5 wt% MC NC has an enhanced surface area of 51.81 m2 g−1. However, beyond this point, the surface area decreases drastically. This reduction in the BET surface area could be attributed to the blockage of the mesopore dimension caused by the deposited MoS2 particles.16 The highest specific pore volume was observed in the 5 wt% MC NC possibly due to the increase in crystallinity of CdS nanoparticle.73 If the CdS nanoparticles are more crystalline, they might create more or larger pores within the composite material due to their better-defined structures. This could be due to less particle aggregation or more efficient packing in certain ways, leading to increased void spaces. The mean pore diameter decreased as the concentration of MoS2 in the nanocomposites increased.
| Nanomaterial | Surface area (m2 g−1) | Pore volume (cm3 g−1) | Average pore diameter (nm) |
|---|---|---|---|
| a Surface areas, mean pore diameters, and pore volumes were determined using the BET technique, the BJH (adsorption) analysis and the single-point approach, respectively. | |||
| CdS | 34.92 | 0.22 | 26.40 |
| 1 wt% MC | 21.12 | 0.17 | 19.12 |
| 5 wt% MC | 51.81 | 0.26 | 21.38 |
| 10 wt% MC | 40.68 | 0.17 | 16.41 |
The optical properties of semiconductors, including their bandgap, are crucial in determining their effectiveness as photocatalysts for organic dye degradation. However, the bandgap value of a semiconductor can be influenced by various factors, such as crystallinity, nanoparticle grain size, crystal defects, impurities, and oxygen deficiencies.75 Additionally, introducing metal or metal ions and combining them with other photoactive materials can alter the bandgap.76 The current study aimed to examine the impact of MoS2 nanoparticles on the optical bandgap of CdS nanoparticles under various incorporation modes. To achieve this, UV-Vis DRS analysis was utilized, and the results are presented in Fig. 5. This allowed us to evaluate the alterations in the optical characteristics of CdS nanoparticles upon the incorporation of MoS2 nanoparticles and compare them to the behavior of pure CdS nanoparticles. The diffuse reflectance spectra were analyzed using the Kubelka–Munk theory,77 as presented in eqn (2):
 | (2) |
| (F(R) × hv)2 = A(hν − Eg), | (3) |
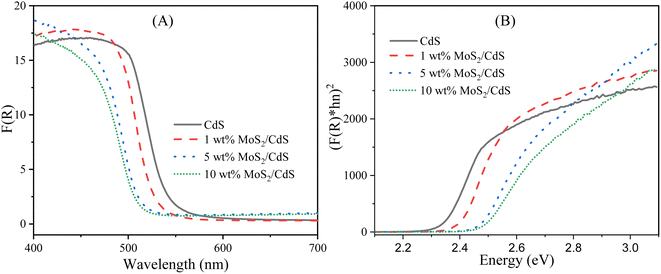 | ||
| Fig. 5 (A) F(R) at different wavelengths and (B) [F(R)hν]1/2 vs. photon energy plot for synthesized photocatalysts. | ||
The point of zero charge (pHPZC) is a critical parameter, denoting the pH at which a material's surface achieves electrical neutrality, holding particular importance in degradation studies. Specifically, pH plays a pivotal role in dye adsorption, a key factor influencing the degradation of organic dyes on nanocomposite surfaces. Based on the graphical representation in Fig. S3,† the catalyst's pHpzc is observed to be about 6.2, corresponding to the point where the ΔpH value is zero (i.e., pHf = pHi) in the graph depicting ΔpH versus initial pH. When the pH of a solution is less than the point of zero charge (pHpzc) of a material, the surface of the material tends to become positively charged. This positively charged surface can attract and interact with anionic (negatively charged) dye molecules, making it favorable for the adsorption and degradation of these dyes. In the context of catalytic degradation of anionic dyes, maintaining the pH below the pHpzc can enhance the efficiency of the degradation process. This is because the electrostatic attraction between the positively charged surface and the anionic dye molecules promotes the adsorption of the dyes onto the surface, which is often a crucial step before their degradation.79
3.2. Photocatalytic activity investigation of MoS2/CdS NCs
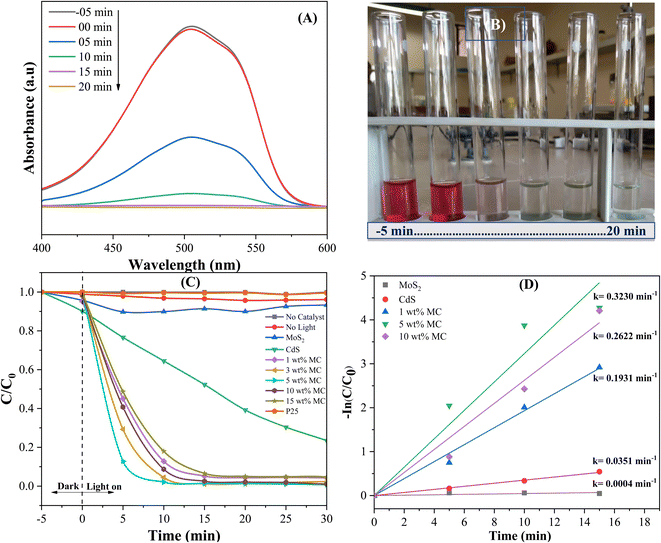
To evaluate the photocatalytic effectiveness of the MoS2/CdS NCs, the model dye methyl orange (MO) was degraded under visible light irradiation. Furthermore, to compare the degradation performance of the MoS2/CdS NCs, control experiments were conducted under irradiation without the presence of a photocatalyst, as well as in the absence of irradiation with the photocatalyst (adsorption study). The adsorption study was conducted in the dark for 100 minutes prior to initiating the photocatalytic reaction to achieve adsorption–desorption equilibrium, as shown in Fig. S4.† The results indicate that adsorption on the photocatalysts remained minimal throughout this period. This finding indicates that the photocatalyst's surface does not significantly adsorb the MO dye under the experimental conditions used, suggesting that the observed photocatalytic activity can be attributed primarily to photocatalytic reactions rather than adsorption. Because the change in adsorption of MO on the photocatalyst surface was insignificant over the adsorption–desorption equilibrium time, a dark study was performed for 10 minutes for subsequent photocatalytic degradation experiments. The photocatalytic degradation efficiency of the as-prepared MoS2/CdS NCs for the degradation of MO was compared with the degradation efficiency of pure MoS2, CdS, and commercial TiO2 P25 used as a reference. The preliminary study shown in Fig. 6(A) and (B) suggests that the MoS2/CdS NCs are highly effective in degrading MO under visible light irradiation. The maximum absorption peak of MO at 503 nm gradually decreased with time and disappeared completely after 15 min of visible light irradiation, signifying that the MO dye has been almost entirely degraded or mineralized in the presence of MoS2/CdS NCs. This result was also confirmed by the change in color over time, as shown in Fig. 6(B). Fig. 6(C) demonstrates the degradation efficiencies of various photocatalysts by a plot of C/C0 vs. t. Here, C0 represents the starting concentration of MO, while C represents the concentration of MO at any given time, t. Blank experiments demonstrate that MO cannot undergo decomposition without the aid of a photocatalyst when exposed to visible light. Additionally, a series of experiments were conducted using MoS2/CdS photocatalysts with varying amounts of MoS2 to examine the effect of MoS2 on photocatalytic activity. The results indicate that MoS2/CdS NCs exhibit superior degradation efficiency compared to pure CdS and pure MoS2.Particularly, the 5 wt% MC NC demonstrates the highest degradation performance among all photocatalysts tested. Conversely, commercial P25 fails to degrade MO over time under visible light irradiation. The degradation efficiency, defined as (1 − C/C0) × 100%, of 1 wt% MC, 5 wt% MC, 10 wt% MC, pure CdS, and pure MoS2 after 10 minutes of photocatalytic reaction were found to be 86%, 98%, 88%, 28%, and 6%, respectively. Excess MoS2 beyond 5 wt% might accumulate on the active surface of CdS, obstructing photocatalytic activation of CdS and decreasing its photocatalytic degradation efficiency.80
The photocatalytic degradation reactions through photocatalysis can be quantitatively described by first-order kinetics, which follows the equation ln(C/C0) = −kt, where t denotes the reaction time and k represents the reaction rate constant.59 By plotting ln(C/C0) against t, a linear relationship can be observed, with the slope of the line corresponding to the reaction rate constant, k. The results depicted in Fig. 6(D) clearly indicate that the 5 wt% MC NC photocatalyst displays superior degradation efficacy, with a degradation rate constant of 0.323 min−1, which is 9.2 times greater than that of CdS. Table 2 presents a comparative analysis of the degradation efficiency of the various photocatalysts used for organic dye degradation under visible light. The data presented in Table 2 clearly shows that the prepared MoS2/CdS NC displayed a considerably high rate of MO degradation, highlighting its potential for effectively decomposing harmful organic compounds in environmental remediation applications.
| Nanocomposites | Synthesis method | Target dye | Catalyst loading | Time (min) | Degradation (%) | References |
|---|---|---|---|---|---|---|
| CeO2/CuO | Thermal decomposition | Methylene blue | 1 g L−1 | 210 | 70 | 81 |
| ZnO/g-C3N4 | Chemical corrosion | Methyl orange | — | 150 | 92 | 82 |
| CdS/CeO2 | Hydrothermal | Rhodamine B | 0.4 g L−1 | 48 | 97 | 83 |
| SnO2/MoS2 | Sonochemical | Methylene blue | 20 mL L−1 | 120 | 59 | 84 |
| N doped g-C3N4 | Calcination | Phenol | 1 g L−1 | 180 | 70 | 85 |
| MoS2/ZnO | Microwave | Methylene blue | 1 g L−1 | 60 | >95 | 86 |
| g-C3N4/V2O5 | Sonochemical | Rhodamine B | 0.75 g L−1 | 60 | 93 | 87 |
| CeO2/alumina | Calcination | Methyl orange | 0.625 g L−1 | 90 | 92 | 88 |
| MoS2/CdS | Hydrothermal | Methyl orange | 0.1 g L−1 | 10 | 98 | Present work |
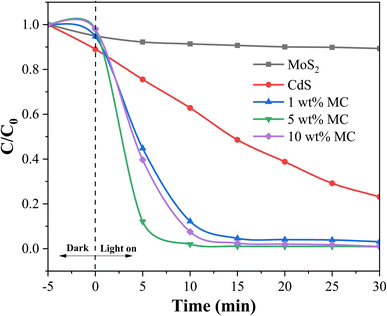
To provide evidence of the photocatalyst's efficacy in natural light, degradation was also observed under solar radiation. Fig. 7 displays the photocatalytic degradation of MO on heterostructure MoS2/CdS NCs containing different percentages of MoS2 under sunlight irradiation. As shown in Fig. 7, regardless of the MoS2 content in the NCs, the MoS2/CdS NCs demonstrated higher photocatalytic degradation efficiency for MO compared to pure MoS2 and pure CdS. Among the different compositions, the NC with 5 wt% MoS2 showed the highest degradation efficiency, achieving 98.10% degradation within 10 minutes of sunlight exposure. It was observed that under sunlight, the MoS2/CdS NCs exhibited a degradation efficiency that was slightly higher than that observed under visible light irradiation. The slightly higher degradation efficiency of MoS2/CdS NCs under sunlight compared to visible light irradiation can be attributed to the broader spectrum of sunlight, which includes UV light. This additional UV component can enhance the photocatalytic activity, leading to more efficient degradation of pollutants. The improved photocatalytic degradation performance of the MoS2/CdS NCs was attributed to the enhanced charge separation and reduced recombination of photo-generated charge carriers afforded by the heterojunction.
The improvement in charge separation and the reduction in recombination of photo-generated charge carriers were further validated through photoluminescence (PL) spectra and electrochemical analyses, including linear sweep voltammetry (LSV), electrochemical impedance spectroscopy (EIS), and Mott–Schottky (M–S) measurements. The PL and EIS LSV M–S plots of the synthesized samples are shown in Fig. 8. Fig. 8(A) presents the photoluminescence (PL) spectra of CdS and the 5 wt% MoS2/CdS NCs. Fig. 8(A) shows that the emission peak position of the 5 wt% MoS2/CdS NCs shifted slightly to a lower wavelength, suggesting interaction at the interface between MoS2 and CdS nanoparticles. This change signifies that the electrical environment surrounding the CdS is altered by the presence of MoS2, potentially leading to enhanced charge separation and less recombination of electron–hole pairs.48 The strong emission peak at 450–510 nm is a characteristic of CdS emission (centered around 478 nm). Notably, the 5 wt% MoS2/CdS composite displays a lower PL intensity than pure CdS, suggesting enhanced charge transfer and effective separation of photogenerated electron–hole pairs. Nyquist plots for CdS, MoS2, and the 5 wt% MoS2/CdS composite were recorded over a frequency range of 0.1–1000 Hz with a 10 mV amplitude (Fig. 8(B)). As illustrated in Fig. 8(B), the 5 wt% MoS2/CdS NCs exhibited a reduced semicircle size in the high-frequency region compared to the CdS and MoS2 nanoparticles. This smaller semicircle in the Nyquist plot indicates a lower charge transfer resistance at the interface of the 5 wt% MC NCs, suggesting enhanced electron mobility and improved charge separation efficiency. In addition, a lower value of onset potential (−0.08 V) for wt% MC in LSV (shown in Fig. 8(C)) compared to −0.11 and −0.23 V for MoS2 and CdS, respectively, further confirmed the good alignment of energy bands, facilitating effective charge transfer and separation.
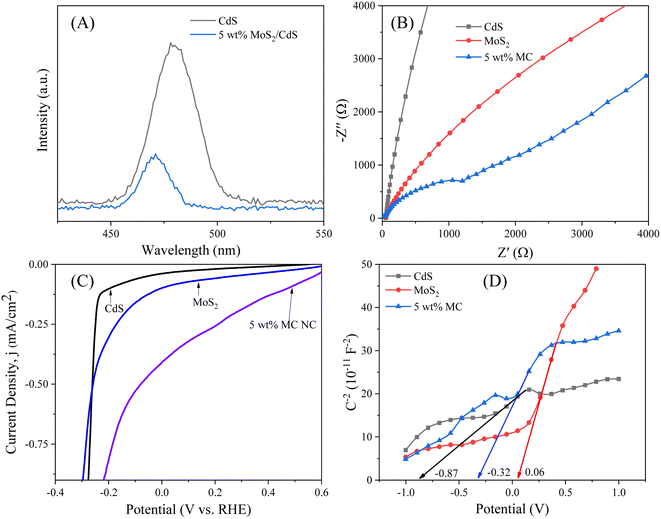 | ||
| Fig. 8 (A) PL spectra of CdS and 5 wt% MoS2/CdS NCs, (B) EIS, (C) LSV and (D) Mott–Schottky plot of CdS, MoS2 and 5 wt% MoS2/CdS NCs. | ||
The role of solution pH is a crucial factor in the process of breaking down organic dyes by photocatalysis. The pH of the solution can alter the surface charge of the photocatalyst, leading to either increased or decreased adsorption of dye molecules. Therefore, controlling and optimizing the solution pH is a key factor in the design and optimization of photocatalytic processes for the degradation of organic dyes. Fig. S5† demonstrates the impact of pH on the photocatalytic degradation performance of 5 wt% MC NCs for the degradation of MO dye. Fig. S5† shows that the degradation of MO dye on MoS2/CdS photocatalyst was favorable in acidic mediums and dramatically decreased in basic mediums. At lower pH (pH < pHpzc), positive charges were developed on the photocatalyst's surface, which facilitated the adsorption of anionic MO dye and thus increased degradation efficiency. Conversely, at higher pH (pH > pHpzc), reduced adsorption of MO dye occurred because of the electrostatic repulsion between the negatively charged nanocomposites (NCs) and the anionic dye, resulting in a significant decrease in degradation efficiency.74,89 The subsequent experiments were conducted at a pH of 3. The effect of other factors, including catalyst dosage and concentration of dyes, on photocatalytic activity are depicted in Fig. S6 and S7 (in ESI†), respectively. Fig. S6† shows that the rate of photocatalytic degradation of MO increased significantly as the photocatalyst dosage was increased up to 1 g L−1. Beyond this concentration, additional catalyst resulted in reduced degradation efficiency likely due to excessive particles blocking light absorption or forming agglomerates, which reduced the active surface area.90–92 Conversely, as illustrated in Fig. S7,† an increase in dye concentration results in lower photocatalytic efficiency. This reduction in degradation efficiency was attributed to the “light shielding” effect, where the higher dye concentration absorbs more light, which reduces the availability of photons for reactive species generation, thereby lowering overall degradation efficiency.91–93
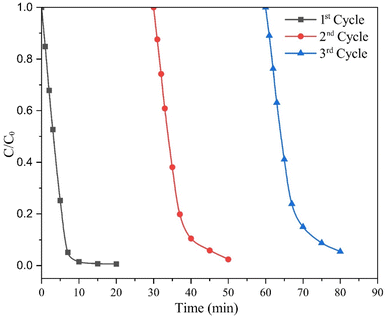
The practical application of catalysts in different chemical processes depends substantially on their stability and reusability. In this study, the reusability of the catalyst was assessed through three consecutive cycles of photodegradation of the MO dye solution. After completing each cycle, the catalyst was recovered via filtration and then dried at 105 °C for 3 hours. The results illustrated in Fig. 9 show that the 5 wt% MC NCs achieve degradation efficiencies of 99.31%, 94.23%, and 91.27% after 15 minutes of irradiation during the first, second, and third cycles, respectively. The slight decrease in degradation efficiency observed in the third cycle can be attributed to the loss of the catalyst during the separation process. Each separation step, such as centrifugation, can result in a small amount of catalyst being lost, reducing the overall quantity available for subsequent cycles. This minor reduction in catalyst concentration affects the photocatalytic activity, slightly lowering the degradation efficiency in later cycles. These findings suggest that the catalyst maintained high efficiency over multiple cycles, with only a slight decrease in performance. This demonstrates the stability and reusability of the MC NCs, making them a promising candidate for practical applications where long-term use and consistent performance are essential.
To confirm the stability, comparative characterization data on the morphology and structure of the catalyst before and after cycling use were studied. Specifically, Scanning Electron Microscopy (SEM) and X-ray Diffraction (XRD) were employed to analyze morphological changes and to assess structural integrity, respectively. The SEM images of 5 wt% MC NCs presented in Fig. S1(A) and (B)† reveal no noticeable change in morphology after successive use. X-ray diffraction (XRD) analysis is a powerful technique for evaluating the stability of photocatalysts. The XRD patterns of 5 wt% MC NCs before and after three successive uses of photocatalytic degradation are displayed in Fig. S8.† This comparison revealed no noticeable changes in peak positions and shapes, indicating that the crystalline structure of the 5 wt% MC NCs remains intact even after repeated photocatalytic applications. This finding further supports the structural integrity and reusability of the nanocomposites in photocatalytic applications.
3.3. Plausible photocatalytic degradation mechanism
The enhanced degradation efficiency observed in MoS2/CdS NCs can be explained by the favorable band alignment at the MoS2/CdS interface, which promoted efficient charge separation and transfer. To understand the semiconductor types and the band positions of MoS2 and CdS, Mott–Schottky (M–S) analysis was employed. Fig. 8(D) depicts the Mott–Schottky plots of MoS2, CdS and MoS2/CdS NCs. As illustrated in Fig. 8(D), the positive slope in the linear region of the plot indicates that both MoS2 and CdS are n-type semiconductors. The flat band potentials (EFB) of MoS2, CdS and MoS2/CdS were determined using the tangent of the tangent lines of the M–S plot. The estimated EFB values of MoS2, MoS2/CdS and CdS were found to be –0.06 V, −0.36 V and −0.87 V, respectively. All electrochemical potentials are reported versus the reversible hydrogen electrode (RHE) at pH 7. By combining the flat band potential (EFB) values with the respective bandgaps (Eg) obtained from UV-vis/NIR spectroscopy, we determined the band-edge potentials for each catalyst. The band gap energy (Eg) of CdS and MoS2 was calculated to be 2.36 eV and 1.80 eV, respectively. To construct the band alignment diagrams, we assumed that the EFB level was positioned close to the conduction band (CB) minimum for the heavily doped n-type semiconductors. Therefore, the valence band (VB) potential (EVB) was calculated by adding the bandgap energy (Eg) to the EFB level. The calculated EVB values for MoS2 and CdS were found to be 1.75 and 1.49 eV, respectively. Based on the calculated band edge positions, the band alignment, photogenerated charge separation and photocatalytic degradation mechanism at the interface of CdS/MoS2 NCs under visible or sunlight irradiation are schematically shown in Fig. 10. As shown in Fig. 10, there are distinct valence band (VB) and conduction band (CB) offsets at the interface between MoS2 and CdS nanoparticles in the MoS2/CdS NCs. Upon illumination with visible light, electrons in the valence bands of both MoS2 and CdS are excited to their respective conduction bands, creating an equal number of holes in the valence bands. Given that the CB edge and VB edge of CdS are more negative than those of MoS2, a directional flow of charge carriers occurs: the photogenerated electrons in the CB of CdS transfer to the CB of MoS2, while the holes in the VB of MoS2 migrate to the VB of CdS.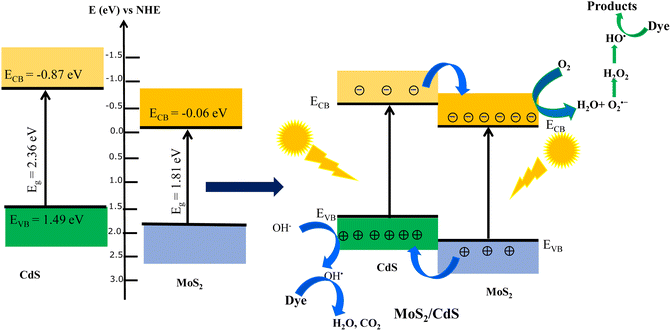 | ||
| Fig. 10 Schematic energy band alignment and charge separation at the interface of the MoS2/CdS heterojunction. | ||
Thus, the photogenerated electrons and holes are efficiently separated due to their directional transfer to MoS2 and CdS, respectively. This vectorial transfer ensures that charge carriers with sufficiently long lifetimes are available to participate in redox reactions, thereby significantly reducing the recombination of photogenerated charge carriers. This enhanced separation and prolonged carrier lifetime contribute to the increased photocatalytic efficiency of the system. The process of photocatalytic degradation of MO dye on heterostructure CdS/MoS2 NCs can be elucidated using the following sequence of chemical reactions:71,74
| MoS2/CdS + hν → e−(MoS2) + h+(CdS) |
| h+(CdS) + OH− → OH˙(CdS) |
| e−(MoS2) + O2 → O2˙−(MoS2) |
| HO2˙(MoS2) + H2O → H2O2(MoS2) + OH˙(MoS2) |
| H2O2(MoS2) → 2OH˙(MoS2) |
| OH˙(CdS) + MO → degradation products (CO2, H2O) |
| OH˙(MoS2) + MO → degradation products (CO2, H2O). |
The holes present in the valence band of cdS interact with water or hydroxyl ions (OH−) that are attached to the catalyst's surface, leading to the production of hydroxyl radicals (OH˙). However, the electrons present in the conduction band of MoS2 interact with adsorbed oxygen (O2), resulting in the formation of superoxide radical anions (O2˙−). These anions further react with water (H2O), producing hydroxyl radicals (OH˙). These OH˙ species function as potent oxidizing agents, causing the complete mineralization of organic compounds, such as the MO dye, which ultimately leads to the formation of harmless compounds, such as CO2, H2O, and other inorganic molecules.
The active species, such as hydroxyl radicals (˙OH), superoxide anions (O2−), and electrons/holes, are key drivers in photocatalytic reactions. They facilitate the redox processes that lead to the breakdown or transformation of various substances. Understanding which species dominate the photodegradation process provides deeper insights into the mechanisms driving the degradation process, leading to more efficient designs for a wide range of applications. Active species trapping experiments were carried out to elucidate the role of different reactive species in photocatalytic processes, such as the photodegradation of dyes. In trapping experiments, four common selective scavengers, ethylenediaminetetraacetic acid (EDTA), silver nitrate (AgNO3), p-benzoquinone (p-BQ) and methanol, were introduced into the photocatalytic system to “trap” or neutralize hole, electron, superoxide anion radical, and hydroxyl radical, respectively.94–96 In every experiment, 0.01 g of 5 wt% MC NC was added to 100 mL of 10 ppm MO dye solution at pH 3. The scavenger-to-nanocomposite molar ratio for EDTA, AgNO3, and p-BQ was 1![[thin space (1/6-em)]](https://www.rsc.org/images/entities/char_2009.gif) :
:![[thin space (1/6-em)]](https://www.rsc.org/images/entities/char_2009.gif) 1, and the volume of methanol was 2 mL. Fig. 11(A) depicts the effect of scavenger addition on the photocatalytic degradation of MO dye. As shown in Fig. 10(A), no significant reduction in degradation efficiency was observed upon the addition of EDTA, AgNO3 and methanol. In contrast, the addition of p-BQ resulted in a considerable decrease in photodegradation efficiency, which suggests that the superoxide anion radical plays the most significant role in photocatalytic degradation under visible light illumination. This finding confirmed that electron transfer to oxygen and the subsequent formation of superoxide anions (O2−) is a crucial aspect of the mechanism behind the photocatalytic degradation of methyl orange (MO) dye on CdS/MoS2 NCs.
1, and the volume of methanol was 2 mL. Fig. 11(A) depicts the effect of scavenger addition on the photocatalytic degradation of MO dye. As shown in Fig. 10(A), no significant reduction in degradation efficiency was observed upon the addition of EDTA, AgNO3 and methanol. In contrast, the addition of p-BQ resulted in a considerable decrease in photodegradation efficiency, which suggests that the superoxide anion radical plays the most significant role in photocatalytic degradation under visible light illumination. This finding confirmed that electron transfer to oxygen and the subsequent formation of superoxide anions (O2−) is a crucial aspect of the mechanism behind the photocatalytic degradation of methyl orange (MO) dye on CdS/MoS2 NCs.
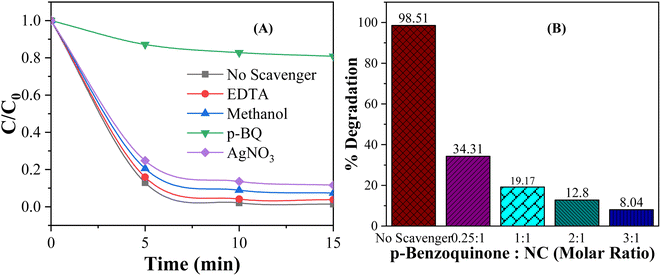 | ||
| Fig. 11 Effect of (A) different scavengers and (B) the p-BQ to NC molar ratio on the degradation of MO dye by the CdS/MoS2 NC under visible light for 15 min. | ||
Fig. 11(B) shows the effect of scavenger p-QB to CdS/MoS2 NCs molar ratio on the degradation efficiency. As shown in Fig. 10(B), the degradation efficiency decreased with increasing the p-QB concentration while keeping the molar concentration of NCs constant. When the concentration of p-BQ is increased to three times that of the NC, the degradation rate drops significantly to just 8.04%. The decrease in degradation efficiency was due to the deactivation of more superoxide anion radicals (O2−) trapped by p-BQ, resulting in a sharp decline in photodegradation efficiency. This finding also confirmed that O2− was the dominant species responsible for driving the photocatalytic degradation of MO.
4. Conclusion
The heterostructure MoS2/CdS NC photocatalysts were successfully synthesized by applying the hydrothermal technique. The XRD analysis revealed the expected hexagonal structures for CdS and MoS2, while elemental analysis confirmed the presence of nanoparticles of both CdS and MoS2. Irrespective of MoS2 content, the heterostructure MoS2/CdS NC demonstrated superior degradation efficiency compared to pure CdS, MoS2, and commercial TiO2 P25 in the degradation of methyl orange in an acidic solution under solar light and visible light irradiation. The enhanced degradation activity was attributed to efficient charge carrier separation, which effectively suppressed electron–hole pair recombination, as evidenced by PL and electrochemical analyses. Active species trapping experiments proved that the formation of superoxide anions was an essential step in the photocatalytic degrading of MO dye on MoS2/CdS NC photocatalysts under visible light irradiation. In addition, the ability to reuse the catalyst multiple times without a significant loss in activity evidenced its stability, reusability, and reproducibility. The demonstrated stability and reproducibility of these heterostructure photocatalysts appropriately open up new possibilities for their use in photocatalytic hydrogen production and other fields outside dye degradation.Data availability
The data supporting this article have been included as part of the ESI.†Conflicts of interest
The authors declare that they have no known competing financial interests or personal relationships that could have appeared to influence the work reported in this paper.Acknowledgements
The financial support from the University Grants Commission, Bangladesh with Grant No. 37.01.0000.073.11.002.23.349 Dated: April 30, 2023 for conducting this research work is highly appreciated. The author would also like to thank the Centre of Excellence at SUST for providing instrumental support for the characterization of the photocatalysts.References
- V. K. Garg, R. Kumar and R. Gupta, Dyes Pigm., 2004, 62, 1–10 CAS.
- E. Hagan and J. Poulin, Heritage Sci., 2021, 9, 33 CrossRef.
- R. Kishor, D. Purchase, G. D. Saratale, R. G. Saratale, L. F. R. Ferreira, M. Bilal, R. Chandra and R. N. Bharagava, J. Environ. Chem. Eng., 2021, 9, 105012 CAS.
- E. Oguz and B. Keskinler, Colloids Surf., A, 2005, 268, 124–130 CrossRef CAS.
- J. Shu, Z. Wang, Y. Huang, N. Huang, C. Ren and W. Zhang, J. Alloys Compd., 2015, 633, 338–346 CrossRef CAS.
- M. Noor, F. Sharmin, M. A. A. Mamun, S. Hasan, M. A. Hakim and M. A. Basith, J. Alloys Compd., 2022, 895, 162639 CrossRef CAS.
- M. T. Uddin, Y. Sultana and M. A. Islam, J. Sci. Res., 2016, 8, 399–411 CrossRef CAS.
- M. T. Uddin, Y. Nicolas, C. Olivier, L. Servant, T. Toupance, S. Li, A. Klein and W. Jaegermann, Phys. Chem. Chem. Phys., 2015, 17, 5090–5102 RSC.
- M. Tamez Uddin, M. Rukanuzzaman, M. Maksudur Rahman Khan and M. Akhtarul Islam, J. Environ. Manage., 2009, 90, 3443–3450 CrossRef.
- I. Oller, S. Malato and J. A. Sánchez-Pérez, Sci. Total Environ., 2011, 409, 4141–4166 CrossRef CAS.
- K. Paździor, L. Bilińska and S. Ledakowicz, Chem. Eng. J., 2019, 376, 120597 CrossRef.
- M. C. Collivignarelli, A. Abbà, M. Carnevale Miino and S. Damiani, J. Environ. Manage., 2019, 236, 727–745 CrossRef CAS.
- H. He, Y. Luo, Z. Luo and C. Yu, Prog. Chem., 2019, 31, 561–570 CAS.
- Y. Anjaneyulu, N. Sreedhara Chary and D. Samuel Suman Raj, Rev. Environ. Sci. Biotechnol., 2005, 4, 245–273 CrossRef CAS.
- J. W. Lee, S. P. Choi, R. Thiruvenkatachari, W. G. Shim and H. Moon, Dyes Pigm., 2006, 69, 196–203 CrossRef CAS.
- M. T. Uddin, Y. Nicolas, C. Olivier, T. Toupance, M. M. Müller, H. J. Kleebe, K. Rachut, J. Ziegler, A. Klein and W. Jaegermann, J. Phys. Chem. C, 2013, 117, 22098–22110 CAS.
- M. T. Uddin, Y. Nicolas, C. Olivier, T. Toupance, L. Servant, M. M. Müller, H. J. Kleebe, J. Ziegler and W. Jaegermann, Inorg. Chem., 2012, 51, 7764–7773 CAS.
- A. O. Ibhadon and P. Fitzpatrick, Catalysts, 2013, 3, 189–218 CAS.
- S. Ahmed, M. G. Rasul, W. N. Martens, R. Brown and M. A. Hashib, Water, Air, Soil Pollut., 2011, 215, 3–29 CrossRef CAS.
- S. N. Ahmed and W. Haider, Nanotechnology, 2018, 29, 342001 CrossRef.
- H. He, J. Li, C. Yu and Z. Luo, Sustainable Mater. Technol., 2019, 22, e00127 CrossRef CAS.
- H. Zhang, Y. Gao, S. Meng, Z. Wang, P. Wang, Z. Wang, C. Qiu, S. Chen, B. Weng and Y. M. Zheng, Adv. Sci., 2024, 11, 2400099 CrossRef CAS.
- H. Huang, J. Zhao, B. Weng, F. Lai, M. Zhang, J. Hofkens, M. B. J. Roeffaers, J. A. Steele and J. Long, Angew. Chem., Int. Ed., 2022, 61, e202204563 CrossRef CAS PubMed.
- M. T. Uddin, J. Mondal, S. Hossain and M. Z. Bin Mukhlish, Indian J. Chem. Technol., 2023, 30, 320–330 CAS.
- M. T. Uddin, M. E. Hoque and M. Chandra Bhoumick, RSC Adv., 2020, 10, 23554–23565 RSC.
- M. T. Uddin, Y. Nicolas, C. Olivier, L. Servant, T. Toupance, S. Li, A. Klein and W. Jaegermann, Phys. Chem. Chem. Phys., 2015, 17, 5090–5102 RSC.
- H. He, J. Jiang, Z. Luo, D. Li, M. Shi, H. Sun, J. Chen, C. Chen, B. Deng and C. Yu, Colloids Surf., A, 2023, 667, 131357 CrossRef CAS.
- T. Liu, Y. Li, H. Sun, M. Zhang, Z. Xia and Q. Yang, Jiegou Huaxue, 2022, 41, 2206055–2206061 CAS.
- N. Thomas, S. Mathew, K. M. Nair, K. O’Dowd, P. Forouzandeh, A. Goswami, G. McGranaghan and S. C. Pillai, Mater. Today Sustain., 2021, 13, 100073 Search PubMed.
- A. Wu, C. Tian, Y. Jiao, Q. Yan, G. Yang and H. Fu, Appl. Catal., B, 2017, 203, 955–963 CrossRef CAS.
- L. Korala, J. R. Germain, E. Chen, I. R. Pala, D. Li and S. L. Brock, Inorg. Chem. Front., 2017, 4, 1451–1457 RSC.
- J. A. Nasir, Z. U. Rehman, S. N. A. Shah, A. Khan, I. S. Butler and C. R. A. Catlow, J. Mater. Chem. A, 2020, 8, 20752–20780 RSC.
- H. Anwer, A. Mahmood, J. Lee, K. H. Kim, J. W. Park and A. C. K. Yip, Nano Res., 2019, 12, 955–972 CrossRef CAS.
- J. Chen, F. Qiu, W. Xu, S. Cao and H. Zhu, Appl. Catal., A, 2015, 495, 131–140 CrossRef CAS.
- V. Hasija, P. Raizada, V. K. Thakur, A. A. Parwaz Khan, A. M. Asiri and P. Singh, J. Environ. Chem. Eng., 2020, 8, 104307 CrossRef CAS.
- Z. Li, X. Meng and Z. Zhang, J. Photochem. Photobiol., C, 2018, 35, 39–55 CrossRef CAS.
- J. Pan, Z. Wang, Q. Chen, J. Hu and J. Wang, Nanoscale, 2014, 6, 13565–13571 RSC.
- Y. E. Du, X. Niu, X. He, K. Hou, H. Liu and C. Zhang, Molecules, 2021, 26, 603 CrossRef.
- H. J. Wang, G. G. Yang, S. S. Wu, Z. F. Meng, J. M. Zhang, Y. Cao and Y. P. Zhang, Sci. Total Environ., 2021, 784, 147221 CrossRef CAS PubMed.
- S. Yuvaraj, A. C. Fernandez, M. Sundararajan, C. S. Dash and P. Sakthivel, Ceram. Int., 2020, 46, 391–402 CrossRef CAS.
- S. Li, H. Wang, K. Cao and P. Huo, J. Taiwan Inst. Chem. Eng., 2019, 104, 177–186 CrossRef CAS.
- W. Zhang, X. Xiao, L. Zheng and C. Wan, Can. J. Chem. Eng., 2015, 93, 1594–1602 CrossRef CAS.
- L. Guo, Z. Yang, K. Marcus, Z. Li, B. Luo, L. Zhou, X. Wang, Y. Du and Y. Yang, Energy Environ. Sci., 2018, 11, 106–114 RSC.
- Y. Wang, X. Tang, Z. Liu, Y. Yan, B. Yang and Z. Zhu, New J. Chem., 2020, 44, 18264–18273 RSC.
- P. Borthakur, P. K. Boruah, P. Das and M. R. Das, New J. Chem., 2021, 45, 8714–8727 RSC.
- Y. Zhang, S. He, Z. He, Y. Zhang, Y. Feng, Y. Wang and M. Zhang, Int. J. Electrochem. Sci., 2022, 17, 220210 CrossRef CAS.
- G. He, Y. Zhang and Q. He, Catalysts, 2019, 9, 19–21 Search PubMed.
- Y. Liu, Y. X. Yu and W. De Zhang, J. Phys. Chem. C, 2013, 117, 12949–12957 CrossRef CAS.
- A. J. Ramya, N. Shobanadevi, S. P. Mangaiyarkarasi and R. Sankar, J. Mater. Sci.:Mater. Electron., 2023, 34, 1350 CrossRef CAS.
- X. Zong, H. Yan, G. Wu, G. Ma, F. Wen, L. Wang and C. Li, J. Am. Chem. Soc., 2008, 130, 7176–7177 CrossRef CAS PubMed.
- Y. Liu, H. Yu, X. Quan and S. Chen, Int. J. Photoenergy, 2013, 2013, 247516 Search PubMed.
- L. Zhao, T. Dong, J. Du, H. Liu, H. Yuan, Y. Wang, J. Jia, H. Liu and W. Zhou, Sol. RRL, 2021, 5, 2000415 CrossRef CAS.
- H. Zhao, H. Fu, X. Yang, S. Xiong, D. Han and X. An, Int. J. Hydrogen Energy, 2022, 47, 8247–8260 CrossRef CAS.
- I. F. Ertis and I. Boz, J. Chem. Res., 2017, 41, 529–533 CrossRef CAS.
- C. Wang, H. Lin, Z. Xu, H. Cheng and C. Zhang, RSC Adv., 2015, 5, 15621–15626 RSC.
- J. Xia, X. Ren, L. Zhao, M. Tang, L. Tan, C. Fu, Q. Wu, J. Ren, M. Ding and X. Meng, J. Nanopart. Res., 2022, 24, 57 CrossRef CAS.
- L. Li, X. Yin and Y. Sun, Sep. Purif. Technol., 2019, 212, 135–141 CrossRef CAS.
- N. Soltani, E. Saion, M. Z. Hussein, M. Erfani, A. Abedini, G. Bahmanrokh, M. Navasery and P. Vaziri, Int. J. Mol. Sci., 2012, 13, 12242–12258 CrossRef CAS PubMed.
- X. Liu, J. Li and W. Yao, ACS Omega, 2020, 5, 27463–27469 CrossRef CAS PubMed.
- F. Yang, X. Tian, K. Zhang, X. Zhang and L. Liu, ECS J. Solid State Sci. Technol., 2018, 7, P311–P316 CrossRef CAS.
- B. Rao, B. R. Kumar, V. Rajagopal Reddy and T. Rao, Chalcogenide Lett., 2011, 8, 177–185 CAS.
- T. Nagarajan, M. Khalid, N. Sridewi, P. Jagadish, S. Shahabuddin, K. Muthoosamy and R. Walvekar, Sci. Rep., 2022, 12, 1–13 CrossRef PubMed.
- J. Chen, Y. Xia, J. Yang and B. Chen, Appl. Phys. A:Mater. Sci. Process., 2018, 124, 430 CrossRef.
- Y. Li and R. Nakamura, Chin. J. Catal., 2018, 39, 401–406 CrossRef CAS.
- Z. Yan, L. Du and D. L. Phillips, RSC Adv., 2017, 7, 55993–55999 RSC.
- M. H. K. Al-Mamoori, D. K. Mahdi and S. M. AlShrefi, AIP Conf. Proc., 2018, 1968, 03001 CrossRef.
- P. Muhammed Shafi and A. Chandra Bose, AIP Adv., 2015, 5, 22488580 CrossRef.
- D. Ma, Q. Lu, E. Guo, F. Tao and M. Wei, ChemistrySelect, 2021, 6, 2561–2568 CrossRef CAS.
- X. Lian, M. Niu, Y. Huang and D. Cheng, J. Phys. Chem. Solids, 2018, 120, 52–56 CrossRef CAS.
- E. Sitara, M. F. Ehsan, H. Nasir, S. Iram and S. A. B. Bukhari, Catalysts, 2020, 10, 1–11 CrossRef.
- M. Sabarinathan, S. Harish, J. Archana, M. Navaneethan, H. Ikeda and Y. Hayakawa, RSC Adv., 2017, 7, 24754–24763 RSC.
- R. H. Waghchaure, P. B. Koli, V. A. Adole and B. S. Jagdale, Results Chem., 2022, 4, 100488 CrossRef CAS.
- I. Singh and B. Birajdar, RSC Adv., 2017, 7, 54053–54062 RSC.
- M. Z. Bin Mukhlish, M. A. Islam, M. A. Rahman, S. Hossain, M. A. Islam and M. T. Uddin, Desalin. Water Treat., 2021, 230, 169–183 CrossRef CAS.
- M. C. Hidalgo, M. Aguilar, M. Maicu, J. A. Navío and G. Colón, Catal. Today, 2007, 129, 50–58 CrossRef CAS.
- M. Khalil, G. Rahmaningsih, J. Gunlazuardi and A. Umar, Int. J. Technol., 2019, 10, 808 CrossRef.
- V. dzimbeg-malcic, Z. Barbaric-Mikocevic and K. Itrić Ivanda, Teh. Vjesn., 2011, 18, 117–124 Search PubMed.
- V. Kumar, N. Singh, S. Jana, S. K. Rout, R. K. Dey and G. P. Singh, Int. J. Hydrogen Energy, 2021, 46, 16373–16386 CrossRef CAS.
- F. Batool, S. Kanwal, H. Kanwal, S. Noreen, M. S. Hodhod, M. Mustaqeem, G. Sharif, H. K. Naeem, J. Zahid and A. R. Z. Gaafar, Molecules, 2023, 20, 7124 CrossRef PubMed.
- H. Yang, K. Zhang, R. Shi and A. Tang, J. Am. Ceram. Soc., 2007, 90, 1370–1374 CrossRef CAS.
- R. Saravanan, S. Joicy, V. K. Gupta, V. Narayanan and A. Stephen, Mater. Sci. Eng., C, 2013, 33, 4725–4731 CrossRef CAS PubMed.
- Y. Zhang, S. M. Zhao, Q. W. Su and J. L. Xu, Rare Met., 2021, 40, 1–9 Search PubMed.
- S. Gu, Y. Chen, X. Yuan, H. Wang, X. Chen, Y. Liu, Q. Jiang, Z. Wu and G. Zeng, RSC Adv., 2015, 5, 79556–79564 RSC.
- A. Rani, K. Singh, A. S. Patel, A. Chakraborti, S. Kumar, K. Ghosh and P. Sharma, Chem. Phys. Lett., 2020, 738, 2019–2020 CrossRef.
- D. Zhu and Q. Zhou, Appl. Catal., B, 2021, 281, 119474 CrossRef CAS.
- S. Kapatel and C. K. Sumesh, Electron. Mater. Lett., 2019, 15, 119–132 CrossRef CAS.
- S. M. Saleh, A. E. A. E. Albadri, M. A. Ben Aissa and A. Modwi, Crystals, 2022, 12, 1–14 CrossRef.
- P. Latha, K. Prakash and S. Karuthapandian, Adv. Powder Technol., 2017, 28, 2903–2913 CrossRef CAS.
- A. H. Chakkunny, B. Thomas and L. K. Alexander, IOP Conf. Ser.:Mater. Sci. Eng., 2021, 1187, 012018 CAS.
- K. Mamun Reza, A. Kurny and F. Gulshan, Appl. Water Sci., 2009, 170, 520–529 Search PubMed.
- S. Kader, M. R. Al-Mamun, M. B. K. Suhan, S. B. Shuchi and M. S. Islam, Environ. Technol. Innov., 2022, 27, 102476 CrossRef CAS.
- A. Mohagheghian, S. Karimi, J. Yang and M. Shirzad-siboni, J. Adv. Oxid. Technol., 2015, 18, 61–68 CAS.
- S. Ateş, E. Baran Aydın and B. Yazıcı, J. Mater. Sci.:Mater. Electron., 2020, 31, 14691–14701 CrossRef.
- J. T. Schneider, D. S. Firak, R. R. Ribeiro and P. Peralta-Zamora, Phys. Chem. Chem. Phys., 2020, 22, 15723–15733 RSC.
- X. Zheng, J. Yuan, J. Shen, J. Liang, J. Che, B. Tang, G. He and H. Chen, J. Mater. Sci.:Mater. Electron., 2019, 30, 5986–5994 CrossRef CAS.
- L. Wang, H. Zhai, G. Jin, X. Li, C. Dong, H. Zhang, H. Xie, B. Yang and H. Sun, Phys. Chem. Chem. Phys., 2017, 19, 16576–16585 RSC.
Footnote |
| † Electronic supplementary information (ESI) available. See DOI: https://doi.org/10.1039/d4ra06857b |
| This journal is © The Royal Society of Chemistry 2024 |

