DOI:
10.1039/D4RA07716D
(Paper)
RSC Adv., 2024,
14, 38864-38871
Fabrication and evaluation of a sensitive electrochemical sensor based on double hydroxide in nickel–aluminum nanolayers for the quantification of pyrocatechol
Received
30th October 2024
, Accepted 26th November 2024
First published on 10th December 2024
Abstract
Pyrocatechol, also known as catechol, is a commonly used compound in various industries; however, it can be toxic when used in high concentrations. Therefore, developing a highly sensitive electrochemical sensor for detecting pyrocatechol is important. Our study utilized a co-precipitation technique to fabricate a nanostructured nickel aluminum layered double hydroxide (Ni–Al-LDH). This material was thoroughly analyzed using advanced techniques to confirm its functionality, crystallinity, and morphology. Subsequently, Ni–Al-LDH was employed as an electrocatalyst for the detection of pyrocatechol in actual samples. The modified electrode showed significant responsiveness to pyrocatechol under specific conditions, with a detection limit of 1 nM. This sensor demonstrated analytical potential for the sensitive determination of pyrocatechol across a range of real samples.
Introduction
Pyrocatechol (PCT), also known as 1,2-dihydroxybenzene, is commonly used in the production of photographic developers and antioxidants and as an organic reagent1 in various reactions, such as the synthesis of polyesters and other polymers. Moreover, it is frequently employed in insecticides, flavoring agents, cosmetics, tanning agents, and medications and can easily be released into the environment as a pollutant. It is a hazardous chemical that can irritate the skin, induce breathing troubles, and cause other health issues even when exposed to very small amounts. It has been labeled as an environmental contaminant by both the US Environmental Protection Agency (EPA) and the European Union (EU).2 Designing an extremely sensitive and selective analytical approach to detecting PCT in environmental samples is imperative. In the analysis of environmental samples for polyphenolic compounds, a detector that is not specific to pyrocatechol may cause inaccuracy, leading to inappropriate conclusions about pollution levels. Furthermore, a general phenolic compound detector may register a high concentration of another compound that interferes with the exact concentration of pyrocatechol. Thus, many techniques, including spectrophotometry,3 HPLC,4 GC,5 colorimetry,6 mass spectrometry,7 and fluorescence spectroscopy8 have been employed to determine PCT.
Even though these techniques are dependable and sensitive, they are time-consuming, costly, and necessitate skilled personnel. Consequently, the electrochemical approach has surfaced as a more favorable option due to its lower cost, heightened sensitivity, very high selectivity, simplified operation, and improved effectiveness. Several excellent materials have been widely applied as electrochemical sensors,9 including carbon nanotubes,10 transition metal oxides,11 Prussian blue,12 and conducting polymers.13 Nickel aluminum layered double hydroxides are receiving increasing attention due to their diverse applications in supercapacitors, electrocatalysts, lithium-ion batteries, and electrochemical sensors.14 The electrochemical behavior of Ni–Al-LDH is determined by its crystallographic state, morphology, and chemical composition, which are the key parameters.15 To date, a few different shapes of Ni–Al-LDH have been fabricated, such as nanoparticles, nanorods,16 nanowires,17 nanosheets,18 microplates,19 hollow spheres,20 nanoflowers,21 and nanotubes.18 Nanostructured hydrocalcite, like Ni–Al-LDH nanostructures, have a distinct layered configuration similar to layered double hydroxides (LDH). This structure is efficient as an electrode material because of its ample surface areas that enhance the number of available active sites21 and promote efficient electron transfer, resulting in improved sensitivity.22 Ni–Al-LDH also possesses excellent catalytic properties, which are beneficial in electrochemical sensing.23 Furthermore, it has good stability24 and anion exchange properties. However, the reported methods, such as sol–gel,25 ion exchange,26 hydrothermal,27 and green synthesis methods,16 to synthesize Ni–Al-LDH are difficult to perform and time-consuming; therefore, herein, an easy, affordable, and one-pot co-precipitation method was used to synthesize this nanomaterial.
In this study, we applied a layered double hydroxide-based nanostructured material on a glassy carbon electrode to design an electrochemical sensor for PCT, which showed a remarkable performance for detecting PCT. Exhilaratingly, the determination of PCT could be realized by DPV in a mixture solution. To the best of our knowledge, this is the first report on a layered double hydroxide electrochemical sensor that can provide a new electrochemical application for Ni–Al-LDH nanomaterials.
Materials and methods
Chemicals and reagents
The chemicals used in this research were obtained from reliable suppliers, including Sigma-Aldrich and Merck, such as nickel nitrate hexahydrate, aluminum nitrate nonahydrate, sodium hydroxide, pyrocatechol, phenol, 2,4,6-trichlorophenol, cadmium chloride, mercury(II) sulfate, iron nitrate, borate buffer, phosphate buffer, hydrochloric acid, zinc acetate, and lead acetate. These chemicals were used as purchased without further purification, and only deionized water was used as the liquid throughout the experimental process.
Synthesis of nickel aluminum LDH by co-precipitation method
Initially, a solution containing 0.2 M nickel nitrate hexahydrate and 0.1 M aluminum nitrate nonahydrate in 100 mL of deionized water was employed to produce nickel aluminum nitrate LDH. Thorough mixing ensured the complete dissolution of the salts. Following this, a 1 M sodium hydroxide solution was slowly added to the above-mentioned mixture while continuously stirring to provide the hydroxide ions necessary for the reaction, and the pH was carefully maintained at 9. Then, the solution was left to age for 24 h to allow precipitates to form. The resulting precipitates were filtered and dried at 80 °C for 2 h to remove any remaining moisture. Finally, the dried precipitates were stored for future use in experiments or other applications.
Physicoelectrochemical characterization
The materials were characterized by X-ray diffraction (XRD-7000-Shimadzu Scientific Instrument), Fourier transform infrared spectroscopy (Thermo Nicolet-5700), scanning electron microscopy (SEM, 500 nm resolution image) and an electrochemical workstation (AutoLab CHI-760-USA).
Strategy for electrode modification
A glassy carbon electrode (GCE) was modified with Ni–Al-LDH using a drop-casting technique, as described in the literature.28 To prepare the electrode, 10 mg of Ni–Al-LDH was precisely added to 2.5 mL of deionized water. Additionally, 20 μL of a 5% Nafion solution, which served as the binder, was introduced in the solution. The resulting solution was subjected to thorough mixing and homogenization through 30 min of sonication. Before beginning the modification process, the electrode surface was polished using 0.5 μm pore alumina powder, and then rinsed with deionized water. Following this, the prepared LDH solution was meticulously applied to the electrode surface by depositing 10 μL onto it. Subsequently, the modified electrode (refer to Fig. 1) was left to air dry at room temperature, allowing the solvent to evaporate, and thus leaving behind the Ni–Al-LDH coating on the electrode surface.29
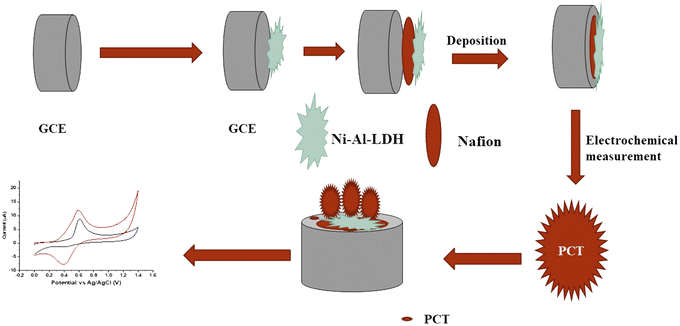 |
| | Fig. 1 Stages in the fabrication of the functional electrode modified with Ni–Al-LDH. | |
Real sample collection and preparation
Six different sources were used to determine the maximum concentration of PCT in actual samples. Apple juice, green tea, chocolate, coffee, Inderal tablets, and palm seeds were purchased from a local market and dissolved in deionized water. Subsequently, these samples were filtered through filter paper with a pore size of 0.3 μm and subjected to dilution to a concentration of 0.1 M, employing Britton–Robinson buffer in a 2![[thin space (1/6-em)]](https://www.rsc.org/images/entities/char_2009.gif) :
:![[thin space (1/6-em)]](https://www.rsc.org/images/entities/char_2009.gif) 10 v/v ratio. The standard addition method was employed to evaluate the accuracy of PCT in these real samples, which entailed spiking them by introducing a standard concentration of PCT into the samples.
10 v/v ratio. The standard addition method was employed to evaluate the accuracy of PCT in these real samples, which entailed spiking them by introducing a standard concentration of PCT into the samples.
Results
Characterization of prepared nickel aluminum layered double hydroxide
The Ni–Al-LDH was characterized by scanning electron microscopy (SEM), X-ray diffraction (XRD), and FTIR. Fig. 2a illustrates that Ni–Al-LDH has a level and smooth surface, marked by clear signs of irregular shapes associated with nano-level structural strain. Fig. 2b shows the flat crystalline planes of Ni–Al-LDH, such as (003), (006), (012), (015), and (018). In the last zone of the XRD spectrum, the (110) and (113) planes were observed. According to these results, Ni–Al–(NO3−) LDH has a predominant structure matching hydrotalcite. These results are from our previous reports.26,30 Using the Debye–Scherer equation, the crystal size of the nanoparticles was estimated to be 28.3 nm.
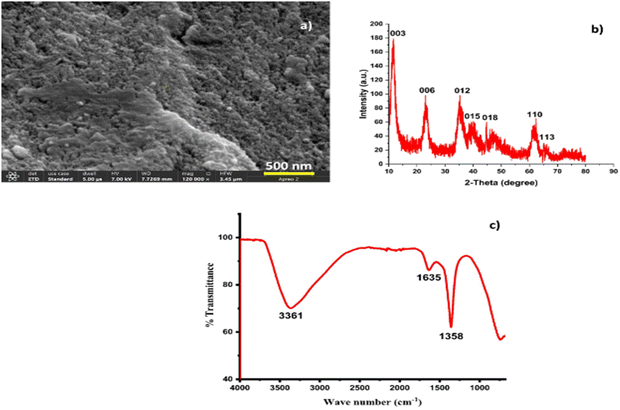 |
| | Fig. 2 High-resolution SEM image of Ni–Al-LDH nanostructures (a), XRD analysis of Ni–Al-LDH nanostructures (b), and FTIR spectrum of Ni–Al-LDH (c). | |
To confirm the chemical composition of the prepared Ni–Al-LDH precipitates, Fourier transform infrared spectroscopy (FTIR) was utilized (Fig. 2c). The broadband detected at 3361 cm−1 is linked to the –O–H stretching mode, which results from the hydrogen bonding between the hydroxyl groups in the LDH layers and the interlayer water molecules. In addition, the faint band at 1635 cm−1 is ascribed to the bending vibrational mode of the OH functional group. The LDH sample exhibits a peak at 1358 cm−1, indicating the presence of NO3− groups, and no distinct band for CO32− anions, suggesting the absence of CO2 contamination. The peaks below 1000 cm−1 correspond to vibrations of metal–oxygen bonds within LDH layers. This shows that divalent cations selectively dissolve, while trivalent cations tend to precipitate as hydroxides due to the higher acidity and lower solubility of trivalent cation hydroxides.
Electrochemical characterization of the proposed sensor for pyrocatechol
Fig. 3 shows a comparison of the cyclic voltammograms of the bare electrode with that of Ni–Al-LDH/GCE in a solution containing 0.1 M Britton–Robinson buffer (BRB) with a pH of 3 and 0.1 μM PCT at scan rate of 80 mV s−1. In the blank response (without PCT), the Ni–Al-LDH/GCE electrode showed a stable baseline, while an irregular and relatively weak current response was seen with the bare glassy carbon electrode during the detection of PCT; however, a significant peak at +0.5 V was observed in the potential range of 0 to 1.0 V with the Ni–Al LDH/GCE electrode. This observation indicates the outstanding electrocatalytic properties of Ni–Al-LDH for both the oxidation and reduction of PCT.
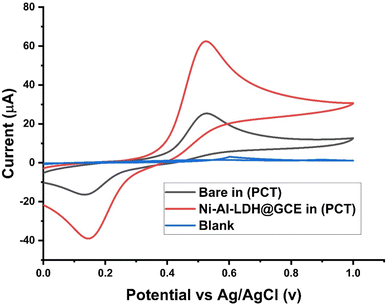 |
| | Fig. 3 Redox peak current response of Ni–Al LDH/GCE and bare GCE and comparison with blank in (BRB) buffer (pH 3) and 0.1 μM PCT at a scan rate of 80 mV s−1. | |
Optimization of parameters
Effect of supporting electrolyte. Our study utilized cyclic voltammetry to comprehensively examine how various electrolytes influence the current response of the electrode (Fig. 4). We conducted the tests using different electrolyte solutions, including 0.1 M phosphate at pH 7.3, 0.1 M sodium hydroxide (NaOH) at pH 12.1, 0.1 M borate at pH 8.3, 0.1 M sulfuric acid at pH 2.0, and Britton–Robinson buffer (pH 3) at scan rate of 80 mV s−1. Throughout our investigation, we meticulously explored a wide range of pH levels, ranging from neutral to highly alkaline, to understand the impact of pH on the current response. Intriguingly, we observed the most significant current response at pH 4.2 when employing 0.1 μM PCT in 0.1 M Britton–Robinson buffer, as visually represented in Fig. 4. This finding provides valuable insights into the intricate interplay among electrolyte composition, pH level, and the resultant current response, shedding light on the underlying electrochemical processes. Consequently, we opted for Britton–Robinson buffer as the supporting electrolyte for subsequent measurements.
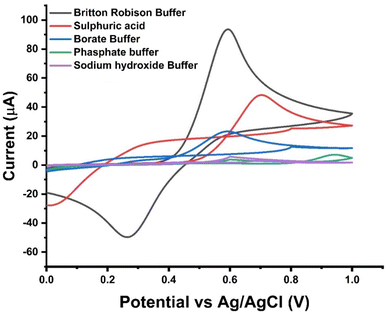 |
| | Fig. 4 CV’s signal to get the highest redox peak current using different supporting electrolytes e.g. (a) Britton–Robinson Buffer (BRB) buffer (3), (b) 0.1 M sulphuric acid pH (2.0), (c) 0.1 M borate buffer pH (8.3), (d) 0.1 M phosphate buffer pH (7.3), and (e) 0.1 M Sodium hydroxide (NaOH) pH (12.1) in 0.1 μM PCT at scan rate of 80 mV s−1. | |
Effect of pH. In our quest to identify the optimal redox peak current response for PCT, experiments were conducted using various pH levels of Britton–Robinson buffer the supporting electrolyte. The pH was explored in the range of 2 to 10 at a scan rate of 80 mV s−1, as depicted in Fig. 5. It was observed that the cyclic voltammetry (CV) response for PCT exhibited the highest peak current response at pH 3; however, as the pH increased to 10, the response of PCT appeared to decline. This is because the concentration of protons (H+) in a solution directly affects the potential needed for redox reactions. In acidic solution, where there are more H+, it shows high redox response because protons help stabilize the reactants and products. In contrast, in basic solution with fewer H+ (or more OH), a lower redox response is observed. This indicates that the pH of the solution plays a crucial role in determining the ease of the redox process.
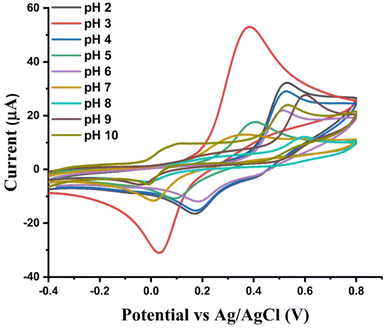 |
| | Fig. 5 Cyclic voltammetry (CV) response of 0.1 μM PCT using Ni–Al-LDH/GCE depicted at various pH levels of buffered reductive electrolyte (BRB) at a scan rate of 80 mV s−1. | |
Effect of varying scan rate. To investigate the behavior of Ni–Al-LDH/GCE, we conducted experiments using different scan rates to control the response influenced by diffusion. As shown in Fig. 6a, the cyclic voltammogram of a 0.1 μM PCT solution at various scan rates revealed the oxidation process of PCT on the modified electrode. The ascending order of the examination displayed distinct anodic peak current responses, facilitated by Ni–Al-LDH. The response of the sensor at different scan rates demonstrated a linear relationship with the peak current when tested in a 0.1 μM PCT solution, confirming the diffusion-controlled behavior of the modified electrode. Furthermore, as illustrated in Fig. 6b, the connection between the square root of the scan rate (mV s−1) and the redox peak current exhibited a strong correlation, with an R2 regression value of 0.996.
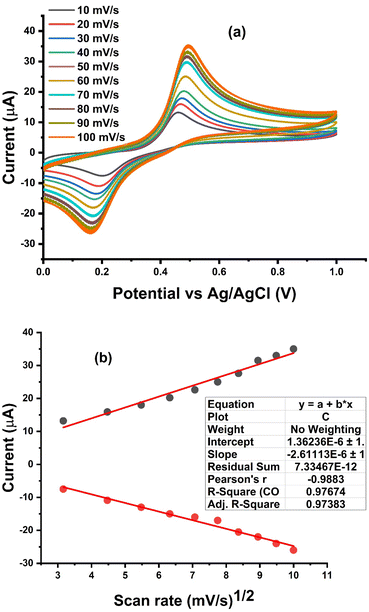 |
| | Fig. 6 (a) Redox peak current response of Ni–Al-LDH/GCE at various scan rates in a 0.1 μM PCT solution utilizing BRB at pH 3. (b) Graph depicting the relationship between the square root of the scan rate and the redox peak current. | |
Calibration study of pyrocatechol
As shown in Fig. 7b, the calibration curve depicting PCT detection illustrates a linear correlation between the peak current and PCT concentration in the range of 0.03 to 36 μM. The R2 value of 0.993 underscores the robust analytical performance of Ni–Al-LDH/GCE within this specific concentration range. Fig. 7b presents the CV responses at various PCT concentrations, affirming the linear correspondence between peak current and PCT concentration, thus validating the applicability of this method for PCT quantification. The sensitivity of this method was evaluated by determining the limit of detection (LOD) and limit of quantification (LOQ) for PCT. Employing the relevant formula, the LOD and LOQ were established to be 1 nM and 3 nM, respectively.31
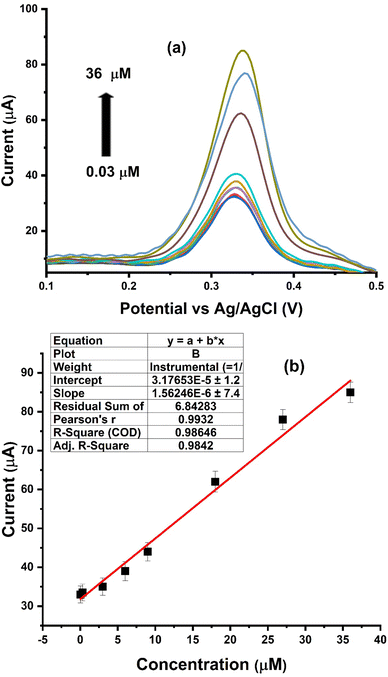 |
| | Fig. 7 (a) Peak current response related to PCT concentration, ranging from 0.03–36 μM. (b) Peak current response is a straight line with an R2 value of 0.986 at an 80 mV s−1 pulse amplitude. | |
Interference study, repeatability, and stability
The selectivity of Ni–Al-LDH/GCE was examined by testing a variety of interfering species in the presence of 0.1 μM of PCT, including phenol, 2-amino-4-chlorophenol, uric acid, nickel, iron, mercury, magnesium, and zinc, together with their mixture, as shown in Fig. 8a. No discernible effect from these common interfering agents was seen in the peak current response of the cyclic voltammogram when PCT was detected. As the suggested by the peak current response of the sensor, it is very selective for the determination of PCT, which explains why Ni–Al-LDH is useful for the detection of PCT in actual samples. Thirty repeated runs of the Ni–Al-LDH sensor in 0.1 μM PCT concentration were recorded to examine the stability of this sensor, the repeatability of the readings, and the detection of PCT, as shown in Fig. 8b. The peak current difference in this instance showed a relative standard deviation of 1.14%, confirming the high stability and repeatability of Ni–Al-LDH/GCE for the determination of PCT (Table 1).
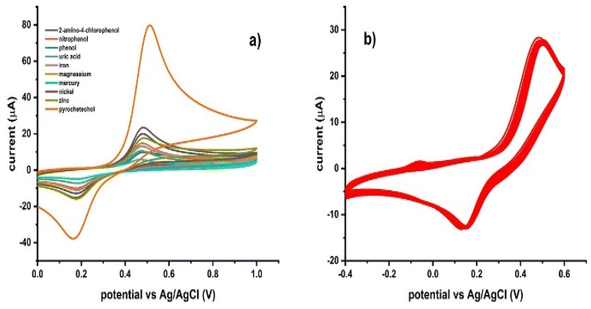 |
| | Fig. 8 (a) Effect of different interferences on the sensor response at a 0.1 μM PCT concentration. (b) Thirty consecutive runs of the Ni–Al-LDH/GCE sensor in 0.1 μM PCT to test its stability and consistency. | |
Table 1 List of analytical figures of merit for the developed electrochemical method for the quantitative detection of PCP
| S. no. |
List of analytical figures of merit |
Value |
| 1 |
LOD |
1 nM |
| 2 |
LOQ |
3 nM |
| 3 |
Linear range |
0.03 μM to 36 μM |
| 4 |
R2 (linearity) |
0.986 |
| 5 |
Slope |
1.5 × 10⁻⁶ |
| 6 |
Intercept |
3.17 × 10⁻⁶ |
| 7 |
Intraday precision |
| (a) |
0.04 μM (n = 04) |
0.4% |
| (b) |
30 μM |
0.3% |
| (c) |
60 μM |
0.64% |
| 8 |
Interday precision |
| (a) |
0.04 μM (n = 04) |
2.3% |
| (b) |
30 μM |
1.2% |
| (c) |
60 μM |
1.9% |
Real sample applications
To examine the viability of the PCT sensor, a recovery test was conducted to verify the accuracy of PCT in actual samples. The suggested sensor technique tracked the PCT concentrations in six distinct genuine samples. The samples were bought from the marketplace to determine the highest concentration of PCT in actual samples. Once at the lab, the recently obtained actual samples were dissolved in DI water and passed through filter paper with a pore size of 0.3 μm. Upon dilution with Britton–Robinson buffer at a ratio of 2![[thin space (1/6-em)]](https://www.rsc.org/images/entities/char_2009.gif) :
:![[thin space (1/6-em)]](https://www.rsc.org/images/entities/char_2009.gif) 10 v/v, the real samples were combined with a standard PCT concentration to verify the PCT accuracy in the real samples. Utilizing the calibration curves, recovery experiments were performed to assess the influence of the matrix and compute the PCT concentration. Three repeats of each measurement were used to assess the reproducibility of the real samples and the spiked standard concentration of PCT. Two distinct real samples were found to have a well-resolved peak current response. Table 2 lists the recovery values for each real sample. The range of recovery percentage for PCT was 95–104%, with linear segments exhibiting superior sensitivity and percent recovery values. The results show that the suggested sensor is very suitable and sensitive for detecting the PCT concentration in actual samples with acceptable relative standard deviation values. The electrochemical performances of several proposed PCT detection sensors using differential pulse voltammetry (DPV) and cyclic voltammetry techniques are compared in Table 3. Moreover, most of the recorded sensors are too expensive or complicated to use, and thus less developed countries cannot employ them. Alternatively, some of them are less expensive but have a low PCT detection sensitivity. Therefore, our recommended sensor stands out among the suggested sensors due to its outstanding stability, low cost, and high sensitivity for the determination of PCT.
10 v/v, the real samples were combined with a standard PCT concentration to verify the PCT accuracy in the real samples. Utilizing the calibration curves, recovery experiments were performed to assess the influence of the matrix and compute the PCT concentration. Three repeats of each measurement were used to assess the reproducibility of the real samples and the spiked standard concentration of PCT. Two distinct real samples were found to have a well-resolved peak current response. Table 2 lists the recovery values for each real sample. The range of recovery percentage for PCT was 95–104%, with linear segments exhibiting superior sensitivity and percent recovery values. The results show that the suggested sensor is very suitable and sensitive for detecting the PCT concentration in actual samples with acceptable relative standard deviation values. The electrochemical performances of several proposed PCT detection sensors using differential pulse voltammetry (DPV) and cyclic voltammetry techniques are compared in Table 3. Moreover, most of the recorded sensors are too expensive or complicated to use, and thus less developed countries cannot employ them. Alternatively, some of them are less expensive but have a low PCT detection sensitivity. Therefore, our recommended sensor stands out among the suggested sensors due to its outstanding stability, low cost, and high sensitivity for the determination of PCT.
Table 2 Analysis of spiked and detected levels in real samples by Ni–Al-LDH/GCE
| Sample |
Spiked μM |
Detected μM |
RSD% |
Recovery% |
| Chocolate (dairy milk) |
0 |
0 |
0 |
0 |
| 5 |
4.8 |
3.2 |
96 |
| 10 |
14.7 |
2.56 |
98 |
| 15 |
29.9 |
1.21 |
101 |
| Coffee |
0 |
6 |
2.1 |
0 |
| 5 |
11.2 |
2.3 |
103 |
| 10 |
21 |
1.79 |
98.5 |
| 15 |
35.8 |
1.3 |
96 |
| Green tea |
0 |
15 |
0 |
0 |
| 5 |
19.7 |
2.3 |
95.5 |
| 5 |
24.9 |
2.46 |
102 |
| 10 |
34 |
1.28 |
96.5 |
| Inderal drug (anxiety drug) |
0 |
8 |
2.6 |
0 |
| 5 |
13.3 |
2.1 |
102 |
| 10 |
23.2 |
1.9 |
99.3 |
| 10 |
33.1 |
2.6 |
98.6 |
| Palm seed |
0 |
0 |
0 |
0 |
| 5 |
4.87 |
2.5 |
97.3 |
| 10 |
14.6 |
1.3 |
98.6 |
| 15 |
29.6 |
2.1 |
100 |
| Apple juice |
0 |
0 |
0 |
0 |
| 5 |
5.1 |
2.4 |
102 |
| 10 |
14.9 |
1.6 |
98 |
| 15 |
29.9 |
2.4 |
100 |
Table 3 Comparison of various electrochemical sensors for the detection of PCT
| Sensor |
Technique |
Linear range (μM) |
LOD (nM) |
Reference |
| PBL-II/CPE |
DPV |
1.7–516 |
800 |
32 |
| MWCNT–CB–Nf |
DPV |
3.98–16.71 |
2.82 |
1 |
| Reduced graphene oxide |
DPV |
1.44–31.2 |
8 |
33 |
| (CuO/GO) |
DPV |
0.3–360 |
1000 |
34 |
| MnO2 NRs–GO |
DPV |
0.5–400.0 |
20 |
35 |
| Poly(murexide) |
CV |
100–800 |
240 |
36 |
| GPE/fSGRR-MWCNT |
DPV |
0.50–35, 35–500 |
8 |
37 |
| Ni–Al-LDH |
DPV |
0.03–36 |
1 |
This work |
Conclusions
In conclusion, the co-precipitation approach was used to synthesize a nickel aluminum-layered double hydroxide nanostructure. The produced Ni–Al-LDH was characterized using FTIR, XRD and SEM to verify its stretching vibrations, crystalline structure, and morphology, respectively. Subsequently, an Ni–Al-LDH/GCE-based electrocatalyst was fabricated and used to determine PCT in six distinct actual samples, with the voltammogram of the modified electrode revealing a very high-intensity peak current compared to the bare Ni–Al-LDH electrode. The modified electrode showed remarkable responsiveness for PCT in the linear range of 0.03 to 36 μM at a pulse amplitude of 80 mV s−1. It was discovered that the developed method for the detection of PCT showed an LOD and LOQ of 1 nM and 3 nM, respectively. Furthermore, the actual sample application of the prepared Ni–Al-LDH-GCE was tested in Inderal tablet, coffee, green tea, palm seed, apple juice, and chocolate samples. The satisfactory recovery outcomes confirm the dependability of produced electrode in actual samples.
Data availability
The data will be made available on request.
Author contributions
Conceptualization, M. M. K., T. G., S. Q. M., N. F., A. R. S. and E. A. L.-M.; methodology M. M. K., A. R. S.; software, M. M. K., T. G.; validation, S. Q. M., N. F., J. M. C. B. and A. R. S.; formal analysis, M. M. K. and T. G.; investigation, M. M. K., T. G., J. M. C. B. and N. F.; resources, S. Q. M., A. R. S. and E. A. L.-M.; data curation, M. M. K.; writing—original draft preparation, M. M. K., T. G., S. Q. M., N. F., A. R. S., J. T. L.-M. and E. A. L.-M.; writing—review and editing, M. M. K., T. G., S. Q. M., N. F., A. R. S., J. T. L.-M. and E. A. L.-M.; visualization, E. A. L.-M.; supervision, A. R. S.; project administration, A. R. S. All authors have read and agreed to the submitted version of the manuscript.
Conflicts of interest
The authors declare no conflicts of interest.
References
- P. Das, L. Barbora, M. Das and P. Goswami, Sens. Actuators, B, 2014, 192, 737–744 CrossRef CAS
 .
. - R. B. Sawczuk, H. A. Pinheiro, J. R. N. Santos, I. C. Alves, H. D. Viegas, C. A. Lacerda, J. K. C. Sousa, E. P. Marques and A. L. Marques, Int. J. Environ. Anal. Chem., 2023, 103(8), 1733–1750 CrossRef CAS
 .
. - N. Ghasemi, M. Goodarzi and M. Khosravi, Int. J. Comput. Inf. Eng., 2009, 3(8), 2134–2139 Search PubMed
 .
. - S. Nsanzamahoro, F. P. Mutuyimana, Y. Han, S. Ma, M. Na, J. Liu, Y. Ma, C. Ren, H. Chen and X. Chen, Sens. Actuators, B, 2019, 281, 849–856 CrossRef CAS
 .
. - Á. Kovács, M. Mörtl and A. Kende, Microchem. J., 2011, 99(1), 125–131 CrossRef
 .
. - L.-p. Zhang, Y.-p. Xing, L.-h. Liu, X.-h. Zhou and H.-c. Shi, Sens. Actuators, B, 2016, 225, 593–599 CrossRef CAS
 .
. - M. Castillo, D. Puig and D. Barceló, J. Chromatogr. A, 1997, 778(1–2), 301–311 CrossRef CAS
 .
. - G. M. Khairy, E. I. Ali and E. M. Saad, Anal. Methods, 2023, 15(46), 6425–6434 RSC
 .
. - J. Manjunatha, Chem. Data Collect., 2020, 25, 100331 CrossRef CAS
 .
. - B. P. López and A. Merkoçi, Analyst, 2009, 134(1), 60–64 Search PubMed
 .
. - A. S. Agnihotri, A. Varghese and M. Nidhin, Appl. Surf. Sci. Adv., 2021, 4, 100072 CrossRef
 .
. - A. Roychoudhury, S. Basu and S. K. Jha, Anal. Sci., 2018, 34(10), 1163–1169 CAS
 .
. - D. Lakshmi, A. Bossi, M. J. Whitcombe, I. Chianella, S. A. Fowler, S. Subrahmanyam, E. V. Piletska and S. A. Piletsky, Anal. Chem., 2009, 81(9), 3576–3584 CrossRef CAS
 .
. -
(a) C. Bai, S. Sun, Y. Xu, R. Yu and H. Li, J. Colloid Interface Sci., 2016, 480, 57–62 CrossRef CAS
 ;
(b) H. Yang, T. Guo, D. Yin, Q. Liu and X. Zhang, J. Taiwan Inst. Chem. Eng., 2020, 112, 212–221 CrossRef CAS
  ;
(c) W. Yu, N. Deng, K. Cheng, J. Yan, B. Cheng and W. Kang, J. Energy Chem., 2021, 58, 472–499 CrossRef CAS
  .
. - A. B. Béléké, E. Higuchi, H. Inoue and M. Mizuhata, J. Power Sources, 2014, 247, 572–578 CrossRef
 .
. - F. Zhang, L. Guo, S. Xu and R. Zhang, Langmuir, 2015, 31(24), 6704–6712 CrossRef CAS
 .
. - L. Li, K. San Hui, K. N. Hui, T. Zhang, J. Fu and Y.-R. Cho, Chem. Eng. J., 2018, 348, 338–349 CrossRef CAS
 .
. - M. Li, F. Liu, J. Cheng, J. Ying and X. Zhang, J. Alloys Compd., 2015, 635, 225–232 CrossRef CAS
 .
. - L. Li, J. Fu, K. S. Hui, K. N. Hui and Y.-R. Cho, J. Mater. Sci.: Mater. Electron., 2018, 29, 17493–17502 CrossRef CAS
 .
. - J. Wang, Z. Wang, D. Mao and D. Wang, Sci. China:Chem., 2022, 65(1), 7–19 CrossRef CAS
 .
. - T. Saravanakumar, S. S. Bama, T. Selvaraju and S. S. Basha, Electrochim. Acta, 2021, 392, 139029 CrossRef CAS
 .
. - P. d. O. Rossini, A. Laza, N. F. Azeredo, J. M. Gonçalves, F. S. Felix, K. Araki and L. Angnes, TrAC, Trends Anal. Chem., 2020, 126, 115859 CrossRef CAS
 .
. - L. Feng, Y. Du, J. Huang, L. Cao, L. Feng, Y. Feng, Q. Liu, D. Yang and K. Kajiyoshi, Sustainable Energy Fuels, 2020, 4(6), 2850–2858 RSC
 .
. - J. Tian, Y. Zang, J. Sun, J. Qu, F. Gao and G. Liang, Nano Energy, 2020, 70, 104502 CrossRef CAS
 .
. - J. Prince, A. Montoya, G. Ferrat and J. S. Valente, Chem. Mater., 2009, 21(24), 5826–5835 CrossRef CAS
 .
. - S. Riaz, A. ur Rehman, Z. Akhter, T. Najam, I. Hossain, M. R. Karim, M. A. Assiri, S. S. A. Shah and M. A. Nazir, Mater. Today Sustainability, 2024, 27, 100897 CrossRef
 .
. - H. Maki, Y. Mori, Y. Okumura and M. Mizuhata, Mater. Chem. Phys., 2013, 141(1), 445–453 CrossRef CAS
 .
. - M. Ahmadi-Kashani and H. Dehghani, Colloids Surf., B, 2020, 194, 111134 CrossRef CAS
 .
. - I. Gualandi, Y. Vlamidis, L. Mazzei, E. Musella, M. Giorgetti, M. Christian, V. Morandi, E. Scavetta and D. Tonelli, ACS Appl. Nano Mater., 2018, 2(1), 143–155 CrossRef
 .
. - M. M. Khan, H. Shaikh, A. Al Souwaileh, M. Y. Khan, M. Batool, S. Q. Memon and A. R. Solangi, Arabian J. Chem., 2024, 17(3), 105604 CrossRef CAS
 .
. - S. Amin, A. Tahira, A. Solangi, V. Beni, J. Morante, X. Liu, M. Falhman, R. Mazzaro, Z. H. Ibupoto and A. Vomiero, RSC Adv., 2019, 9(25), 14443–14451 RSC
 .
. - Y. Zhou, W. Tang, F. Dang, S. Chai and L. Zhang, Colloids Surf., B, 2014, 118, 148–153 CrossRef CAS PubMed
 .
. - N. Mohammed Modawe Alshik Edris, J. Abdullah, S. Kamaruzaman and Y. Sulaiman, Microchim. Acta, 2019, 186, 1–9 CrossRef CAS
 .
. - M. Kumar, B. K. Swamy, B. Hu, M. Wang, G. Yasin, B. Liang, H. Madhuchandra and W. Zhao, Microchem. J., 2021, 168, 106503 CrossRef CAS
 .
. - P. Karami-Kolmoti, H. Beitollahi and S. Modiri, Journal of Food Measurement and Characterization, 2023, 17(2), 1974–1984 CrossRef
 .
. - A. A. Kumar, B. K. Swamy, T. S. Rani, P. Ganesh and Y. P. Raj, Mater. Sci. Eng., C, 2019, 98, 746–752 CrossRef
 .
. - S. Sultana, M. Noroozifar and K. Kerman, J. Electroanal. Chem., 2021, 899, 115644 CrossRef CAS
 .
.
|
| This journal is © The Royal Society of Chemistry 2024 |
Click here to see how this site uses Cookies. View our privacy policy here.  Open Access Article
 *a,
José Trinidad López-Maldonadod,
José Manuel Cornejo-Bravo
 e and
Eduardo Alberto López-Maldonadoe
![[thin space (1/6-em)]](https://www.rsc.org/images/entities/char_2009.gif) :
:![[thin space (1/6-em)]](https://www.rsc.org/images/entities/char_2009.gif) 10 v/v ratio. The standard addition method was employed to evaluate the accuracy of PCT in these real samples, which entailed spiking them by introducing a standard concentration of PCT into the samples.
10 v/v ratio. The standard addition method was employed to evaluate the accuracy of PCT in these real samples, which entailed spiking them by introducing a standard concentration of PCT into the samples.


![[thin space (1/6-em)]](https://www.rsc.org/images/entities/char_2009.gif) :
:![[thin space (1/6-em)]](https://www.rsc.org/images/entities/char_2009.gif) 10 v/v, the real samples were combined with a standard PCT concentration to verify the PCT accuracy in the real samples. Utilizing the calibration curves, recovery experiments were performed to assess the influence of the matrix and compute the PCT concentration. Three repeats of each measurement were used to assess the reproducibility of the real samples and the spiked standard concentration of PCT. Two distinct real samples were found to have a well-resolved peak current response. Table 2 lists the recovery values for each real sample. The range of recovery percentage for PCT was 95–104%, with linear segments exhibiting superior sensitivity and percent recovery values. The results show that the suggested sensor is very suitable and sensitive for detecting the PCT concentration in actual samples with acceptable relative standard deviation values. The electrochemical performances of several proposed PCT detection sensors using differential pulse voltammetry (DPV) and cyclic voltammetry techniques are compared in Table 3. Moreover, most of the recorded sensors are too expensive or complicated to use, and thus less developed countries cannot employ them. Alternatively, some of them are less expensive but have a low PCT detection sensitivity. Therefore, our recommended sensor stands out among the suggested sensors due to its outstanding stability, low cost, and high sensitivity for the determination of PCT.
10 v/v, the real samples were combined with a standard PCT concentration to verify the PCT accuracy in the real samples. Utilizing the calibration curves, recovery experiments were performed to assess the influence of the matrix and compute the PCT concentration. Three repeats of each measurement were used to assess the reproducibility of the real samples and the spiked standard concentration of PCT. Two distinct real samples were found to have a well-resolved peak current response. Table 2 lists the recovery values for each real sample. The range of recovery percentage for PCT was 95–104%, with linear segments exhibiting superior sensitivity and percent recovery values. The results show that the suggested sensor is very suitable and sensitive for detecting the PCT concentration in actual samples with acceptable relative standard deviation values. The electrochemical performances of several proposed PCT detection sensors using differential pulse voltammetry (DPV) and cyclic voltammetry techniques are compared in Table 3. Moreover, most of the recorded sensors are too expensive or complicated to use, and thus less developed countries cannot employ them. Alternatively, some of them are less expensive but have a low PCT detection sensitivity. Therefore, our recommended sensor stands out among the suggested sensors due to its outstanding stability, low cost, and high sensitivity for the determination of PCT.
.
.
.
.
.
.
.
.
.
.
.
.
.
; (b) H. Yang, T. Guo, D. Yin, Q. Liu and X. Zhang, J. Taiwan Inst. Chem. Eng., 2020, 112, 212–221 CrossRef CAS
; (c) W. Yu, N. Deng, K. Cheng, J. Yan, B. Cheng and W. Kang, J. Energy Chem., 2021, 58, 472–499 CrossRef CAS
.
.
.
.
.
.
.
.
.
.
.
.
.
.
.
.
.
.
.
.
.
.
.
.


