 Open Access Article
Comparative optical thermometry analysis using Na2SrP2O7:Er3+/Yb3+ phosphors: evaluation of LIRTCL and LIRNTCL methods for high-resolution temperature sensing
Mouna Fhoulaa,
Mohamed Khitounibc and
Mohamed Dammak *a
*a
aLaboratoire de Physique Appliquée, Groupe des Matériaux Luminescents, Faculté des Sciences de Sfax, Département de Physique, Université de Sfax, Sfax B.P. 3000, Tunisia. E-mail: madidammak@yahoo.fr; Mohamed.dammak@fss.usf.tn
bDepartment of Chemistry, College of Science, Qassim University, Buraidah 51452, Saudi Arabia
cLaboratory of Inorganic Chemistry, LR17-ES-07, Faculty of Science, University of Sfax, Sfax 3018, Tunisia
First published on 12th December 2024
Abstract
Optical thermometry is a valuable non-contact technique for temperature measurement, especially in environments where traditional methods are impractical. Despite its advantages, enhancing the precision of optical thermometers remains a significant challenge. In this study, we explored the thermometric properties of Na2SrP2O7 phosphors co-doped with Er3+/Yb3+, synthesized via a solid-state reaction method, for temperature sensing within the 200–440 K range under 980 nm excitation. Upconversion (UC) luminescence, observed in the visible spectrum, was analyzed using the fluorescence intensity ratio (FIR) method, focusing on both thermally coupled (TCLs) and non-thermally coupled (NTCLs) energy levels of Er3+/Yb3+. Specifically, the transitions 2H11/2 → 4I15/2, 4S3/2 → 4I15/2, and 4F9/2 → 4I15/2 were examined to calculate thermometric parameters. The maximum absolute sensitivity (SA) and relative sensitivity (SR) for the 2H11/2 → 4I15/2 to 4S3/2 → 4I15/2 transition were 0.0009 K−1 and 0.6% K−1, respectively, while for the 2H11/2 → 4I15/2 to 4F9/2 → 4I15/2 transition, SA was 0.004 K−1, with a maximum SR of 1.14% K−1. Furthermore, by employing a luminescence intensity ratio technique based on TCLs (LIRTCL), the minimum temperature uncertainty (δT) was found to be 1.31 K at 320 K. In contrast, the luminescence intensity ratio method based on NTCLs (LIRNTCL) yielded a much lower minimum δT value of 0.34 K at 200 K, indicating superior performance in terms of temperature resolution. These findings demonstrate that the LIRNTCL technique provides more sensitive and accurate temperature measurement compared to LIRTCL. The excellent temperature resolution and sensitivity of Na2SrP2O7:Er3+/Yb3+ phosphors highlight their potential for highly accurate optical thermometry applications in scientific and industrial contexts.
1. Introduction
Temperature, as an important physical parameter, has significant impacts on many physical, chemical, and biological processes.1,2 Traditional temperature measuring devices, such as thermometers and thermocouples, which are limited by response time and spatial resolution, are no longer applicable. In the last few years, non-contact sensing techniques have attracted great attention. These new technologies exhibit some advantages, such as remote operation, safety and high sensitivity.3–5 Among the non-contact temperature sensing technologies, luminescence thermometry has attracted significant attention because of its advantages of rapid response capability, non-invasive operation and high-spatial resolution.6–8 Essentially, there are three commonly used techniques for temperature sensing using thermographic phosphors: the peak intensity ratio, lifetime and rise time of luminescence. Indeed, the luminescence intensity ratio (LIR) is the most commonly used temperature sensing method. The LIR is determined by measuring optical emission intensity variations from thermally coupled transitions at different temperatures. LIR technology is based on changes in emission intensity ratios caused by temperature variations. These ratios can either reflect the interaction between two thermally coupled levels of a single lanthanide ion or emissions from several different lanthanide ions.9–11 Generally, the presence of two closely spaced states with a gap smaller than 2000 cm−1 is considered the condition for thermal coupling of transitions to occur. In this case, the LIR curve is typically fitted if both the states share the electronic population according to Boltzmann distribution.12 However, because of the small energy gap and spectral overlapping, TCL-based optical thermometers suffer from low sensitivity and a narrow temperature range, limiting their practical use.13,14 LIR methods based on non-thermally coupled levels (NTCLs) can be used to avoid the above problems because the emission bands of two luminescent center ions do not overlap. Thus, the discovery of alternative luminescent materials suitable for temperature sensing is an important goal to achieve optical thermometry that operates over a wide temperature range with high sensitivity using the LIR of NTCLs.15,16Luminescence centers and host matrixes are two significant factors for efficient UC emission, which is widely used for optical temperature measurement. Rare-earth (RE) ions are considered the best candidates for luminescence centers owing to their abundant energy levels and high conversion efficiency. Different RE ions have been studied for temperature sensing, such as Er3+, Tm3+, Dy3+, Ho3+, and Nd3+.17 From these, Er3+ is one of the most efficient activators because of its strong green up-conversion luminescence. Nevertheless, an Er3+ ion single-doped phosphor material exhibits low up-conversion efficiency due to its small absorption cross section. Simultaneously, to enhance green emission intensity, Yb3+ can be used as a sensitizer for its large absorption cross section over the near-infrared region. Yb3+ is also able to transport its energy to the activator ion via an excited-state absorption route. Thus, co-doping Yb3+ and Er3+ has become the preferred rare earth combination in temperature-sensitive application.18–25
Active research is highly sought after to develop new inorganic phosphor materials with better temperature-sensing properties. Currently, phosphates are widely used as host materials considering their high emission efficiency; excellent thermal, mechanical and chemical stability; and better color rendering index. These properties make them ideal for a wide range of display devices and highlight their potential for use in white light-emitting diodes (WLEDs).26 Different phosphors derived from inorganic phosphates have been investigated as effective luminescence materials for displays27–29 and optical thermometry.18,30–32 To date, the UC luminescence properties and optical thermometry of Er3+/Yb3+ co-doped Na2SrP2O7 have never been investigated.
In the present paper, an Na2SrP2O7 (NSPO) host matrix co-doped with Er3+/Yb3+ were prepared via the solid-state reaction method. The dependency of Yb3+ concentration and laser power on the UC luminescence characteristics of Er3+ and Yb3+ ions under 980 nm excitation were studied. The energy transfer mechanisms between Yb3+ and Er3+ ions were also investigated. Moreover, LIR thermometry based on TCLs and NTCLs of the nanorods was analyzed.
2. Experimental
2.1. Sample preparation
The pyrophosphate Na2SrP2O7:2%Er3+,x%Yb3+ (x = 3, 5, 10, and 15% mol) was prepared using the conventional solid-state reaction method. This involved mixing sodium carbonate (Na2CO3), strontium carbonate (SrCO3), di-ammonium hydrogen phosphate (NH4)2HPO4, erbium oxide (Er2O3), and ytterbium oxide (Yb2O3). Initially, the mixtures were carefully ground together into fine powder with an agate mortar and then progressively heated up to 300 °C to evacuate ammonia and water. The resulting powders were shaped into cylindrical pellets to promote condensation. The samples were then sintered at 700 °C for 12 h in an air atmosphere with a heating rate of 5 °C min−1 before cooling down to room temperature.2.2. Characterization tools
XRD measurements were performed in grazing incidence using SIEMENS -D8-θ/2θ with a Cu Kα X-ray source (λ = 0.15418 nm) at glancing angles between 10° and 70°. The Fourier transform infrared (FT-IR) spectrum for the title compound was recorded at room temperature on a PerkinElmer Spectrum 1000 FT-IR spectrometer in the range 400–4000 cm−1. UC emission spectra were carefully analyzed using a PerkinElmer Lambda 365 spectrometer. For the dependent temperature, the sample was placed in a cryostat, and its photoluminescence (PL) spectra were measured with a Horiba-Jobin Yvon HR 320 spectrometer with a 980 nm laser excitation source.3. Results and discussion
3.1. X-ray diffraction study
The X-ray diffraction patterns of NSPO:2%Er,x%Yb (x = 3, 5, 10, and 15) are shown in Fig. 1a. The intensity and position of the diffraction peaks of the four samples are almost the same. In order to verify phase purity, the Rietveld refinement XRD patterns of different samples were obtained using Rietveld refinement (Fig. 1b). There are no impurity peaks between the experimental patterns and the calculated data. The refinement results reveal that the NSPO:Er,Yb compound crystallizes in the orthorhombic system with the Pnma space group, and lattice parameters presented in Table 1 are in agreement with those reported in the literature.33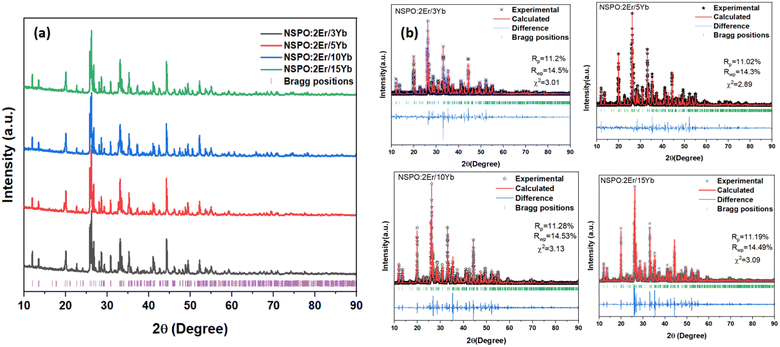 | ||
| Fig. 1 (a) X-ray powder diffraction patterns and (b) XRD Rietveld refinements of NSPO:2%Er,x%Yb (x = 3, 5, 10, and 15). | ||
| x | a (Å) | b (Å) | c (Å) | V (Å3) |
|---|---|---|---|---|
| 3 | 8.908 | 5.408 | 13.092 | 630.714 |
| 5 | 8.917 | 5.414 | 13.104 | 632.672 |
| 10 | 8.918 | 5.406 | 13.009 | 631.358 |
| 15 | 8.919 | 5.401 | 13.117 | 631.819 |
3.2. FTIR studies
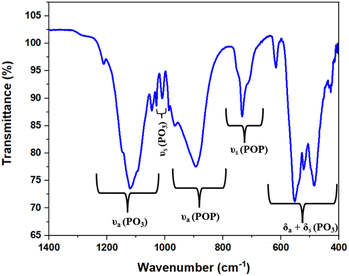
Fig. 2 shows the infrared spectrum of the NSPO:2%Er,15%Yb sample recorded at room temperature in the range of 1400–400 cm−1. Band assignments were obtained by comparing the observed peaks with those of similar compounds reported in the literature.33,34 The primary vibrational modes in the spectrum are attributed to the internal modes of the P2O7 group, particularly the characteristic vibrations of PO3 groups and P–O–P bridging bonds.Specifically, bands in the range 1212–1008 cm−1 were tentatively assigned to the symmetric and antisymmetric stretching modes of the PO3 group, which are typical of the phosphate network. Bands in the region 984–731 cm−1 are associated with the symmetric and antisymmetric stretching modes of P–O–P bridges (POP), reflecting the connectivity within the phosphate structure. The absorption bands in the lower frequency range of 618–425 cm−1 are attributed to the symmetric and antisymmetric deformation modes, δ(PO3), which are associated with bending vibrations of PO3 groups.
3.3. Upconversion emission studies
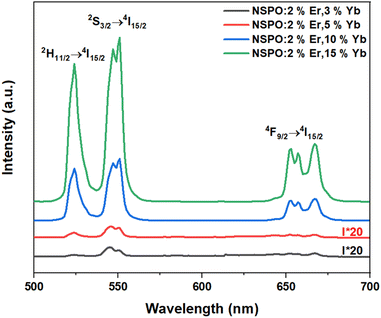
Fig. 3 shows the UC emission spectra of 2%Er3+,x%Yb3+ co-doped NSPO particles excited at 980 nm. The spectra exhibit the typical transitions of Er3+ ions: two intense green bands located at 523 nm and 544 nm are assigned to the 2H11/2 → 4I15/2 (band H) and 4S3/2 → 4I15/2 (band S) transitions, respectively, while the red band corresponds to the 4F9/2 → 4I15/2 (band F) transition at 662 nm.18,35 As Yb3+ concentration increases, a great enhancement in Er3+ emission is observed, which is attributed to the improved absorption by Yb3+ at 980 nm. This suggests that Yb3+ ions function as sensitizers for Er3+ through energy transfer from Yb3+ to Er3+.36The dependence of emission intensity on pump power is recorded to investigate the UC emission mechanism. Fig. 4 shows such a plot of the integral emission intensity (I) of the green and red emission lines as a function of pump laser power (P). In the upconversion process, the relationship between I and P can be written as:37  . Where n is the number of pump photons absorbed for each upconverted visible photon emitted. The slope values obtained for the two green bands (H and S) and the red band (F) are 2.25, 1.76, and 1.54, respectively. These values of n approximate to 2, revealing that UC emissions in the NSPO:Er/Yb sample come from two-photon processes.
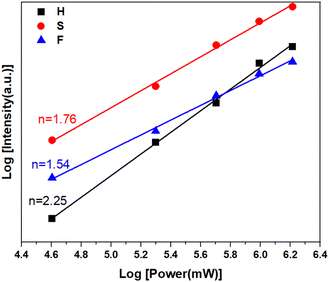 | ||
| Fig. 4 Log–log plots of up-conversion emission intensity versus pump power for NSPO:2%Er,15%Yb under 980 nm laser excitation. | ||
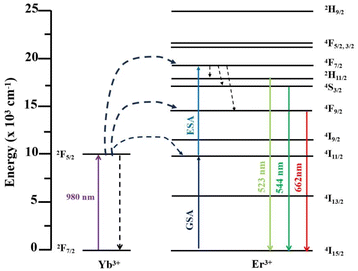
To further explain the UC process between Er3+ and Yb3+, the luminescence mechanism and possible energy transfer level diagram were drawn, as shown in Fig. 5. Under 980 nm laser excitation, the 4I11/2 energy level of Er3+ ions gets populated through the ground state absorption (GSA) method by absorbing energy from Yb3+ ions. Subsequently, by the excited state absorption (ESA) process, the 4F7/2 level is populated through absorption of another photon of the same energy. Photons in the 4F7/2 level non-radiatively relax to the 2H11/2 and 4S3/2 states. Meanwhile, the 2H11/2 and 4S3/2 levels relax back to the ground emitting green light at around 523 nm and 544 nm. Finally, the Er3+ in the 4F9/2 level transfers to the 4I15/2 level, resulting in a red emission centered at 662 nm. Owing to the larger absorption cross section of Yb3+ and the high matching energy levels between Yb3+ and Er3+ ions, the energy transfer processes mentioned above are very efficient, resulting in intensive UC emission.22,38,39
3.4. Optical temperature sensing based on TCLs and NTCLs
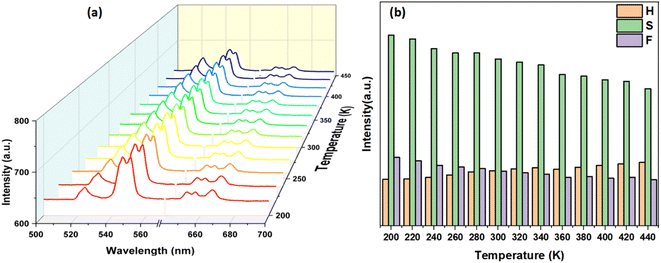
To explore the probability of thermometry application, temperature dependent UC emission spectra under 980 nm laser excitation in the range of 200–440 K were plotted, as shown in Fig. 6a. It is clearly observed in Fig. 6b that the intensity of the 2H11/2 → 4I15/2 transition increases and the intensities of both 4S3/2 → 4I15/2 and 4F9/2 → 4I15/2 transitions decrease gradually with increasing temperatures, while the shape and position of the emission peaks remain unchanged. Thus, the different change tendencies of emission intensities can be used to achieve greater sensing thermometry. For thermally coupled energy levels, the luminescence intensity ratio (LIRTCL) is governed by the Boltzmann distribution law and can be expressed as follows:40–43
 | (1) |
Fig. 7a shows the temperature-dependent LIRTCL for NSPO:Er,Yb. As can be observed, the LIRTCL increases as the temperature increases, in alignment with the fit curve described in eqn (1), in which the fitting function is LIRTCL = 1.08![[thin space (1/6-em)]](https://www.rsc.org/images/entities/char_2009.gif) exp(−648.8/T) + 0.2 with R2 = 0.999, indicating a good fit. Next, the energy gap between 2H11/2 and 4S3/2 levels was calculated to be approximately 450 cm−1.
exp(−648.8/T) + 0.2 with R2 = 0.999, indicating a good fit. Next, the energy gap between 2H11/2 and 4S3/2 levels was calculated to be approximately 450 cm−1.
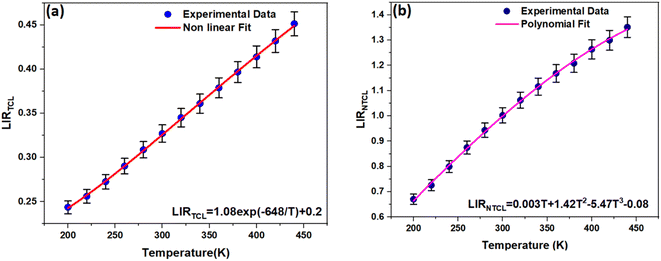 | ||
| Fig. 7 (a) LIRTCL and (b) LIRNTCL values as a function of temperature. The error bars indicate uncertainties due to experimental acquisition and data analysis. | ||
Moreover, noncontact optical temperature sensing using the LIR of NTCLs is investigated to improve sensing sensitivity. Fig. 7b exhibits the temperature-dependent UC LIRNTCL of the other pair associated to NTCL: 2H11/2 → 4I15/2 and 4F9/2 → 4I15/2 in the temperature range of 200–440 K. It is rare for NTCLs to be affected by thermal excitation because of their large energy gaps, which makes the traditional LIR method unsuitable.44 Therefore, the experimental data could be typically fitted in alignment with the following polynomial expression:
 | (2) |
In addition, the sensitivity of the sensor is a key indicator for actual optical temperature measurement. Two sensitivity parameters are defined: absolute sensitivity SA, which indicates the rate of change in the LIR with temperature, and relative sensitivity SR, which represents the relative variation in LIR with unit temperature. These parameters can be expressed by the following equations:36,39,45
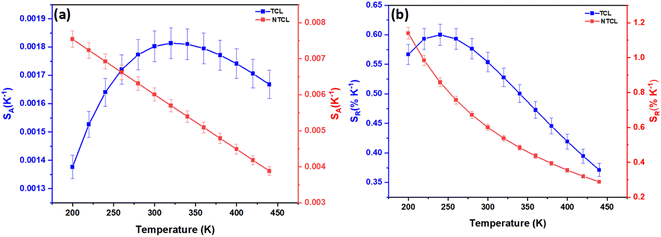
Fig. 8 depicts the evolution of SA and SR values in the temperature range of 200–440 K. Firstly, SA values based on LIRNTCL are much larger than those based on LIRTCL in the whole experimental temperature range. As it can be noticed, the maximum values of SA were found to be 0.0018 K−1 at 320 K and 0.0075 K−1 at 200 K for LIRTCL and LIRNTCL, respectively. Secondly, the maximum value of SR obtained using LIRTCL was 0.6% K−1 at 240 K, while that obtained using LIRNTCL kept decreasing gradually from 1.14% K−1 at 200 K to 0.28% K−1 at 440 K. All obtained values are listed in Table 2, along with the reported phosphates systems. As can be seen, the sensing sensitivity of our sample based on non-thermal coupled levels is relatively high, indicating that NSPO:Er,Yb is more suitable for temperature sensing applications.
| System | T range (K) | LIR | SA (K−1) | SR (% K−1) | Ref. |
|---|---|---|---|---|---|
| NaSrPO4:Er/Yb | 298–573 | 2H11/2 → 4I15/2/4S3/2 → 4I15/2 | 0.0052 | 1.78 (298 K) | 18 |
| NaZnPO4:Er/Yb | 303–753 | 2H11/2 → 4I15/2/4S3/2 → 4I15/2 | 0.0049 | 1.22 (303 K) | 46 |
| Ca3(PO4)2:Er/Yb | 300–473 | 2H11/2 → 4I15/2/4S3/2 → 4I15/2 | — | 0.34 (300 K) | 47 |
| Na3Y(PO4)2:Er/Yb | 320–670 | 2H11/2 → 4I15/2/4S3/ 2→ 4I15/2 | 0.0027 | 1.1 (313 K) | 48 |
| Na3Y(PO4)2:Er/Yb | 320–670 | 4F9/2 → 4I15/2/2H11/2 → 4I15/2 | 0.16 | 0.8 (313 K) | 48 |
| K3Y(PO4)2:Er/Yb | 293–553 | 4F9/2 → 4I15/2/2H11/2 → 4I15/2 | 0.0044 | 0.86 (293 K) | 49 |
| Sr3(PO4)2:Er/Yb | 303–623 | 2H11/2 → 4I15/2/4S3/2 → 4I15/2 | 0.0070 | 0.88 (303 K) | 50 |
| GdPO4:Er/Yb | 293–673 | 2H11/2→4I15/2/4S3/2 → 4I15/2 | — | 0.74 (298 K) | 51 |
| ZrSc(WO4)2PO4:Er/Yb | 298–573 | 2H11/2 → 4I15/2/4S3/2 → 4I15/2 | 1.12 | 1.10 (298 K) | 52 |
| Na2SrP2O7:Er/Yb | 200–440 | 2H11/2 → 4I15/2/4S3/2 → 4I15/2 | 0.002 | 0.6 (240 K) | This work |
| Na2SrP2O7:Er/Yb | 200–440 | 2H11/2 → 4I15/2/4F9/2 → 4I15/2 | 0.0075 | 1.14 (200 K) | This work |
Another important parameter related to temperature sensitivity is temperature uncertainty (δT).51,52 This parameter indicates the smallest temperature change that can be detected. It depends on the performance of the system and experimental setup. δT can be determined by using the following equation:53
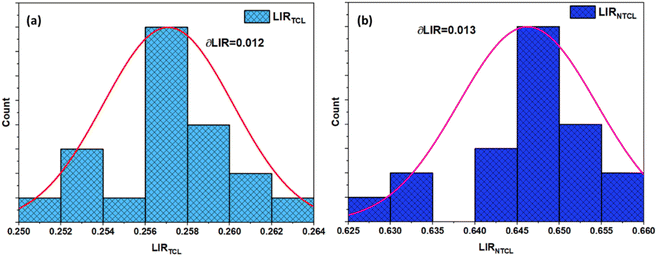
Fig. 10 shows the temperature uncertainty based on the LIRTCL and LIRNTCL of NSPO:Er, Yb at different temperatures. Based on the LIRTCL method, the minimum temperature uncertainty obtained was about 1.31 K at 320 K; whereas based on the LIRNTCL method, the minimum δT was 0.34 K at 200 K. Thus, it is clearly seen that the δT value of the optical thermometer obtained using the LIRNTCL technique is lower than that obtained using the LIRTCL technique.
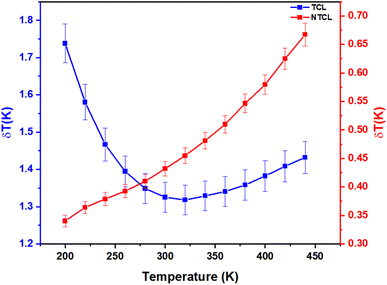 | ||
| Fig. 10 Temperature uncertainty values δT of LIRTCL and LIRNTCL. The error bars indicate uncertainties due to experimental acquisition and data analysis. | ||
4. Conclusions
In this study, we successfully synthesized Na2SrP2O7:Er3+/Yb3+ phosphors via the solid-state method and explored their potential for optical thermometry in the 200–440 K temperature range under 980 nm excitation. The upconversion luminescence properties of these phosphors were thoroughly analyzed using the LIR method, considering both TCL and NTCL energy levels. The calculated maximum SA and SR values demonstrated that these materials exhibit strong temperature-dependent luminescence suitable for precise temperature sensing. Notably, the comparison between the LIRTCL and LIRNTCL methods revealed that the LIRNTCL technique provides a lower minimum δT, reaching 0.34 K at 200 K, compared to 1.31 K at 320 K for the LIRTCL technique. This indicates that the LIRNTCL method offers superior resolution and accuracy for optical temperature sensing. Overall, the Na2SrP2O7:Er3+/Yb3+ phosphors display excellent temperature sensitivity, high resolution, and versatility, making them highly promising candidates for advanced optical thermometry applications. These findings contribute to the development of more reliable and precise non-contact temperature sensing technologies, with potential applications in both scientific research and industrial environments.Data availability
All data underlying the results are available as part of the article, and no additional source data are required.Conflicts of interest
There are no conflicts to declare.References
- X. Wang, X. G. Kong, Y. Yu, Y. J. Sun and H. Zhang, J. Phys. Chem. C, 2007, 111, 15119–15124 CrossRef CAS.
- N. Rakov and G. S. Maciel, Dalton Trans., 2014, 43, 16025–16030 RSC.
- J. Zhang, J. Chen and Y. Zhang, Inorg. Chem. Front., 2020, 7, 4892–4901 RSC.
- Y. Zi, Z. Yang, Z. Xu, X. Bai, A. Ullah, I. Khan, A. Ali Haider, J. Qiu, Z. Song, Y. Wang and Y. Cun, J. Alloys Compd., 2021, 880, 160156 CrossRef CAS.
- A. A. Kalinicheva, M. A. Kurochkina, A. Y. Kolomytseva, R. S. Khasbievab, E. Yu Kolesnikovc, E. Lähderantad and I. E. Kolesnikova, Opt. Mater., 2019, 90, 200–207 CrossRef.
- X. Wang, O. S. Wolfbeis and R. J. Meier, Chem. Soc. Rev., 2013, 42, 7834–7869 RSC.
- Y. Tu, S. Zhao, D. He, T. Wu, H. Zhang, R. Lei, L. Huang and S. Xu, J. Mater. Chem., 2018, 6, 7063–7069 CAS.
- F. Vetrone, R. Naccache, A. Zamarrón, A. Juarranz de la Fuente, F. Sanz-Rodríguez, L. Martinez Maestro, E. Martín Rodriguez, D. Jaque, J. García Solé and J. A. Capobianco, ACS Nano, 2010, 4, 3254–3258 CrossRef CAS.
- C. D. S. Brites, A. Millán and L. D. Carlos, Handbook on the Physics and Chemistry of Rare Earths, 2016, vol. 49, pp. 339–427 Search PubMed.
- C. Zaldo, Lanthanide-Based Multifunctional Materials, 2018, pp. 335–379 Search PubMed.
- M. Dramicanin, Luminescence Thermometry: Methods, Materials, and Applications, 2018 Search PubMed.
- D. Sevic, M. S. Rabasovic, M. G. Nikolic, J. Križan, S. Savic-Sevic and B. P. Marinkovic, Opt. Quantum Electron., 2022, 54, 523 CrossRef CAS.
- G. Bao, K. L. Wong, D. Jin and P. A. Tanner, Light:Sci. Appl., 2018, 7, 96 CrossRef PubMed.
- Y. Cheng, Y. Gao, H. Lin, F. Huang and Y. Wang, J. Mater. Chem., 2018, 6, 7462–7478 CAS.
- L. Xing, R. Ao, Y. Liu and W. Yang, Spectrochim, Spectrochim. Acta, Part A, 2019, 222, 117159 CrossRef CAS PubMed.
- M. Ding, M. Zhang and C. Lu, Mater. Lett., 2017, 209, 52–55 CrossRef CAS.
- S. K. Ranjan, M. Mondal and V. K. Rai, Mater. Res. Bull., 2018, 106, 66–73 CrossRef CAS.
- J. Xing, F. Shang and G. Chen, Ceram. Int., 2021, 47, 8330–8337 CrossRef CAS.
- F. Ayachi, K. Saidi, W. Chaabani and M. Dammak, J. Lumin., 2021, 240, 118451 CrossRef CAS.
- K. Saidi, C. Hernández-Alvarez, M. Runowski, M. Dammak and I. R. Martín Benenzuela, ACS Appl. Nano Mater., 2023, 6, 19431–19442 CrossRef CAS.
- K. Saidi, I. Kachou, K. Soler-Carracedo, M. Dammak and I. R. Martín, ACS Appl. Nano Mater., 2023, 6, 17681–17690 CrossRef CAS.
- R. Bao, N. An, L. Ye and L. G. Wang, Opt. Fiber Technol., 2019, 52, 101989 CrossRef CAS.
- S. Li, W. Wang, X. Wei, L. Li, Q. Zhang, Y. Li and Y. Pan, Opt. Mater., 2021, 113, 110840 CrossRef CAS.
- Y. Li, W. Wang, Y. Pan, H. Chen, Q. Cao and X. Wei, CrystEngComm, 2020, 22, 6302–6309 RSC.
- L. Li, W. Wang, H. Chen, S. Li, Q. Zhang, Y. Pan and Y. Li, J. Non-Cryst. Solids, 2021, 573, 121142 CrossRef CAS.
- L. Mukhopadhyay and V. Kumar Rai, New J. Chem., 2017, 41, 7650–7661 RSC.
- A. K. Bedyal, V. Kumar and H. C. Swart, J. Alloys Compd., 2020, 845, 156352 CrossRef CAS.
- M. Fhoula, T. Koubaa and M. Dammak, Opt. Laser Technol., 2020, 130, 106352 CrossRef CAS.
- T. Chengaiah, C. K. Jayasankar, A. M. Babu and L. R. Moorthy, Mater. Express, 2014, 4, 153–158 CrossRef CAS.
- W. Liu, X. Wang, Q. Zhu, X. Li, X. Sun and J. G. Li, Sci. Technol. Adv. Mater., 2019, 20, 949–963 CrossRef CAS PubMed.
- T. Zheng, L. Zhou, X. Qiu, D. Yang, M. Runowski, S. Lis, P. Du and L. Luo, J. Lumin., 2020, 227, 117517 CrossRef CAS.
- K. Saidi and M. Dammak, J. Solid State Chem., 2021, 300, 122214 CrossRef CAS.
- O. Ajili1, B. Louati1 and K. Guidara, J. Mater. Sci.: Mater. Electron., 2018, 29, 8649–8659 CrossRef.
- O. Ajili, B. Louati and K. Guidara, Indian J. Phys., 2018, 92, 875–881 CrossRef CAS.
- C. Ming and M. Pei, J. Mod. Opt., 2019, 66, 1956–1960 CrossRef CAS.
- X. Cheng, X. Dong, K. Peng, H. Zhang, Y. Su and L. Jiang, J. Electron. Mater., 2020, 49, 518–523 CrossRef CAS.
- P. Gao, X. Li, Y. Gong, G. Shen, S. Zhang and L. Guan, J. Rare Earths, 2019, 37, 937–942 CrossRef CAS.
- P. Singh, N. Jain, S. Shukla, A. Kumar Tiwari, K. Kumar, J. Singh and A. C. Pandey, RSC Adv., 2023, 13, 2939 RSC.
- X. Huang, K. Huang, L. Chen, N. Chen, R. Lei, S. Zhao and S. Xua, Opt. Mater., 2020, 107, 110114 CrossRef CAS.
- S. A. Wade, S. F. Collins and G. W. Baxter, Fluorescence intensity ratio technique for optical fiber point temperature sensing, J. Appl. Phys., 2003, 94, 4743 CrossRef CAS.
- W. Xu, H. Zhao, Z. Zhang and W. Cao, Sens. Actuators, B, 2013, 178, 520–524 CrossRef CAS.
- L. Li, Y. Zhou, F. Qin, Y. Zheng, H. Zhao and Z. Zhang, Opt. Lett., 2017, 42, 4837–4840 CrossRef CAS.
- X. Wang, J. Zheng, Y. Xuan and X. Yan, Opt. Express, 2013, 21, 21596–21606 CrossRef CAS.
- Q. Han, H. Hao, J. Yang, Z. Sun, J. Sun, Y. Song, Y. Wang and X. Zhang, J. Alloys Compd., 2019, 786, 770–778 CrossRef CAS.
- I. Porosnicu, C. Colbea, F. Baiasu, M. Lungu, M. Cosmin Istrate, D. Avram and C. Tiseanu, Methods Appl. Fluoresc., 2020, 8, 035005 CrossRef CAS.
- Y. Chen, X. Y. Liu, G. H. Chen, T. Yang, C. L. Yuan, C. R. Zhou and J. W. Xu, J. Mater. Sci.: Mater. Electron., 2017, 28, 15657–15662 CrossRef CAS.
- K. M. Krishnaa, S. P. Tiwarib, A. Kumara and K. Kumar, Sens. Actuators, A, 2020, 315, 112302 CrossRef.
- P. Khajuria, A. K. Bedyal, M. Manhas, H. C. Swart, F. Durani and V. Kumar, J. Alloys Compd., 2021, 877, 160327 CrossRef CAS.
- J. Zhang, Y. Zhang and X. Jiang, J. Alloys Compd., 2018, 748, 438–445 CrossRef CAS.
- T. Zheng, L. Zhou, X. Qiu, D. Yang, M. Runowski, S. Lis and L. Luo, J. Lumin., 2020, 227, 117517 CrossRef CAS.
- S. Mohanty, J. García-Balduz, A. Alıcı, S. Premcheska, M. Lederer, A. Skirtach, K. Van Hecke and A. M. Kaczmarek, ACS Appl. Mater. Interface, 2024, 16, 57580–57595 CrossRef CAS.
- J. Liao, Z. Han, F. Lin, B. Fu, G. Gong, H. Yan, H. Huang, H. R. Wen and B. Qiu, Inorg. Chem., 2023, 62, 9518–9527 CrossRef CAS.
- Z. Liu, Y. Li, X. Zhao, E. Y. B. Pun and H. Lin, New J. Chem., 2023, 47, 7263–7277 RSC.
- J. F. C. B. Ramalho, S. F. H. Correia, L. S. Fu, L. L. F. António, C. D. S. Brites, P. S. André, R. A. S. Ferreira and L. D. Carlos, Adv. Sci., 2019, 6, 1900950 CrossRef CAS.
- K. Zhu, Z. Wang, H. Xu and Z. Fu, Adv. Opt. Mater., 2022, 10, 2201182 CrossRef CAS.
| This journal is © The Royal Society of Chemistry 2024 |

