 Open Access Article
Quantitative relationship between surface chemistry of graphene and compatibility with rubbers established by two-dimensional solubility parameters†
Ruixin Wanga,
Ruining Yanga,
Zhuohang Renb,
Bo Zhanga,
Qingchuang Lub,
Maojie Yib and
Yanlong Luo *b
*b
aAVIC Manufacturing Technology Institute, Beijing 100024, China
bCollege of Science, Nanjing Forestry University, Nanjing 210037, China. E-mail: luoyanlong@njfu.edu.cn
First published on 10th December 2024
Abstract
Hildebrand (δT) and Hansen (δD, δP, δH) solubility parameters are important indexes to predict the compatibility of components intuitively. Currently, almost all the experiments only measured the solubility parameters of the pristine graphene. Therefore, there is a lack of quantitative relationship between the surface chemistry of graphene and solubility parameters, resulting in no theoretical guidance for the surface modification of graphene. In this work, three-dimensional Hansen solubility parameters are converted to two-dimensional solubility parameters. Hildebrand and two-dimensional solubility parameters of six functionalized graphene as a function of grafting ratio are calculated by molecular dynamics (MD) simulation. Interestingly, if the functional group is at the edge of graphene, the δT decreases with the increase of the grafting ratio, whereas if the functional group is in the plane of graphene, the δT decreases first and then increases with grafting ratio. Two-dimensional solubility parameters are proved to be a good predictor of the compatibility between functionalized graphene and rubbers. The quantitative relationship between the surface chemistry of graphene and compatibility with rubbers based on two-dimensional solubility parameters is constructed. The optimum grafting ratio corresponding to the best compatibility is given. Finally, the effect of temperature on the compatibility behaviors of graphene/rubber mixtures is elucidated.
1 Introduction
Graphene is considered to be an ideal filler for the rubber industry due to its extremely high specific surface area, thermal and electrical conductivity.1–3 The graphene–rubber interactions and the dispersion of graphene in the matrix are two key factors affecting the properties of graphene/rubber composites.4 From a thermodynamic point of view, the compatibility of graphene and rubber plays a key role in the above two factors.5 Since pristine graphene is neither hydrophilic nor oleophilic, the compatibility of pristine graphene and rubber is poor. Therefore, it is necessary to modify the surface chemistry of graphene to improve the thermodynamic compatibility of graphene and rubber. One of the most commonly used methods for the preparation of graphene is the oxidation–reduction method. The introduction of oxygen-containing groups (such as hydroxyl, carboxyl, epoxide groups, etc.) by the oxidation–reduction method is unavoidable.6–8 These oxygen-containing groups provide the possibility for the modification of graphene. At present, there are some mature modification methods to prepare aminoacylated,9 carboxylated,10 sulfhydrated,11,12 alkylated,13 and silanized graphene.14The most commonly used index to predict the thermodynamic compatibility of two components is the solubility parameter proposed and developed by Joel Henry Hildebrand and Charles M. Hansen.15–17 The thermodynamic theory of mixing shows that the miscibility of two components is related to their cohesion energy density (CED), and the CED is the cohesion energy per unit volume (Ecoh/V).18 The Hildebrand solubility parameter (δT) is defined as the square root of CED. Charles M. Hansen divides cohesion energy into dispersion (Ecoh,D), polarity (Ecoh,P), and hydrogen bonding (Ecoh,H) interactions:17
 | (1) |
Therefore, the Hansen solubility parameters (δi, i = D, P, H) are proposed:
 | (2) |
Then the relation between Hildebrand and Hansen solubility parameters is as follows:
| δT2 = δD2 + δP2 + δH2 | (3) |
Generally, the Hildebrand solubility parameter is a good predictor for the compatibility of non-polar systems, while the Hansen solubility parameter is proved to be more suitable for the judgment of the compatibility of polar systems.17 Besides, in the past decade, some studies have reported the solubility parameters of carbon materials (graphene,19 carbon nanotube,20,21 fullerenes,22 etc.), and the compatibility between carbon materials and polymers is well predicted by solubility parameters.21–23 Such as, Hernandez et al.19 measured the solubility parameters of graphene through dissolution experiments: δT = 23 MPa1/2, δD = 18 MPa1/2, δP = 9.3 MPa1/2, and δH = 7.7 MPa1/2. To solve the problem of poor compatibility between graphene and polyvinylidene fluoride (PVDF), Zhu et al.24 used polyimide (PI) and polyaniline (PANI) to modify reduced graphene oxide (RGO), respectively, and measured Hansen solubility parameters of functionalized RGO. Further research shows that the matching of Hansen solubility parameters is crucial for the dielectric and dynamic mechanical properties of RGO/PVDF composites. To the best of our knowledge, although some experiments have measured the solubility parameters of functionalized graphene, the quantitative relationship between functional groups and the solubility parameters of graphene is still lacking due to the limitations of modification and characterization methods.25–27 Therefore, the current surface modification of graphene relies on trial and error method, and there is no new theory to guide the interface design of high-performance graphene/rubber composites.
Alternatively, molecular dynamics (MD) simulation based on Newton's laws of motion is already a powerful computational tool that can provide an important means for understanding and predicting the behaviors/properties of materials.28–31 In the field of polymer composites, MD simulation can be used to study the mechanical, thermal, and electrical properties of polymers (e.g., natural rubber, styrene butadiene rubber, polyethylene, epoxy) composites filled with graphene.32,33 Compared with experimental methods, MD simulation can easily and cheaply establish quantitative relationships between the structure and properties of materials. Such as the experimental measurement of solubility parameters requires dozens of solvents and consumes a lot of time,23 but the research cost and time can be greatly reduced by MD simulation.34 Especially, with the improvement of the force field precision, the solubility parameters of small molecules, polymers, and carbon materials calculated by MD simulation have been in good agreement with the experimental values.34–36 Therefore, MD simulation is expected to be an effective method to explore the relationship between functional groups and solubility parameters of graphene. Besides, MD simulation is expected to be a powerful means to establish the quantitative relationship between surface chemistry of graphene and compatibility with polymers.
In this work, three-dimensional Hansen solubility parameters were converted to two-dimensional solubility parameters based on the force field method. Six functionalized graphene models were constructed by introducing six functional groups (phenyl isocyanate, 1-hexyl isocyanate, aniline, 1-octadedecylamine, 2-mercaptoethylamine, and 3-mercaptopropionic acid). Then the effect of grafting ratio on Hildebrand and two-dimensional solubility parameters of functionalized graphene was investigated by MD simulation. Whether two-dimensional solubility parameters can effectively predict the compatibility between graphene and rubbers with different polarities was studied based on the Flory–Huggins lattice model. The functionalization principle and the optimal grafting ratio of graphene for graphene/rubber mixtures were further explored. Additionally, the effect of temperature on the compatibility behaviors of graphene/rubber mixtures was elucidated.
2 Methodology
2.1 Energy and two-dimensional solubility parameters
In MD simulation, the ab initio Condensed-phase Optimized Molecular Potentials for Atomistic Simulation Studies (COMPASS) force field is one of the most widely used force fields for calculating solubility parameters of polymers and carbon materials.28,37,38 The simulated results based on COMPASS force field have been widely proved to be in good agreement with the experimental values. Therefore, the solubility parameters of graphene and rubbers are also calculated using the COMPASS force field in this work. In the COMPASS force field, the potential energy of a system (Etotal) can be expressed as a sum of valence (Evalence), cross term (Ecrossterm), and nonbond (Enonbond) interactions:39| Etotal = Evalence + Ecrossterm + Enonbond | (4) |
The valence interactions are generally accounted for by bond stretching, valence angle bending, dihedral angle torsion, out-of-plane interactions, and Urey-Bradley terms. The cross term is introduced to account for such factors as bond or angle distortions caused by nearby atoms so that higher accuracy can be achieved. The energy of interactions between nonbonded atoms (Enonbond) is accounted for by van der Waals also known as dispersion (EvdW) and electrostatic (Eelec) terms:
| Enonbond = EvdW + Eelec | (5) |
 | (6) |
 | (7) |
So far, no force field can accurately express hydrogen bond interactions. Some force fields (such as Dreiding), while giving a separate hydrogen bond term, are based on low-precision empirical or semi-empirical force field parameters.40 Therefore, in order not to sacrifice computational accuracy, the COMPASS force field does not contain a separate hydrogen bond term, but instead merges the polar and hydrogen bond terms into the electrostatic term:
| Eelec = Ecoh,P + Ecoh,H | (8) |
Then the simulated solubility parameters based on the COMPASS force field can be given by
| δT2 = δvdW2 + δelec2 | (9) |
| δelec2 = δP2 + δH2 | (10) |
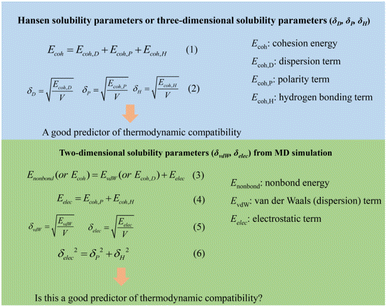
Consequently, three-dimensional Hansen solubility parameters are converted to two-dimensional solubility parameters based on the force field method. We present a chart to show the difference between the two solubility parameters so that readers can better understand, as shown in Fig. 1. Gupta et al.28 successfully predicted the miscibility of pharmaceutical compounds by similar two-dimensional solubility parameters from MD simulation. Lee et al.34 determined two-dimensional solubility parameters of single-walled and double-walled carbon nanotubes using computational simulation. In this work, we calculate two-dimensional solubility parameters of graphene and rubbers by COMPASS force field. Also, whether two-dimensional solubility parameters can predict the compatibility of graphene and rubber is investigated.
2.2 Model and simulation details
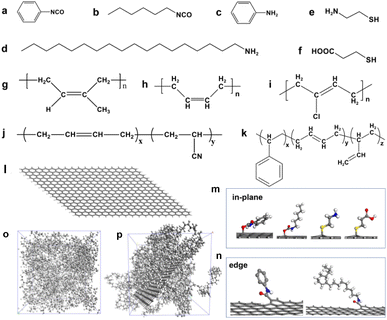
The functionalization of graphene is often achieved through the reaction of oxygen-containing groups on the surface, such as the hydroxyl group in the graphene plane and the carboxyl group at the edge.41 Therefore, according to the reports in the literature,9–13 we selected the modifiers containing isocyanate groups (phenyl isocyanate and 1-hexyl isocyanate) that can react with hydroxyl groups and the modifiers containing amino groups (aniline and 1-octadedecylamine) that can react with carboxyl groups, as shown in Fig. 2a–d. The isocyanate group reacts with the hydroxyl group to form the urethane group, and the carboxyl group reacts with the hydroxyl group to form the ester group. In addition, another popular modification method is to functionalize graphene by click chemistry, so we select modifiers containing mercaptan groups (2-mercaptoethylamine and 3-mercaptopropionic acid) to perform a click chemical reaction with C![[double bond, length as m-dash]](https://www.rsc.org/images/entities/char_e001.gif) C on graphene, as shown in Fig. 2e and f. Notably, it's not how important these groups are, but these chemical modification methods are mature. Therefore, we selected these representative compounds containing isocyanates, amino groups, and thiols to modify graphene. The purpose of our study is not to emphasize how important these groups are for the properties of graphene/rubber composites but to construct a quantitative relationship between functional groups and the compatibility of functionalized graphene and rubbers.
C on graphene, as shown in Fig. 2e and f. Notably, it's not how important these groups are, but these chemical modification methods are mature. Therefore, we selected these representative compounds containing isocyanates, amino groups, and thiols to modify graphene. The purpose of our study is not to emphasize how important these groups are for the properties of graphene/rubber composites but to construct a quantitative relationship between functional groups and the compatibility of functionalized graphene and rubbers.
To investigate the general law for the compatibility of graphene surface chemistry with rubber, five different polarities of rubber were constructed: natural rubber (NR), butadiene rubber (BR), neoprene rubber (CR), nitrile butadiene rubber (NBR), and styrene butadiene rubber (SBR), as shown in Fig. 2g–k. The mass fraction in the MD simulation is the same as that of a commercial NBR (N220S, Japan Synthetic Rubber Co., Ltd) with 41 wt% of acrylonitrile and 59% of butadiene.42 The simulated chemistry structure of SBR with 21.0 wt% of styrene, 47.4 wt% of 1,2-polybutadiene, and 31.6 wt% of 1,4-polybutadiene, which is consistent with that of a commercial SBR (2466, China Petroleum & Chemical Corporation).43 The model of a single graphene with a length of 4.182 nm and a width of 3.690 nm was constructed. The unsaturated boundaries of graphene were terminated by adding hydrogen atoms. The pristine graphene and functionalized graphene are shown in Fig. 2l–n.
Amorphous cells (Cell-1) containing two graphene or functionalized graphene sheets were built to simulate the solubility parameters of graphene or functionalized graphene, as shown in Fig. S1 (ESI).† Amorphous cells (Cell-2) of rubber consisting of 10 chains with 50 repeating units are constructed to calculate the solubility parameters, as shown in Fig. 2o. Amorphous cells (Cell-3) consisting of one graphene or functionalized graphene sheet and 10 rubber chains are constructed to calculate the mixing energy (Emix) and Flory–Huggins parameter (χ), as shown in Fig. 2p. This Cell-3 is constructed according to the following algorithm: the construction algorithm resembles that of a polymerization process, where molecules are “grown” into an empty box fragment by fragment. A fragment corresponds to the substructure of atoms between two rotatable bonds. Amorphous cell automatically detects rotatable bonds along the backbone of the input model. In adding the next fragment, the algorithm probes a number of potential placements. The energy of each placement is evaluated from which the probability of each placement is calculated. Based on the probabilities, one of the candidates is selected, and the fragment is given its final placement. The torsion degrees of freedom in the backbone of input molecules will be determined automatically. The initial temperature is set to 298 K and the initial density is set to 1 g cm−3. The number of segments to consider in growing the chains into the cell is 1. The maximum number of attempts made to load all molecules into the cell is 1000. A test on spearing and catenation is carried out whilst growing the chains into the cell. The number of random positions and orientations to be sampled for the first segment of each molecule is 10. The number of torsions to be sampled for all torsions of each molecule is 10. The number of molecules in the amorphous cell and the initial conditions for the construction of the cell are listed in Table 1.
| Graphene sheet | Rubber chains | Initial density (g cm−3) | Initial temperature (K) | Lattice type | |
|---|---|---|---|---|---|
| Cell-1 | 2 | 0 | 1 | 298 | Cubic |
| Cell-2 | 0 | 10 | 1 | 298 | Cubic |
| Cell-3 | 1 | 10 | 1 | 298 | Cubic |
In MD simulation, three-dimensional periodic boundary conditions are used. The amorphous cell is first geometrically optimized by the Smart method with an energy convergence tolerance of 10−4 kcal mol and a force convergence tolerance of 0.005 kcal mol−1 Å−1. The resulting cell is then subjected to 1 ns NVT (constant number of atoms, volume, and temperature) ensemble simulation at 298 K, followed by 2 ns NPT (constant number of atoms, pressure, and temperature) ensemble simulation at 298 K and 105 Pa, and finally, the equilibrium structure is obtained. The average of the last five frames was calculated to obtain the values of δT and χ. In the simulation, the time step is 1 fs and the cutoff radius of the van der Waals interaction is 1.25 nm. The Ewald method was used to calculate the electrostatic interactions with an accuracy of 1.0 × 10⁻⁴ kcal mol−1 and a buffer width of 0.5 Å. The Berendsen barostat was used to control pressure, and the Nosé–Hoover thermostat was used to control temperature. The pressure is applied isotropically to the systems. The value used to scale the fictitious mass, Q, of the Nosé–Hoover thermostat is 0.01. The coupling constant is 1 ps for both Berendsen barostat and Nosé–Hoover thermostat. All modeling and simulations were operated using Materials Studio software with COMPASS force field.
Cell-1 is the amorphous cell of graphene or functionalized graphene. Cell-2 is the amorphous cell of rubbers. Cell-3 is the amorphous cell of graphene/rubber mixtures.
To verify the reliability of the simulation method and results, the simulated density (ρ) and solubility parameters were compared with the experimental values, as shown in Table 2. It can be seen that the simulated ρ and δT of rubbers are in good agreement with the experimental values. However, the simulated δT = 29.2 MPa1/2 shows some difference from the experimental δT = 23.0 MPa1/2 for graphene. It is worth noting that we construct a monolayer of graphene without any oxygen-containing group and defect in simulation. Nevertheless, the dissolution experiment of graphene found that even if the best solvent (N-methyl-2-pyrrolidone, NMP) was used to dissolve graphene, the number fraction of single-layer graphene was only 29%, and the maximum number of layers of graphene was 16.19 Besides, the graphene prepared by existing methods is almost impossible to avoid the existence of defects and functional groups. Therefore, we speculate that the reasons for the difference between the simulated and experimental δT are as follows: (1) defects, (2) functional groups, and (3) number of graphene layers.
| δT,s (MPa1/2) | δvdW,s (MPa1/2) | δelec,s (MPa1/2) | δT,e (MPa1/2) | ρs (g cm−3) | ρe (g cm−3) | Ref. | |
|---|---|---|---|---|---|---|---|
| a Subscript s represents the simulated value and subscript e represents the experimental value. | |||||||
| NR | 16.3 | 15.8 | 1.1 | 16.5 | 0.93 | 0.92–0.95 | 17 |
| BR | 16.6 | 15.4 | 0.9 | 16.5 | 0.90 | 0.90–0.92 | 17 |
| SBR | 16.9 | 16.2 | 2.2 | 16.7 | 0.97 | 0.95–1.00 | 17 |
| NBR | 20.8 | 18.5 | 8.0 | 21.1 | 1.04 | 1.06 | 17 |
| CR | 19.3 | 17.8 | 5.2 | 19.0 | 1.22 | 1.23–1.25 | 17 |
| Pristine graphene | 29.2 | 28.1 | 0.02 | ∼23.0 | 19 | ||
The best-known theory of the thermodynamics of mixing and phase separation in binary systems is the Flory–Huggins lattice model.44,45 In the Flory–Huggins lattice model, the χ of the binary system can be calculated by MD simulation to characterize the compatibility of graphene and rubber:
 | (11) |
 | (12) |
3 Results and discussion
3.1 Validation of models and methods
To further verify the validity of the model and method, different simulation results are compared in different cell sizes, simulation times, and initial conditions. To verify whether the system reached convergence after the simulation of 2 ns, we extended the simulation time to 10 ns. The resulting δT of NR and pristine graphene as well as the χ value of graphene/NR mixture are presented in Fig. S2 (ESI).† The results indicate that the δT and χ do not change even if the time is extended from 2 ns to 10 ns. That is, these systems have converged after a 2 ns simulation. Besides, the energy, density, and temperature as a function of time within 10 ns are given for natural rubber, graphene, and graphene/NR mixture, as shown in Fig. S3–S5 (ESI).† Generally, if the fluctuation of energy, density, and temperature is within 10%, the system is considered to have reached convergence. As a result, the systems reach convergence after the simulation of the NPT ensemble for 2 ns.The different initial conditions are listed in Table S1 (ESI)† and the simulation results are listed in Table S2 (ESI).† For example, in initial condition 1, the initial density is set to 0.6 g cm−3, and Berendsen barostat and Nose–Hoover thermostat are employed. The simulated results are much lower than the experimental values. Compared with the experimental δT, it is found that the simulation δT using initial condition 2 is inferior to that using initial condition 3, so the simulation in this manuscript is based on initial condition 3.
To consider the system size effect, we doubled the number of molecules in the system listed in Table 1 and kept the other simulation conditions unchanged. The number of molecules in the extended system is listed in Table S3 (ESI),† and the simulated results are shown in Fig. S6 (ESI).† The solubility parameters of pristine graphene and rubbers are constant even though the number of molecules has doubled. Although the χ value of 3-mercaptopropionic acid functionalized graphene/NR mixtures increases with the number of molecules, the changing trend of χ is the same. In summary, the size effect does not affect the trend.
3.2 Solubility parameters of functionalized graphene
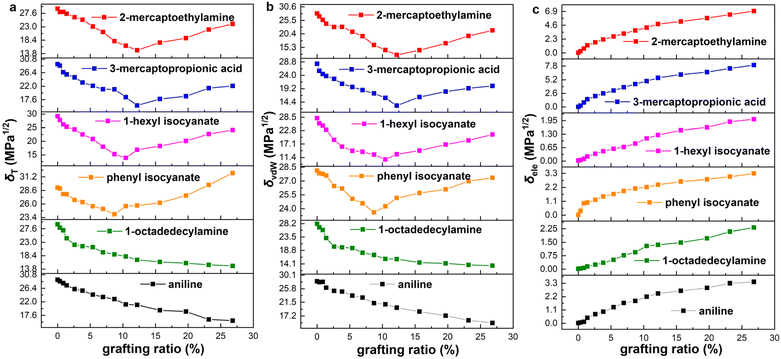
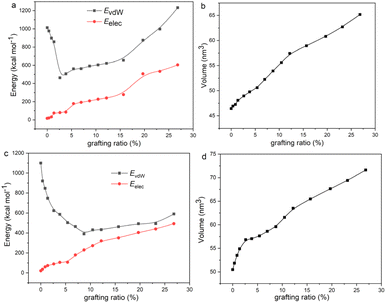
The solubility parameters of six functionalized graphene as a function of grafting ratio are shown in Fig. 3. The grafting ratio is defined as the percentage of the number of functional groups to the number of carbon atoms (574) on the graphene. According to reports in the literature,46 the oxygen content of graphene oxide prepared by the modified Hummers' method is between 25% and 45%. In the simulation, the maximum grafting ratio is 26.8% and the highest oxygen content is 27.2%. Therefore, the simulated grafting ratio and oxygen content are reasonable. Strikingly, if the functional group (aniline and 1-octadedecylamine) is at the edge of graphene, the δT decreases with the increase of the grafting ratio, whereas if the functional group (phenyl isocyanate, 1-hexyl isocyanate, 3-mercaptopropionic acid and 2-mercaptoethylamine) is in plane of graphene, the δT decreases first and then increase with grafting ratio. The change of δT and δvdW is consistent with the grafting ratio. Besides, the δele increases with the increase of grafting ratio. We present the δelec on the same ordinate scale for a more intuitive comparison of the magnitude, as shown in Fig. S7 (ESI).† The magnitude of the δele is as follows: 3-mercaptopropionic acid > 2-mercaptoethylamine > phenyl isocyanate > aniline > 1-octadedecylamine > 1-hexyl isocyanate. To save space, functionalized graphene is described here with modifiers. Besides, current experimental means may be able to prepare several modified graphene with different grafting ratios, but it is not possible to precisely prepare all the modified samples shown in Fig. 3. Since the existence of oxygen-containing functional groups in graphene is inevitable, it is difficult to exclude the effect of such oxygen-containing functional groups when we study the quantitative relationship between grafting ratio and solubility parameters. As a result, we cannot quantitatively obtain the quantitative relationship between grafting ratio and solubility parameters by experimental means. MD simulation can accurately construct functionalized graphene with different groups and different grafting ratios and exclude the inevitable effect of oxygen-containing functional groups in experiments. Therefore, our study aims to theoretically provide the quantitative relationship between different functional groups/grafting ratios and solubility parameters through MD simulation. This is also the significance of our study. It is hoped that the effectiveness of our simulation can be verified after the experimental preparation and characterization methods are more mature.To explain the variation trend of δvdw and δelec, we give the EvdW and Eelec of 2-mercaptoethylamine and aniline functionalized graphene as a function of the grafting ratio, as shown in Fig. 4a and c. In addition, the volume changes of the two systems with grafting ratio are shown in Fig. 4b and d. For the 2-mercaptoethylamine functionalized graphene, the EvdW first decreases and then increases. For the aniline functionalized graphene, the EvdW decreases first and then increases slowly. Both Eelec and V of the two systems increase with grafting ratio. The decrease of Evdw and the increase of V cause the δvdW of two systems to decrease within a certain grafting ratio. Above a certain grafting ratio, the δvdw of 2-mercaptoethylamine functionalized graphene increases, while the δvdw of aniline functionalized graphene decreases. The variation of δvdw can be inferred from the following equation:
 | (13) |
Reasonably, the π–π interactions between graphene sheets decrease as the grafting ratio increases due to the continuous conversion of sp2 hybrid carbon atoms to sp3 hybrids. We would like to give the law of π–π interactions with grafting ratio, but no molecular force field has been able to calculate the π–π interactions so far. Therefore, the reason why the solubility parameter changes with the grafting ratio is also based on the speculation of van der Waals and electrostatic interactions. We analyze the reasons for the solubility parameter variation with grafting ratio as follows: In the graphene system, the EvdW consists of the π–π stacking interactions (Eπ–π) and other van der Waals interactions besides the Eπ–π (which we call the regular van der Waals interaction, EvdW,r).
| EvdW = Eπ−π + EvdW,r | (14) |
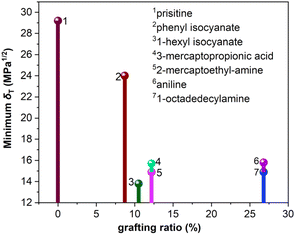
It is worth noting that the minimum δT of functionalized graphene is a very important parameter, which determines the closeness of the solubility parameter of graphene and rubber. The minimum δT and corresponding grafting ratio for different functional groups are shown in Fig. 5. It can be seen that the solubility parameters of phenyl isocyanate, 1-hexyl isocyanate, aniline, 1-octadedecylamine, 2-mercaptoethylamine, and 3-mercaptopropionic acid functionalized graphene decreased by 17.8%, 52.7%, 45.9%, 50.0%, 50.0% and 46.2%, respectively, compared to the solubility parameter of pristine graphene. This shows that the effect of functional groups on solubility parameters is significant. Besides, the minimum δT of functionalized graphene and the δT of rubbers are ordered from high to low value, as listed in Table 3. This order determines the thermodynamically compatible behavior of functionalized graphene and rubber, which will be further elaborated in the next section.
| Samples | δT (MPa1/2) |
|---|---|
| Phenyl isocyanate | 24.0 |
| NBR | 20.8 |
| CR | 19.3 |
| SBR | 16.9 |
| BR | 16.6 |
| NR | 16.3 |
| Aniline | 15.8 |
| 3-Mercaptopropionic acid | 15.7 |
| 2-Mercaptoethylamine | 14.9 |
| 1-Octadedecylamine | 14.9 |
| 1-Hexyl isocyanate | 13.8 |
3.3 Compatibility of functionalized graphene and rubbers
Two-dimensional solubility parameters of rubber and graphene have been obtained. Next, we want to know if two-dimensional solubility parameters can predict the thermodynamic compatibility of graphene and rubber. According to the thermodynamics of mixing, the compatibility of two components is determined by the Gibbs free energy of mixing (ΔGM):| ΔGM = ΔHM − TΔSM | (15) |
 | (16) |
| ΔHM = (δT,A − δT,B)2φA(1 − φA)VM | (17) |
 | (18) |
This formula states that the closer δT,A and δT,B are to each other, the smaller χ is. Charles M. Hansen replaced the Hildebrand solubility parameter with the Hansen solubility parameter as follows:17
 | (19) |
Then, an R0 parameter is proposed to describe the closeness of the solubility parameters:
 | (20) |
The smaller the R0 value, the closer the solubility parameters, and the better the compatibility of A and B components. In our study, two-dimensional solubility parameters were substituted for three-dimensional Hansen solubility parameters. Similarly, an R parameter is proposed to describe the closeness of the two-dimensional solubility parameters:
 | (21) |
Therefore, to explore whether two-dimensional solubility parameters are good predictors of graphene and rubber compatibility, R and χ need to be compared. If R and χ have the same trend, it shows that two-dimensional solubility parameters are a good predictor of compatibility, but the opposite is not.
We investigated the correlation of R and χ with grafting ratio for 30 graphene/rubber mixtures (six functionalized graphene and five rubbers), as shown in Fig. 6 and S8–S12 (ESI).† It was found that R and χ had the same variation trend with grafting ratio, which proved that two-component solubility parameters can predict the compatibility of functionalized graphene and rubber well. Besides, interestingly, the curve of R with grafting ratio shows two different shapes (V-shape and W-shape). That is, the graphene and rubber mixtures exhibit two thermodynamically compatible behaviors, as listed in Table 4. For example, for aniline and 1-octadedecylamine functionalized systems (the δT decreases with grafting ratio), the δT of functionalized graphene is closest to that of rubber at a certain grafting ratio. Therefore, there is a minimum value for the curve of R with grafting ratio, that is, V-shape. For phenyl isocyanate, 1-hexyl isocyanate, 3-mercaptopropionic acid, and 2-mercaptoethylamine functionalized systems, the δT decreases first and then increases with grafting ratio. Therefore, If the minimum δT of graphene is greater than the δT of rubber, then the minimum δT is the closest to the δT of rubber. That is, there is only one minimum value for the curve of R with grafting ratio, and the curve is V-shaped. If the minimum δT of graphene is less than δT of rubber, there are two grafting ratios at which the δT of graphene and the δT of rubber are the closest. Therefore, there are two minima for the curve of R with grafting ratio, that is, W-shape.
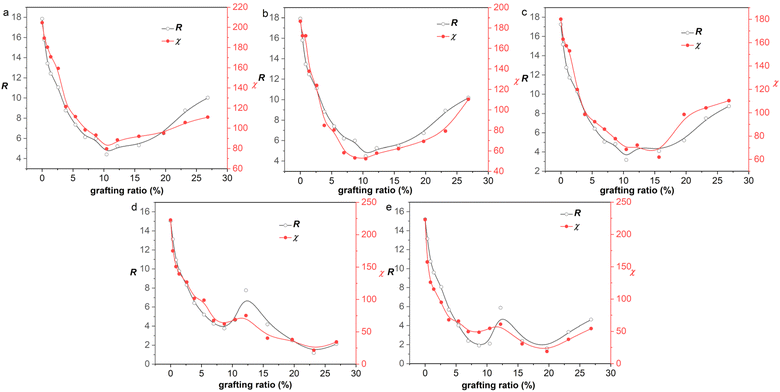 | ||
| Fig. 6 R and χ of 3-mercaptopropionic acid functionalized graphene/rubber mixtures with the grafting ratio: (a) NR, (b) BR, (c) SBR, (d) NBR, and (e) CR. | ||
| NR | BR | SBR | NBR | CR | |
|---|---|---|---|---|---|
| a V means the curve of R or χ as a function of grafting ratio is V-shaped and W means the curve is W-shaped. | |||||
| Aniline | V | V | V | V | V |
| 1-Octadedecylamine | V | V | V | V | V |
| Phenyl isocyanate | V | V | V | V | V |
| 1-Hexyl isocyanate | W | W | W | W | W |
| 3-Mercaptopropionic acid | V | V | W | W | W |
| 2-Mercaptoethylamine | W | W | W | W | W |
The conclusions in Fig. 6 and Table 4 illustrate the following two points: (1) the trend of R and χ values with the grafting ratio is consistent, indicating that the two-component solubility parameters can well predict the compatibility of graphene and rubbers; (2) different graphene/rubber mixtures exhibit different compatibility behaviors with the grafting ratio, which may be V-shape or W-shape.
According to the eqn (11), the χ originates from the Emix. That is, exploring the reason for the variation of χ with grafting ratio (V-shape or W-shape) is to investigate the reason for the variation of Emix with grafting ratio. The nonbond interactions in the COMPASS force field are the sum of the electrostatic and van der Waals interactions. Therefore, Emix is also divided into van der Waals components (Emix,vdW) and electrostatic components (Emix,elec).
| Emix = Emix,vdW + Emix,elec | (22) |
To show why there is such a trend of V-shape or W-shape, the Emix and its corresponding Emix,vdW and Emix,elec with grafting ratio for 1-hexyl isocyanate functionalized graphene/NR mixture, 3-mercaptopropionic acid functionalized graphene/NR mixture and 3-mercaptopropionic acid functionalized graphene/NBR mixture are given, as shown in Fig. 7. The change of Emix with grafting ratio is W-shaped for 1-hexyl isocyanate functionalized graphene/NR mixture. The change of Emix with grafting ratio is V-shaped for 3-mercaptopropionic acid functionalized graphene/NR mixture. The change of Emix with grafting ratio is W-shaped for 3-mercaptopropionic acid functionalized graphene/NBR mixture. It can be seen that for either mixture, Emix,vdW is positive and Emix,vdW increases with grafting ratio. Emix,elec is negative, and the smaller the Emix,elec, the greater the electrostatic mixing energy. With the increase of grafting ratio, the electrostatic mixing energy first increases and then decreases. At a certain grafting ratio, the electrostatic mixing energy reaches the maximum. This shows that too high grafting ratio will cause the polarity difference between the functionalized graphene and the rubber to be too large, resulting in a decrease in electrostatic mixing energy. It is due to the different increasing (or decreasing) tendencies of Emix,vdW and Emix,elec that Emix appears V-shaped or W-shaped.
3.4 Functionalization principle of graphene
From the above analysis, the compatibility between graphene and rubber is optimal when corresponding to the smallest R or χ. Then, the grafting ratio corresponding to the best compatibility can be called the optimum grafting ratio. The optimum grafting ratios of different graphene/rubber mixtures are listed in Table 5. It can be seen that the optimum grafting ratio may be the same or different for different mixtures, depending on their compatible behavior. Many experiments have also found that the existence of an optimum grafting ratio makes the graphene/rubber composites the best performance.2,49,50 Our work provides a theoretical basis for the explanation of these phenomena.| NR (%) | BR (%) | SBR (%) | NBR (%) | CR (%) | |
|---|---|---|---|---|---|
| Aniline | 23.2 | 23.2 | 23.2 | 15.7 | 19.7 |
| 1-Octadedecylamine | 12.2 | 10.5 | 15.7 | 7.0 | 8.7 |
| Phenyl isocyanate | 8.7 | 8.7 | 8.7 | 8.7 | 8.7 |
| 1-Hexyl isocyanate | 15.7 | 15.7 | 15.7 | 23.2 | 19.7 |
| 3-Mercaptopropionic acid | 10.5 | 10.5 | 10.5 | 23.2 | 19.7 |
| 2-Mercaptoethylamine | 8.7 | 8.7 | 8.7 | 23.2 | 19.7 |
From a thermodynamic point of view, the properties of graphene/rubber composites are determined by two aspects: (1) the inherent properties of graphene and rubber, and (2) the compatibility of graphene and rubber. The introduction of functional groups into graphene will improve the compatibility of graphene and rubber; however, this will deteriorate the properties of graphene itself (electrical and thermal conductivity, etc.). Therefore, the functionalization principle of graphene is to make the functionalized graphene and rubber have good compatibility while not destroying the structure of graphene to the greatest extent. That is, the R-value should be as low as possible at a low grafting ratio. The R-values of graphene/rubber mixtures as a function of grafting ratio are compared in Fig. 8. Therefore, according to the functionalization principle of graphene, the priority of functional groups for NR, BR, and SBR is as follows: 1-octadedecylamine > 1-hexyl isocyanate > 3-mercaptopropionic acid > 2-mercaptoethylamine > aniline > phenyl isocyanate. The priority of functional groups for NBR is as follows: 3-mercaptopropionic acid > 1-octadedecylamine > 1-hexyl isocyanate > 2-mercaptoethylamine > aniline > phenyl isocyanate. The priority of functional groups for CR is as follows: 3-mercaptopropionic acid > 1-octadedecylamine > 1-hexyl isocyanate > 2-mercaptoethylamine > phenyl isocyanate > aniline. For NR, BR, and SBR with low polarity, the 1-octadedecylamine with long alkane chains and low polarity is the most preferred group. For high-polarity rubber (NBR and CR), the functional group with high polarity (3-mercaptopropionic acid) is preferred.
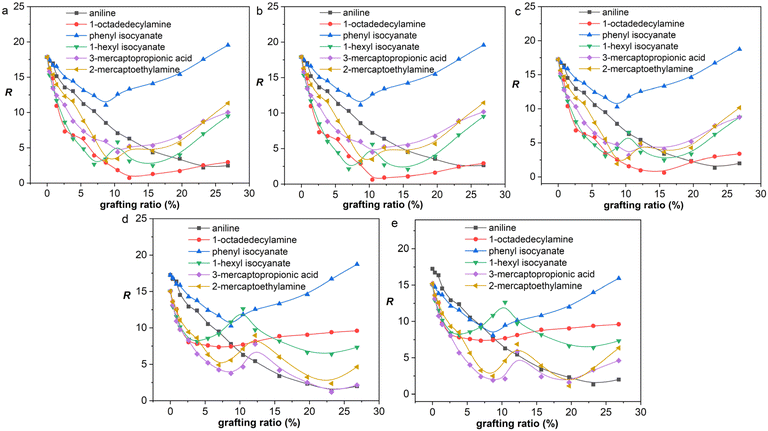 | ||
| Fig. 8 R as a function of grafting ratio for different functional groups: (a) NR, (b) BR, (c) SBR, (d) NBR, and (e) CR. | ||
3.5 Temperature dependence of compatibility
It is widely known that temperature has an important effect on the thermodynamic compatibility of two components.51,52 Therefore, it is of significance to explore the effect of temperature on the compatibility for the processing of materials. The processing temperature of rubber is usually less than 200 °C. Above 200 °C, the higher the temperature, the less important it is for the actual processing. To investigate the compatibility between graphene and rubber at different temperatures, the equilibrated structures after 2 ns MD simulation were annealed. The annealing procedure with five annealing cycles and 25 heating ramps per cycle from an initial temperature of 273 K to a midcycle temperature of 500 K was then performed. The dynamics steps per ramp are 106 and the total number of steps is 5 × 10⁷. The annealing procedure was carried out with NVE (constant number of atoms, volume, and energy) ensemble with a time step of 1 fs. The last annealing cycle was used to calculate Emix from 273 K to 500 K. The Emix of graphene/rubber mixtures as a function of temperature at optimum grafting ratio (see Table 5) is shown in Fig. 9.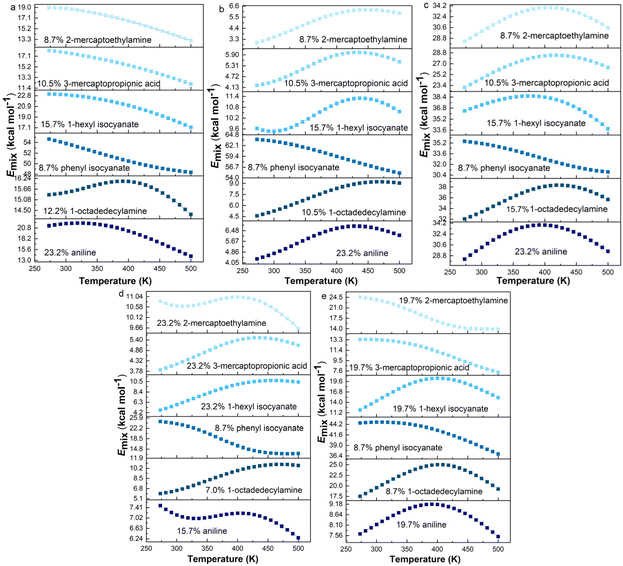 | ||
| Fig. 9 Emix as a function of temperature for functionalized graphene/rubbers mixtures at optimum grafting ratios: (a) NR, (b) BR, (c) SBR, (d) NBR, and (e) CR. | ||
According to the Flory–Huggins lattice model, the lower the Emix, the better the compatibility. It can be seen that there are three types of Emix change with temperature: (1) Emix decreases continuously with the increase in temperature. That is, as the temperature increases, the compatibility of the two components becomes better. (2) Emix increases first and then decreases with the increase in temperature. That is, the compatibility first gets worse and then better with temperature. (3) With the increase in temperature, Emix first decreases, then rises, and finally decreases. That is, the compatibility of the two components first becomes better, then becomes worse, and finally becomes better with temperature. To explain the above three phenomena, we select three representative systems for structural analysis, namely, (1) 8.7% 2-mercaptoethylamine/NR (the first type), (2) 8.7% 2-mercaptoethylamine/SBR (the second type) and (3) 23.2% 2-mercaptoethylamine/NBR (the third type). We calculate the variation of the fractional free volume (FFV) with temperature for the three systems. The FFV is defined as follows:
 | (23) |
4 Conclusions
In this work, Hildebrand and two-dimensional solubility parameters of six functionalized graphene as a function of grafting ratio were calculated by MD simulation. The quantitative relationship between the surface chemistry of functionalized graphene and compatibility with rubber was constructed based on the Flory–Huggins lattice model. This work will provide theoretical insights at the molecular level for the functionalization of graphene and the preparation of high-performance graphene/rubber composites. The main conclusions are as follows:(1) Three-dimensional Hansen solubility parameters are converted to two-dimensional solubility parameters based on the force field method. If the functional group (aniline and 1-octadedecylamine) is at the edge of graphene, the δT decreases with the increase of the grafting ratio, whereas if the functional group (phenyl isocyanate, 1-hexyl isocyanate, 3-mercaptopropionic acid and 2-mercaptoethylamine) is in plane of graphene, the δT decreases first and then increase with grafting ratio. The change of δT and δvdW for graphene is consistent with the grafting ratio. The δele increases with the increase of grafting ratio.
(2) Two-component solubility parameters can predict the compatibility of functionalized graphene and rubber with different polarities well. The functionalized graphene and rubber mixtures exhibit two thermodynamically compatible behaviors with grafting ratio (V-shape and W-shape). The grafting ratio corresponding to the best compatibility between functionalized graphene and rubber is given.
(3) According to the functionalization principle of graphene, the priority of functional groups for NR, BR, and SBR is 1-octadedecylamine > 1-hexyl isocyanate > 3-mercaptopropionic acid > 2-mercaptoethylamine > aniline > phenyl isocyanate. The priority of functional groups for NBR is 3-mercaptopropionic acid > 1-octadedecylamine > 1-hexyl isocyanate > 2-mercaptoethylamine > aniline > phenyl isocyanate. The priority of functional groups for CR is 3-mercaptopropionic acid > 1-octadedecylamine > 1-hexyl isocyanate > 2-mercaptoethylamine > phenyl isocyanate > aniline. The compatible behavior of different graphene/rubber mixtures as a function of temperature at optimum grafting ratios is given.
Our study aims to theoretically provide the quantitative relationship between different functional groups/grafting ratios and solubility parameters through MD simulation. The experimental verification is one direction we want to work on. It is hoped that the effectiveness of our simulation can be verified after the experimental preparation and characterization methods are more mature.
Data availability
The authors confirm that the data supporting the findings of this study are available within the article [and/or] as its ESI.†Conflicts of interest
There are no conflicts to declare.Acknowledgements
This work was supported by the National Natural Science Foundation of China (Grant No. 51903122).Notes and references
- A. K. Geim and K. S. Novoselov, Nat. Mater., 2007, 6, 183–191 CrossRef CAS PubMed.
- A. Murugesan, J. L. Saraswathy and R. Chandran, Int. Polym. Process., 2022, 37, 505–522 CrossRef CAS.
- J. Wang, S. Li, L. Yang, B. Liu, S. Xie, R. Qi, Y. Zhan and H. Xia, Molecules, 2024, 29, 1009 CrossRef CAS PubMed.
- Y. L. Leong, H. N. Lim and I. Ibrahim, Mol. Syst. Des. Eng., 2023, 8, 1229–1251 RSC.
- A. M. Adnan and J. Wang, Constr. Build. Mater., 2023, 402, 133038 CrossRef CAS.
- W. Yu, L. Sisi, Y. Haiyan and L. Jie, RSC Adv., 2020, 10, 15328–15345 RSC.
- V. Georgakilas, J. N. Tiwari, K. C. Kemp, J. A. Perman, A. B. Bourlinos, K. S. Kim and R. Zboril, Chem. Rev., 2016, 116, 5464–5519 CrossRef CAS PubMed.
- S. Eigler and A. Hirsch, Angew. Chem., Int. Ed., 2014, 53, 7720–7738 CrossRef CAS.
- S. Rani, M. Kumar, R. Kumar, D. Kumar, S. Sharma and G. Singh, Mater. Res. Bull., 2014, 60, 143–149 CrossRef CAS.
- C. Xu, X. Wang, J. Wang, H. Hu and L. Wan, Chem. Phys. Lett., 2010, 498, 162–167 CrossRef CAS.
- K. Zhao, Y. Wang, W. Wang and D. Yu, J. Mater. Sci., 2018, 53, 14262–14273 CrossRef CAS.
- R. Salvio, S. Krabbenborg, W. J. M. Naber, A. H. Velders, D. N. Reinhoudt and W. G. van der Wiel, Chem.–Eur. J., 2009, 15, 8235–8240 CrossRef CAS PubMed.
- A. B. Bourlinos, D. Gournis, D. Petridis, T. Szabó, A. Szeri and I. Dékány, Langmuir, 2003, 19, 6050–6055 CrossRef CAS.
- Z. Xu, J. Zhang, M. Shan, Y. Li, B. Li, J. Niu, B. Zhou and X. Qian, J. Membr. Sci., 2014, 458, 1–13 CrossRef CAS.
- A. Mahmood, Y. Sandali and J.-L. Wang, Phys. Chem. Chem. Phys., 2023, 25, 10417–10426 RSC.
- A. F. Barton, Chem. Rev., 1975, 75, 731–753 CrossRef CAS.
- C. M. Hansen, Hansen Solubility Parameters: A User's Handbook, CRC Press, 2007 Search PubMed.
- X. Fang, B. Li, J. C. Sokolov, M. H. Rafailovich and D. Gewaily, Appl. Phys. Lett., 2005, 87, 094103 CrossRef.
- Y. Hernandez, M. Lotya, D. Rickard, S. D. Bergin and J. N. Coleman, Langmuir, 2010, 26, 3208–3213 CrossRef CAS.
- S. D. Bergin, Z. Sun, D. Rickard, P. V. Streich, J. P. Hamilton and J. N. Coleman, ACS Nano, 2009, 3, 2340–2350 CrossRef CAS PubMed.
- S. Ata, T. Mizuno, A. Nishizawa, C. Subramaniam, D. N. Futaba and K. Hata, Sci. Rep., 2014, 4, 1–8 Search PubMed.
- C. M. Hansen and A. L. Smith, Carbon, 2004, 42, 1591–1597 CrossRef CAS.
- T. Dooher and D. Dixon, Polym. Compos., 2011, 32, 1895–1903 CrossRef CAS.
- W. Zhu, J. Ma, X. Nan, P. O. Lartey and Y. Yang, Colloid Polym. Sci., 2019, 297, 213–224 CrossRef CAS.
- Y. Luo, R. Wang, W. Wang, L. Zhang and S. Wu, J. Phys. Chem. C, 2017, 121, 10163–10173 CrossRef CAS.
- J. Ma, J. Liu, W. Zhu and W. Qin, Colloids Surf., A, 2018, 538, 79–85 CrossRef CAS.
- P. May, U. Khan, J. M. Hughes and J. N. Coleman, J. Phys. Chem. C, 2012, 116, 24390–24391 CrossRef CAS.
- J. Gupta, C. Nunes, S. Vyas and S. Jonnalagadda, J. Phys. Chem. B, 2011, 115, 2014–2023 CrossRef CAS.
- Y. Luo, X. Chen, S. Wu, S. Cao, Z. Luo and Y. Shi, Langmuir, 2020, 36, 9291–9305 CrossRef CAS PubMed.
- M. M. Hayder, T. M. Moumita, S. Chowdhury and K. A. Rahman, Mol. Simulat., 2024, 1–12 Search PubMed.
- Y. Keramati, R. Ansari, S. Haghighi and M. Eghbalian, Mol. Simulat., 2024, 1–13 Search PubMed.
- X. Huang, C. Zhi, Y. Lin, H. Bao, G. Wu, P. Jiang and Y.-W. Mai, Mater. Sci. Eng. R Rep., 2020, 142, 100577 CrossRef.
- G. G. Vogiatzis and D. N. Theodorou, Arch. Comput. Methods Eng., 2018, 25, 591–645 CrossRef PubMed.
- K. Lee, H. J. Lim, S. J. Yang, Y. S. Kim and C. R. Park, RSC Adv., 2013, 3, 4814 RSC.
- H. Moradi, H. Azizpour, P. Khadiv-Parsi and R. G. Nia, Chem. Eng. Technol., 2023, 46, 2167–2174 CrossRef CAS.
- S. Chen, H. Yang, K. Huang, X. Ge, H. Yao, J. Tang, J. Ren, S. Ren and Y. Ma, Polymers, 2021, 13, 3778 CrossRef CAS.
- X. Chen, C. Yuan, C. K. Y. Wong and G. Zhang, J. Mol. Model., 2012, 18, 2333–2341 CrossRef CAS PubMed.
- Q. Chen, Z. Zhang, W. Huang, J. Qu, Q. Zhang, X. Wu, L. Zhang and J. Liu, Polym. Int., 2024 DOI:10.1002/pi.6647.
- A. V. Savin and M. A. Mazo, Phys. E, 2020, 118, 113937 CrossRef CAS.
- S. Hoyas, V. Lemaur, Q. Duez, F. Saintmont, E. Halin, J. De Winter, P. Gerbaux and J. Cornil, Adv. Theory Simul., 2018, 1, 201800089 Search PubMed.
- G. Zhao, X. Li, M. Huang, Z. Zhen, Y. Zhong, Q. Chen, X. Zhao, Y. He, R. Hu, T. Yang, R. Zhang, C. Li, J. Kong, J.-B. Xu, R. S. Ruoff and H. Zhu, Chem. Soc. Rev., 2017, 46, 7469 RSC.
- M. Song, M. Wang, C. Wang, J. Song, Y. Li, F. Cao, G. Yu and Q. Qin, Macromol. Theory Simul., 2023, 32, 202200072 CrossRef.
- K. Luo, G. You, S. Zhang, W. Zheng and S. Wu, Polymer, 2020, 188, 122143 CrossRef CAS.
- S. Thakral and N. K. Thakral, J. Pharm. Sci., 2013, 102, 2254–2263 CrossRef CAS.
- S. Dhamankar and M. A. Webb, ACS Macro Lett., 2024, 13, 818–825 CrossRef CAS.
- D. W. Boukhvalov and M. I. Katsnelson, J. Am. Chem. Soc., 2008, 130, 10697–10701 CrossRef CAS.
- J. Chen, J. Li, J. Zhu, X. Chen, Y. Liu, Y. Gao, Z. Luo, S. Wu and Y. Luo, J. Phys. Chem. B, 2021, 125, 5420–5433 CrossRef CAS PubMed.
- Y. Luo, X. Chen, H. Liu, H. Zhang, M. Song, J. Liu and Z. Luo, Comput. Mater. Sci., 2021, 186, 8663 Search PubMed.
- Z. Tang, L. Zhang, W. Feng, B. Guo, F. Liu and D. Jia, Macromolecules, 2014, 47, 8663–8673 CrossRef CAS.
- X. Liu, L.-Y. Wang, L.-F. Zhao, H.-F. He, X.-Y. Shao, G.-B. Fang, Z.-G. Wan and R.-C. Zeng, Polym. Compos., 2018, 39, 1006–1022 CrossRef CAS.
- L. Zhang, Y.-K. Huang, L.-N. Yue, L. Xu, J.-Y. Qian and X.-D. He, Carbohydr. Polym., 2022, 296, 119951 CrossRef CAS.
- K. Shitajima, N. Karyu, K. Takada, S. Fujii, Y. Nakamura and Y. Urahama, Polym. Polym. Compos., 2015, 23, 121–128 Search PubMed.
Footnote |
| † Electronic supplementary information (ESI) available: Validation of models and methods. R and χ of functionalized graphene/rubbers mixtures. See DOI: https://doi.org/10.1039/d4ra08062a |
| This journal is © The Royal Society of Chemistry 2024 |

