 Open Access Article
Merging inline crystallization and pulsed flow operation to enable enantiospecific solid state photodecarbonylation†
Bavo
Vandekerckhove
a,
Bart
Ruttens
b,
Bert
Metten
 b,
Christian V.
Stevens
 a and
Thomas S. A.
Heugebaert
 *a
*a
aSynBioC Research Group, Department of Green Chemistry and Technology, Faculty of Bioscience Engineering, Ghent University, Coupure Links 653, B-9000 Ghent, Belgium. E-mail: Thomas.Heugebaert@UGent.be
bAjinomoto Bio-Pharma Services, Cooppallaan 91, 9230 Wetteren, Belgium
First published on 25th March 2024
Abstract
The enantioselective formation of C–C bonds is arguably one of the most important reactions in organic chemistry. While elegant solutions have been devised for the total synthesis of several natural products, active pharmaceutical ingredients (API), and related scaffolds, efficient methods that strive towards the principles of green chemistry remain highly desirable additions to the synthetic organic toolbox. Additionally, modern strategies become increasingly challenging when the desired structures are highly strained, sterically encumbered, or contain adjacent quaternary chiral centers. In this research, the hexasubstituted ketone d,l-2,4-dimethyl-3-oxo-2,4-diphenylpentanedinitrile was chosen as a highly strained and chiral proof-of-concept substrate to evaluate the scalability of solid state photoelimination chemistry. Performing the photodecarbonylation of easily accessible alpha-chiral ketones in the solid state physically restricts the mobility of the generated radical intermediates, resulting in high regio- and enantiospecificity. Additionally, aqueous suspensions can be used, resulting in a simple filtration as the only purification step. The continuous flow HANU™ 2X 15 photoreactor, preceded by a custom inline crystallization setup, were shown to be key enabling technologies to achieve the previously problematic continuous operation and scale-up of these reactions. A solid-to-solid photochemical process was successfully optimised, resulting in a STY of 3.6 kg h−1 m−3.
Introduction
Vicinal chiral carbon centers are an important structural motif in organic synthesis and abundantly present in natural products, secondary metabolites and bioactive molecules. The formation of such C–C bonds is arguably one of the most important reactions in organic chemistry and many strategies have been developed to link fragments by thermochemical pathways. However, these strategies become more and more challenging when the desired structures are highly strained or sterically encumbered. While elegant solutions have been devised for the total synthesis of several natural products and related scaffolds, a general and efficient method that meets the ideals of green chemistry remains highly desired.1–3 While the advances in this field have been incredibly robust, processes that are atom economical, minimize the use of transition metals and/or employ environmentally reagents and solvents remain elusive.One particularly interesting, but generally disregarded class of C–C bond formation reactions capable of establishing vicinal chiral carbon centers is photoelimination conducted in the crystalline solid state. Such transformations offer many advantages such as a cage effect induced control over various selectivities (stereo-, regio-, and chemo-selectivity), their potential for scalable green chemistry, and ability to form strained or congested frameworks. Solid state photochemistry is known for its clean conversions and it can be performed in aqueous suspensions at ambient temperature. Afterwards, the product is obtained through a simple filtration as the only purification step. As such, photochemical reactions in solid state have been known to exhibit notable advantages in the framework of green chemistry.4
Solid state photoelimination chemistry and its scalability
Photochemical elimination of a small molecule (Fig. 1; X = CO, CO2, N2…) from more readily available α-chiral ketone-, ester-, or diazo-precursors offers a potential route for the construction of adjacent chiral centres. After absorption of a photon and subsequent alpha cleavage to form a biradical (Norrish type I cleavage), the small molecule is eliminated and the final C*–C* bond is easily formed (Fig. 1).5 Contrasting the energetic advantages however, the final radical–radical recombinations are not always efficient processes. In non-cyclic and/or unconstrained molecules, radical species can rotate, undergo stereochemical inversion, or diffuse apart which result in random recombination of the available radicals. Furthermore, the high energy content of the intermediary radicals renders them prone to degradation and side reactions if a suitable recombination partner is not readily available. As such, the mobility of these radicals needs to be controlled to achieve high yields and good regio- and enantioselectivity.All these aspects can be addressed by physically restricting the fate of the radical intermediates and performing the reaction in solid state. The induced cage effects prohibit diffusion of the generated radicals and greatly limit their rotational liberties. The use of crystalline suspensions was previously shown to be key in achieving both good regio- and enantiospecificity.6 Multiple solid state photoelimination reactions were already developed with good yields and enantioselectivity, demonstrating the benefits of this approach. Especially the use of aqueous crystalline suspensions and filtration as single purification method when obtaining full conversion, creates great opportunities for further scale-up of this type of chemistry.7–11 Despite these listed advantages of C–C bond construction through solid state photoelimination, its application currently remains mostly restricted to research labs. The scalability of this approach, of utmost importance to become industrially relevant in pharma, is at this time very limited due to technical problems. When increasing the reactor volume, very high reaction times are required due to the low penetration depth of photons. In addition, due to the absence of diffusive mixing of the substrate within the crystals, it is essential to ensure an equal dosage of light for every single particle from each direction. Flow regimes which induce tumbling of a solid substrate were shown by Peter Seeberger and co-workers to be essential for clean solid state photochemical conversions.12
Flow technology has proven its benefits in photochemistry by better and more uniform irradiation than in batch, shorter pathlengths, more selective reactions and efficient scale-up. Only a few photoreactors have been operating in an industrial environment up to now. These have been specifically developed for just a handful of processes such as the synthesis of vitamins D3 and A (by BASF and Hoffmann-LaRoche), rose oxide (Symrise), photochlorination of toluene, caprolactam (Toray) and artemisinin (Sanofi and Huvepharma).13 However, it is also known that until present, the use of solids in a flow set-up was not possible due to the issues concerning sedimentation, accumulation and clogging of the reactor tubes. Therefore, a solid handling flow reactor is of utmost importance for the scale up of solid state photoelimination chemistry in continuous flow.
Scope of this research
In this research, the hexasubstituted ketone d,l-2,4-dimethyl-3-oxo-2,4-diphenylpentanedinitrile (d,l-1) was chosen as a chiral proof-of-concept substrate to evaluate the scalability of solid state photoelimination chemistry (Fig. 2). Focus is set on the design and development of a standard protocol to perform solid state photochemistry, process parameter and photon efficiency optimisation, and productivity and material throughput increase.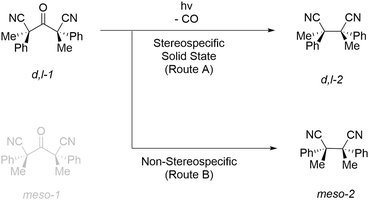 | ||
| Fig. 2 Photodecarbonylation reaction of d,l-2,4-dimethyl-3-oxo-2,4-diphenylpentanedinitrile (d,l-1). | ||
During the synthesis of d,l-1, two diastereomers are obtained. The meso-1 isomer (R,S/S,R) is removed by recrystallisation and a racemic mixture of the d,l-1 enantiomers (S,S/R,R) is used as the photoelimination substrate. Upon performing the photodecarbonylation reaction, the appearance of 1H-NMR signals of the decarbonylated meso-2 diastereomer is used to determine the diastereospecificity and to quantify the degree of inversion of conformations.
Results and discussion
Light source selection
Depending on the light source, photons with different wavelengths and consequently different energies can be emitted. Lamps with wavelengths that are not absorbed by the substrate cause a direct loss of the photon efficiency (absorbed amount of photons/emitted amount of photons by the lamp). Therefore, monochromatic light sources are most often preferred and absorbance spectra should be measured to characterise the most suitable wavelength for the photochemical transformation. This is in line with the first law of photochemistry stating that it is only the absorbed light which is effective in producing photochemical changes in a molecule (Grotthuss–Draper law). The second law in photochemistry states that for every photon of light absorbed by a chemical system, only one molecule is activated for a chemical reaction (Stark–Einstein's law). In order to get the highest possible productivity, it is of prime importance to achieve high photon fluxes in the reaction mixture. Especially in the framework of industrial scale-up, a high intensity light source is therefore necessary.14To determine the most optimal lamp wavelength, the absorbance spectrum of d,l-1 was measured. In previous work on photodecarbonylation chemistry, most often a polychromatic medium pressure 450 W Hg lamp was used in combination with a >290 nm filter.7–9Fig. 3 shows that the substrate only absorbs light in the UV-C region (100–280 nm). Within this wavelength region, only 254 nm lamps are available as monochromatic light sources. However, these wavelengths are most often used in lamps to disable pathogens in other industries. Since this is also harmful for the human body (skin and eye damage), these lamps have relatively low light intensities to protect operators and surroundings.
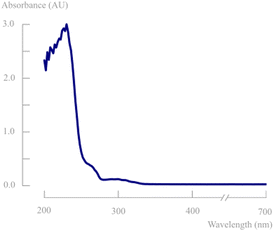 | ||
| Fig. 3 Absorbance spectrum of the enantiomeric mixture of d,l-1 in acetonitrile (0.1 g L−1) in the range of 200–700 nm. | ||
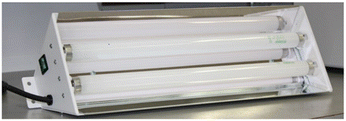
Unfortunately, this makes these lamps unsuitable for photochemistry. After extensive research, the XX-15 UV device with monochromatic 254 nm lamps from Analytik Jena was purchased to provide one of the highest intensities (43 mW cm−2 at 2 cm distance) available on the market, while still being suitable to mount on the HANU™ 2X 15 reactor (Fig. 4).15 The resulting photon flux using was determined by means of actinometry (0.65 μEinstein per s, see ESI†).
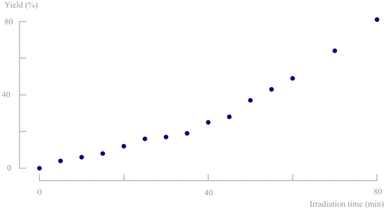
To verify the suitability of this XX-15 UV light source for the photochemical conversion of d,l-1, several solid state batch experiments were performed. The ketone (50–80 mg) was crushed between microscopic slides and every 5 minutes, a sample was taken for analysis. The remaining solids were recrushed to ensure refreshment of the top layer of crystals which is important due to the limited penetration depth of photons within solid particles. The photodecarbonylation reaction was found to be diastereospecific (NMR) and no byproducts are formed. The achieved yield is visualised in Fig. 5 and reached 80% of d,l-2,3-dimethyl-2,3-diphenylbutanedinitrile (d,l-2) after 80 minutes. It is striking that a rate increase is apparent at higher irradiation times. However, since every 5 minutes a sample is taken for analysis, the amount of remaining solids is reducing and consequently, the thickness of the solid layer decreases, improving the light penetration. Solid state batch experiments are typically only possible on scales below 100 mg due to the low light penetration and poor top layer refreshment. This again emphasises the benefits of aqueous suspensions in (turbulent) continuous flow to increase the efficiency of solid state photodecarbonylation chemistry.
To demonstrate the requirement of conducting the photodecarbonylation in the solid state, the reaction was also carried out in solution. After 60 minutes of irradiation, a yield of 53% was obtained, with a d,l-2/meso-2 ratio of 2.4/1 (see ESI†). This result confirms racemization towards meso-2 when the reaction is performed in the solution state.
Inline crystallisation
The first experiments in continuous flow, using pre-prepared batches of substrate suspension, exposed several obstacles for the handling of slurries concerning inhomogeneous suction and sedimentation/accumulation in pumps and pulsators. This led to unreliable data and a clogged setup. Therefore, to avoid these practical problems, inline crystallisation was evaluated as a powerful alternative approach for the continuous delivery of the decarbonylation substrate. This way, better parameter control during crystallisation is achieved and a fully continuous process could be developed. One of the major challenges to accomplish this, was to develop an appropriate method for preparation of the required nanoparticles. As a simple, rapid and scalable method, flash nanoprecipitation (FNP) has been widely used to fabricate drug nanoparticles. FNP is based on high super-saturation condition of drug molecule to trigger nucleation and growth of nanoparticles under controlled solvent/anti-solvent mixing conditions. The solvent/anti-solvent ratio together with the rapid impingement mixing of these two (or more) miscible liquids in a confined chamber are identified as the most important parameters to obtain a nanocrystalline solution. Surfactants are added to encapsulate the drug molecule in a hydrophobic core to provide steric stabilization by the hydrophilic layer around the nanoparticles, that inhibit further growth and aggregation of the nanoparticles.16–18Several mixing devices are known to optimise the mixing properties to generate a stable aqueous crystalline suspension: confined impingement jets mixer (CIJM), multi-inlet vortex mixer (MIVM) and microfluidic mixer systems. The latter have proven to be a powerful tool for nanoparticles preparation in microliter scale. Due to the micron-sized scale, microfluidics behaviour differs from conventional flow theory. As suggested by the low Reynold's number in the microfluidic mixer, liquid flow patterns were deemed as laminar in parallel without turbulence. Mixing occurs as a result of diffusion of molecules across the interface between solvent and anti-solvent fluids within micro-seconds, as shown in Fig. 6. Microfluidic mixer systems maximize the mixing performance by their high surface to volume ratio, leading to the highest mixing efficiency and homogeneous reaction environment of the solute solution under continuous flow condition.16
 | ||
| Fig. 6 Examples of multiple microfluidic mixer systems (W = water, S = solvent).18 | ||
Based on these examples, we designed and 3D printed two different types of microfluidic mixers, as shown in Fig. 7. The inner diameter of the solvent flow was minimized to a capillary of 0.45 mm to maximize the surface to volume ratio and, thus, the mixing efficiency. In design 1, the solvent flow is parallel to the antisolvent flow, while design 2 has a perpendicular solvent flow (T-mixer). The difference with previous microfluidic mixers is the use of a pulsator on the anti-solvent flow. Hereby, creating an oscillating effect and a higher Reynolds number in the turbulent range is obtained, and better mixing is achieved on the microliter scale.
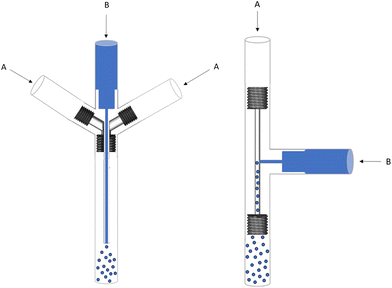 | ||
| Fig. 7 Technical drawing of mixing systems with a parallel flow (design 1) and a perpendicular flow (design 2) (A = antisolvent water flow, B = dissolved substrate in acetonitrile). | ||
Initial tests showed that design 1 suffered from substrate accumulation at the capillary outlet and tubing. A pulsatile flow parallel to the solvent injection causes small amounts of anti-solvent to enter the capillary, leading to accumulation and subsequent clogging. In addition, splitting the oscillating antisolvent flow (A) in two streams reduced the pulsatile effect at the outlet of the mixing device. This, in combination with the lower linear velocity in the larger diameter outlet tube (3.17 mm ID, to fit the 2.5 mm OD capillary), caused the accumulation of substrate in the outlet tubing of the mixer. These practical issues were avoided by using the perpendicular solvent flow of design 2. However, despite the fact that the pulsatile effect is applied on the antisolvent flow, some pulsation was visible on the solvent flow as well, which caused accumulation and subsequent clogging in the solvent stream, even before the mixing device. Therefore, a check valve was added to avoid any pulsatile effect on the solvent flow. During the following experiments, multiple variants of design 2 were tested by changing the capillary and channel sizes.
HANU™ 2X 15 flow photoreactor: fluid mechanics and residence time distribution
The HANU™ 2X 15 reactor is used as a process intensifying technology to enable the scale-up of solid state photochemistry. This patented photoreactor is a continuous-flow reactor based on the COSTA™ technology (Fig. 8), with an internal volume of 15 mL (irradiated volume = 12.03 mL). The process space consists of a split-and-recombine flow pattern (using static mixers) operated in conjunction with a pulsator, a device that superimposes a periodic oscillation on the net flow generated by a metering pump. This oscillatory flow regime and repeated split-and-recombine flow path ensures adequate mixing regardless of the net flow rate and creates tumbling of suspended particles to ensure spatially homogeneous irradiation of their surface area.12 Consequently, pulsator amplitude and frequency are introduced as new process parameters. By simply widening the process channel and linearly increasing throughput while keeping heat exchange, mass transfer and light penetration constant, further scale-up can be performed.19,20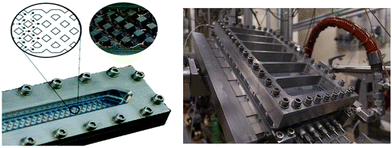 | ||
| Fig. 8 Visualisation of the HANU 2X photoflow reactor on lab scale (15 mL, left) and pilot scale (150 mL, right). | ||
In a continuous flow system, the residence time distribution (RTD) is introduced as an important parameter to describe the plug flow character. Narrow RTDs decrease the probability of side reactions or incomplete conversion to occur. Within the HANU™ 2X 15 reactor setup, symmetrical oscillations will be applied generating vortices (eddies), leading to improved radial mixing, whilst aiming to maintain a plug flow character (minimal axial mixing). Therefore, mixing is decoupled from the net flow rate and only depends on the oscillation conditions. Axial dispersion has previously been proven to be very sensitive to oscillatory conditions at low net flow rates. Consequently, experiments using long residence times require careful optimization of the pulsator characteristics (amplitude and frequency) to obtain the most suitable reaction conditions.21 Although RTDs at other flow rates within the HANU™ 2X 15 reactor were already measured by Kappe et al., the RTD at a 6 mL min−1 flow rate was measured and reported here.29
To quantify the mixing efficiency and the flow pattern, the Reynolds number can be calculated (eqn (1)). In this setup however, an oscillating flow is used with the purpose to create more turbulence and avoid sedimentation and accumulation of solid particles. Therefore, the oscillating Reynolds number (ReOsc) which describes the intensity of mixing applied to the reactor, is more appropriate to accurately determine the flow regime.22,23 The calculated velocity ratio (Ψ) should be greater than 1 to ensure that the oscillatory flow dominates the superimposed net flow. However, values in the range of 2–10 have been recommended for plug-flow operation within oscillating baffle flow reactors (distance between baffles = ±1 cm) at high flow rates (>100 mL min−1). It should be noted that these values have only been validated for liquids and not for multiphase systems such as slurries.24,25 However, Kacker et al. mentioned that optimal conditions were obtained outside this 2–10 range and no generalization could be made based on these velocity ratios.26 Mixing quality typically increases with the velocity ratio. Nevertheless, if the net flow is too low, mixing performance decreases because of backmixing and unreliable results are expected.27 According to the manufacturers specifications, a velocity ratio >20 is aimed at within the HANU™ 2X 15 reactor to fully benefit from the oscillatory flow regime. Since no tubular flow pattern is present in the HANU™ 2X 15 reactor, a hydraulic diameter (Dh) is calculated based on the flow path in between adjacent static mixers.
 | (1) |
Finally, the Strouhal number (Str) is calculated to quantify the effective eddy (vortex mixing at static mixers) propagation inside the reactor. Str is inversely proportional to the oscillating amplitude and if too high, it causes eddies to be propagated over larger sections (undesired).25 For Str > 0.1, a collective oscillating movement of the ‘plug’ fluid can be found where the increment in Str reduces relative length of fluid transportation.24 As a rule of thumb for tubular flow regimes, a Str value of >0.5 is usually required to fully realise the benefits of an oscillating flow reactor and to obtain effective eddy shedding. At low Strouhal numbers, e.g. Str ≤ 0.1, the main flow forms a fast streaming core at the tube center. Until present, the Strouhal number was only used in oscillating baffle reactors with larger inner diameters (≫1 cm) at high flow rates (>100 mL min−1) and a different, more beneficial behaviour is expected in the HANU™ 2X 15 reactor with a split-and-recombine rectangular flow path. It seems that no information is available on desired Strouhal values in alternative microflow patterns.21,28 Therefore, the Strouhal number is reported here to provide a first benchmark value for microfluidic systems.
Fig. 9 shows the residence time distribution at a flow rate of 6 mL min−1 for multiple different pulsator amplitudes (see ESI†). It is known that the oscillation frequency has a minor impact on the axial dispersion and increasing frequency leads to increased mixing. Therefore, only the pulsator amplitude effect was studied extensively. The corresponding dimensionless parameters are shown in Table 1 to further quantify the fluid behaviour. Additionally, the Bodenstein number is calculated for plug flow quantification.
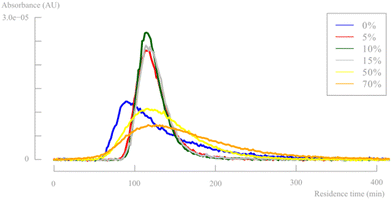 | ||
| Fig. 9 Residence time distribution for different pulsator amplitudes (flow rate = 6 mL min−1, pulsator frequency = 3 Hz (100%)). | ||
| Pulsator amplitude (%) | Ren | ReOsc | Ψ | Bo | Str |
|---|---|---|---|---|---|
| 0 | 56 | — | — | 12.5 | — |
| 5 | 56 | 106 | 2 | 55.3 | 0.064 |
| 10 | 56 | 212 | 4 | 69.2 | 0.032 |
| 15 | 56 | 318 | 6 | 66.5 | 0.021 |
| 50 | 56 | 1059 | 19 | 17.3 | 0.006 |
| 70 | 56 | 1438 | 26 | 11.5 | 0.005 |
Based on both of the Reynolds numbers, it is clear that the addition of an oscillating flow has a major positive effect on the turbulence and mixing within the reactor, up to a fully turbulent regime at the highest pulsator amplitudes. The desired velocity ratio value is only obtained at >50% pulsator amplitudes. However, the residence time distributions (Fig. 9) and the Bodenstein numbers show that these high pulsator amplitudes are detrimental for an efficient plug flow behaviour. As mentioned before, the pulsation amplitude can be too high causing eddies to be propagated over larger reactor sections. This is clearly visible for pulsator amplitudes with Str values below 0.01, causing broad distributions in the RTD. As mentioned earlier, the stated Strouhal number ranges in previous literature will probably not be useful for microflow applications and a Str number of <0.01 seems a more reasonable cutoff value to determine insufficient eddy propagation and consequently backmixing within microfluidic systems.
Solid state photodecarbonylation screening in a continuous flow setup: pulsator amplitude & residence time
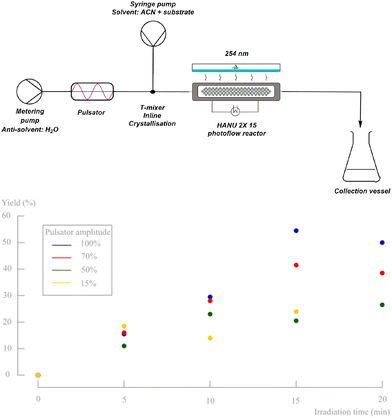
From the previous part, it is clear that the oscillatory flow typically applied in the HANU™ 2X 15 reactor, is controlled by the pulsator amplitude and frequency and has a major impact on the outcome of the reaction. To obtain insights in the effect of the pulsator amplitude on the photodecarbonylation chemistry, a number of experiments were performed using the set-up shown in Fig. 10. As expected, the absence of pulsation caused clogging of the mixer during inline crystallisation and further accumulation and sedimentation in the tubing, independent of the net flow rate. When applying oscillations at the other hand, and up to a certain irradiation time, the yield is increasing faster with higher applied amplitudes. As a result, a yield of 55% is obtained when using the maximum pulsation amplitude and a residence time of 15 minutes. However, a further increase of the residence time decreased the obtained yield. When a low net flow rate is used (high residence time) while applying a high pulsator amplitude, back mixing causes unreliable results. In addition, it is clear that the lower amplitudes cannot be used at low net flow rates either, since accumulation and clogging is then observed at the T-mixer (e.g. 15%, 20 min).A higher pulsator amplitude creates more turbulence and better mixing during crystallisation, creating a more fine dispersed crystalline suspension (better light penetration). Since both the crystallisation and the photochemical reaction are in need of different optimal parameter values (see further), the setup was adapted into two telescoped processes, still enabling a continuous synthesis (Fig. 11). Two pulsator devices are used, which creates full amplitude control on both processes independently. A finely dispersed aqueous crystalline suspension is made by inline crystallisation at 100% amplitude, which is then collected in a magnetically stirred collection vessel. Because of the high turbulence in the mixer (see further) and in contrast to our initial unsuccessful batch preparation of the suspensions, small particle sizes are obtained creating a pumpable suspension for the final reaction process. From this collection vessel, the suspension is pumped through respectively a new pulsator and the HANU™ 2X 15 reactor. A more suitable pulsator amplitude can now be programmed making higher residence times possible for the photoreaction.
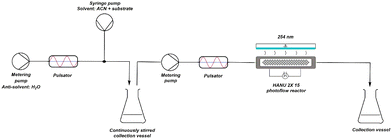 | ||
| Fig. 11 Schematic representation of adapted reaction setup consisting of two different coupled processes. | ||
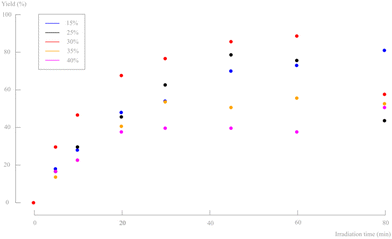
Several residence times were tested using the same 2 g L−1 slurry density to obtain full conversion in the adapted setup. A pulsator amplitude of 15% was first chosen because of its excellent performance during the RTD study. However, a strong flattening yield curve was obtained and even after 80 min of irradiation, still no full conversion was obtained. In a continuous flow setup, longer residence times are not desirable. As illustrated before (Fig. 10), increasing the pulsator amplitude increased the yields until a maximum was reached, after which a further increase started to decrease the yield. However, within a certain range (to avoid backmixing), it is still possible to fine tune the pulsator amplitude (5–40%) for this setup. Higher amplitudes, and so higher turbulence, can possibly create more tumbling of the crystals, thus improving equal irradiation of every particle. Fig. 12 shows that increasing the pulsator amplitude to 30% had a beneficial effect on the yield. Only at the lowest net flow rate, unreliable results were obtained. Further increase of the amplitude results in a lower yield, even at short residence times. A residence time of 1 h and a pulsator amplitude of 30% was found to give the best results (87% yield). From this subsection, it is clear that careful optimisation of the pulsator amplitude is desired with respect to the reaction time and high amplitudes are prone to creating backmixing.
After this first screening was performed and a preliminary reaction process was established, the effect of back pressure was evaluated (Fig. 13, see ESI†). It is striking that the addition of some pressure to the system has a pronounced beneficial effect. An excellent yield of >99% was already obtained after 30 minutes residence time.
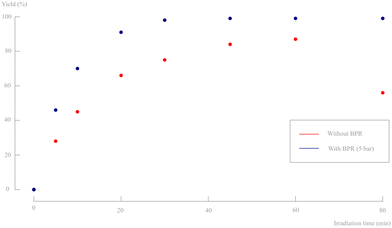 | ||
| Fig. 13 Yield in function of irradiation time for a 2 g L−1 slurry density for pulsator amplitudes of 30% without BPR (see earlier Fig. 12) and with BPR (5 bar). Only d,l-1 and d,l-2 are observed on 1H-NMR and no byproducts, diastereomers or degradation products are formed. | ||
Solid state photodecarbonylation screening in a continuous flow setup: crystal size
A final possibility decrease reaction times is to decrease the particle size to obtain a better light penetration into the crystal centre. As mentioned before, the mixing efficiency was found to be of utmost importance during inline crystallisation to obtain a pumpable dispersion of fine crystals in water. In the current setup, this is mainly defined by the pulsator amplitude. According to eqn (1), the net and oscillating Reynolds number can be calculated within the T-mixer during inline crystallisation (tubular flow) and depend on the mixer's inner diameter, as shown in Table 2. Since the RTD is of minor importance during crystallisation and the emphasis is mainly on creating turbulence and instant mixing, a 100% pulsator amplitude seems most suitable according to the oscillating Reynolds number.| ID mixer (mm) | Pulsator amplitude (%) | Ren | Reosc |
|---|---|---|---|
| 1.00 | 0 | 57 | 57 |
| 15 | 57 | 809 | |
| 50 | 57 | 2697 | |
| 70 | 57 | 3775 | |
| 100 | 57 | 5393 | |
| 1.58 | 0 | 36 | 36 |
| 15 | 36 | 512 | |
| 50 | 36 | 1707 | |
| 70 | 36 | 2389 | |
| 100 | 36 | 3413 | |
| 4.74 | 0 | 12 | 12 |
| 15 | 12 | 171 | |
| 50 | 12 | 569 | |
| 70 | 12 | 796 | |
| 100 | 12 | 1138 |
Decreasing the mixer inner diameter of the standard mixer from 1.58 to 1 mm to obtain a higher oscillating Reynolds number and so better mixing, quite surprisingly did not have a beneficial influence on the particle size. Increasing the inner diameter to 4.74 mm to obtain a better solvent/anti-solvent ratio at the crystallisation spot (see ESI†) with a detrimental Reynolds number as a consequence, did not create smaller particles either (for PSDs, see supporting information). Using the original T-mixer with an inner diameter of 1/8′′ (1.58 mm) was thus found to result in the smallest particle sizes.
When these samples were subjected to microscopic imaging (×40), it was clear that in fact aggregates were present, consisting of multiple small rectangular microcrystals instead of the usually reported nanoparticles (Fig. 15). Therefore, the collection flask was sonicated for 40 minutes to verify if ultrasound could break these aggregates to its individual particles. The effect of sonication on the particle size distributions is shown in Table 3, and was most pronounced for the aggregates generated in the 1.58 mm mixer. Microscopic imaging showed that sonication could successfully break these aggregates. It is important to state that sonication breaks aggregates and not the crystals itself.
| Pulsator amplitude (%) | ID mixer (mm) | Sonication time (min) | θ average (μm) | θ median (μm) |
|---|---|---|---|---|
| 100 | 1.58 | 0 | 216 | 132 |
| 20 | 106 | 71 | ||
| 40 | 75 | 59 | ||
| 1.00 | 0 | 314 | 208 | |
| 20 | 125 | 74 | ||
| 40 | 108 | 65 | ||
| 4.74 | 0 | 360 | 234 | |
| 20 | 279 | 170 | ||
| 40 | 231 | 151 |
To confirm that turbulence (pulsator amplitude) influences the particle size distribution, the average and median particle sizes were measured for multiple different pulsator amplitudes in the 1.58 mm mixer (Table 4). For pulsator amplitudes of 0 and 15%, clogging occurred in the T-mixer and tubing, and no PSD was measured. At these amplitudes, the turbulence was too low, leading to formation of bigger particles. From 100% down to 50% amplitude (no sonication), an increase in average and median particle size was visible confirming the need for high Reynolds numbers to obtain small particles. Only the amplitude of 30% shows some deviation to this trend. Sonication consistently lowered the particle sizes and most often created more symmetrical PSDs (see supporting information), however the effect is different depending on the pulsator amplitude and at 100% amplitude the aggregates consist of distinctly smaller crystallites.
| ID mixer (mm) | Pulsator amplitude (%) | Sonication time (min) | θ average (μm) | θ median (μm) |
|---|---|---|---|---|
| 1.58 | 0 | 0 | ND | ND |
| 40 | ND | ND | ||
| 15 | 0 | ND | ND | |
| 40 | ND | ND | ||
| 30 | 0 | 302 | 181 | |
| 40 | 285 | 165 | ||
| 50 | 0 | 331 | 233 | |
| 40 | 185 | 95 | ||
| 70 | 0 | 323 | 215 | |
| 40 | 306 | 208 | ||
| 100 | 0 | 216 | 132 | |
| 40 | 75 | 59 |
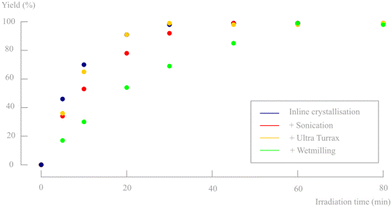
It is clear from previous results that additional sonication of the slurry is beneficial to obtain smaller particle sizes and therefore, continuous sonication was evaluated as a tool to increase the reaction rate of the photodecarbonylation. The collection vessel was continuously sonicated after inline crystallisation and the bath was periodically cooled with ice to avoid too much heating of the suspension over time due to the ultrasounds. The conversion of d,l-1 is shown in Fig. 14, but was slightly slower as compared to the results obtained without sonication, despite the smaller particle sizes. Apparently, the aggregation of small crystals does not prohibit efficient irradiation and/or conversion. To check if the small rate decrease was attributed to potential degradation of the substrate upon sonication, NMR, UV and LC-MS analysis was performed on both sonicated and non-sonicated suspended material. All analyses gave identical spectra in both cases, which confirmed that no byproducts were formed and no degradation processes occurred because of the applied ultrasound.
In a final attempt to reduce the actual crystal sizes, both a high shear Ultra Turrax mixer (16![[thin space (1/6-em)]](https://www.rsc.org/images/entities/char_2009.gif) 000 rpm) and wet-milling were evaluated after inline crystallisation. While sonication was able to break the aggregates into its individual crystals, these methods should be able to further mill the individual crystal to lower sizes. However, sonication seems to be more efficient in decreasing particle sizes than the Ultra Turrax mixer and wet-milling approach (see particle sizes in Table 5). Surprisingly, with wet-milling even slightly larger agglomerates were obtained compared to only inline crystallisation. Nevertheless, the conversion rates for both suspensions were determined and are shown in Fig. 14. Ultra Turrax de-aggregation, much like sonication, did not improve nor reduce reaction rates. The larger aggregates obtained after wet milling did show slower conversion, most likely due to a denser packing of the crystallites, as is visible in the microscopic images (Fig. 15).
000 rpm) and wet-milling were evaluated after inline crystallisation. While sonication was able to break the aggregates into its individual crystals, these methods should be able to further mill the individual crystal to lower sizes. However, sonication seems to be more efficient in decreasing particle sizes than the Ultra Turrax mixer and wet-milling approach (see particle sizes in Table 5). Surprisingly, with wet-milling even slightly larger agglomerates were obtained compared to only inline crystallisation. Nevertheless, the conversion rates for both suspensions were determined and are shown in Fig. 14. Ultra Turrax de-aggregation, much like sonication, did not improve nor reduce reaction rates. The larger aggregates obtained after wet milling did show slower conversion, most likely due to a denser packing of the crystallites, as is visible in the microscopic images (Fig. 15).
| Method | θ average (μm) | θ median (μm) | Transmission (%) | Yield (%) at 30 min |
|---|---|---|---|---|
| Inline crystallisation | 216 | 132 | 9.7 | 98 |
| Sonication (40 min) | 75 | 59 | 3.4 | 92 |
| Ultra Turrax (40 min) | 143 | 90 | 9.9 | 99 |
| Wetmilling (15 min) | 278 | 185 | 14.5 | 69 |
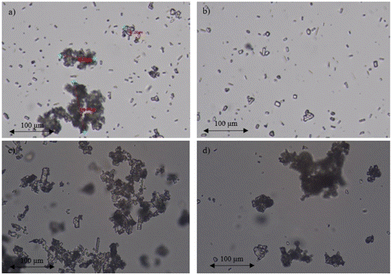 | ||
| Fig. 15 Microscopic view (×40) of the crystal size after (a) inline crystallisation, (b) sonication, (c) Ultra Turrax and (d) wetmilling. | ||
As such, it is clear that simple inline crystallisation provides the fastest converting particle suspensions (Fig. 14). The microscopic pictures in Fig. 15, suggested that bigger clusters consisting of smaller particles are most suitable for this photochemical conversion. As such, the conversions upon sonication may indicate a poor irradiation of the bottom layers of the reactor. The transmission of light in the suspension for all the different methods was measured to identify potential differences in light penetration between sonicated and non-sonicated samples (Table 5). As expected, a trend was visible where a larger amount of small particles creates a more turbid suspension compared to a smaller amount of larger particles, although the difference is relatively small. In addition, Debrouwer et al. showed by CFD simulations that a pulsation amplitude of 33% combined with a flow rate of 1 mL min−1 has a decent mixing in the vertical direction, creating regular refreshment of the top irradiated layer.30
Increase of the slurry density using the most optimal process parameters
Having established a fully continuous system which reaches complete conversion, additional efforts were made to increase the material throughput. This was done by increasing the slurry density. To exclude interfering effects on the crystal sizes, it was decided to first prepare a 2 g L−1 slurry and concentrate this to the desired density by removing solvent after centrifugation. Starting with the most optimal process parameters of the screening above, a 5 g L−1 slurry was tested. Although the particle size distribution was kept constant, a significant drop in yield was noticed. It is a possibility that internal mixing becomes the limiting factor at higher densities, especially because of the lower light penetration caused by a lower light transmission (% T: 1.2%). Therefore, a slightly higher pulsator amplitude was tested to increase this mixing with the aim to obtain a better yield (Fig. 16). Nevertheless, it did not result in a better conversion and a similar trend was observed as in the previous pulsator amplitude optimisation (Fig. 12). In fact, this confirms that 30% pulsator amplitude is indeed optimal.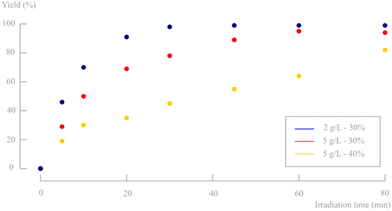 | ||
| Fig. 16 Influence of a higher slurry density and higher pulsator amplitude on the reaction yield. Only d,l-1 and d,l-2 are observed on 1H-NMR and no byproducts or degradation products are formed. | ||
The productivity of a 2 g L−1 slurry density at 30 minutes residence time is approximately equal to a 5 g L−1 at 60 minutes. The major difference is the amount of used solvent, being much higher for a 2 g L−1 density. However, since the solvent is only water (and traces of acetonitrile (54 mL L−1 water)), preference is given to full conversion in the 2 g L−1 experiment (vs. 94% for the 5 g L−1) to ensure that simple filtration suffices to isolate the pure product.
Productivity comparison with previous research
Some studies were previously published on the use of aqueous crystalline suspensions for photodecarbonylation chemistry in recirculating “continuous flow-like” batch setups. To compare our productivity to these reactor set-ups, the space–time yield (STY) is used (kg h−1 m−3) (eqn (2)). | (2) |
Veerman et al. reported the photodecarbonylation of dicumyl ketone in a recirculated immersion well reactor setup (3.3 L).31 On a 10 gram scale, a productivity of 0.5 g h−1 was obtained with a corresponding STY of 0.16 kg h−1 m−3. Hernández-Linares reported the photodecarbonylation of the chiral (+)-(2R,4S)-2-carbomethoxy-4-cyano-2,4-diphenyl-3-pentanone in a similar recirculated twin serial reactors system (1.7 L). Here, a STY of 0.29 kg h−1 m−3 was obtained with a productivity of 0.5 g h−1 on a 15 gram scale.32 However, both protocols do not have the capability of continuous production since batch reactors are used in a recirculated setup, disadvantageous for photochemistry causing very long irradiation times. In this research, a productivity of 0.054 g h−1 is achieved. Although this is substantially lower than previously reported literature, it seems more reasonable to compare the STY considering the significantly smaller reactor volume in our approach (15 mL vs. 1700 mL). For the current photodecarbonylation process, a STY of 3.6 kg h−1 m−3 is obtained, which represents a 12-fold improvement compared to the best performing literature example.
Conclusions
In this research, the first fully continuous solid-to-solid photochemical reaction was successfully optimised, showing that suspensions should not necessarily be a problem within this technology. Despite the use of a proof-of-concept substrate, several interesting conclusions can be made for the application of solid-to-solid photochemistry in continuous flow. To obtain maximal productivity, an efficient photon use is of prime importance and effort should be put into the selection of the most optimal light source for the desired chemical conversion. Subsequently, inline crystallisation has the benefit of continuous synthesis, while having more control over crystallisation conditions and particle sizes, as compared to batch flash nanoprecipitation. In addition, mixing was optimized and a rather low amplitude (30%) was found to be most beneficial to avoid too much backmixing. It has to be noted that the pulsator amplitude should to be optimized for every substrate, as it is related to the reaction time to some extent. Furthermore, back pressure was found to be beneficial in terms of conversion. Extensive research was put into the influence of particle size on the photochemical conversion, as we did not achieve the envisioned nanocrystal sizes in the current set-up. Several particle size reducing methods (sonication, Ultra Turrax, wetmilling) were discussed on their ability to decrease sizes and subsequently increase photochemical conversion rate. Nevertheless, it was found that some methods were not able to decrease particle sizes at all, and, quite surprisingly both smaller and larger particles (or agglomerates) did not result in higher conversion rates when compared to standard inline crystallisation. Lastly, a slurry density increase was evaluated to achieve higher material throughput. Unfortunately, the high drop in conversion rate could not sufficiently be compensated for and the final productivity remained more or less constant. Despite these identified hurdles, a continuous process for this proof-of-concept substrate was developed with a STY of 3.6 kg h−1 m−3, a 12-fold improvement with previously reported batch methods. This solid-to-solid photochemistry was performed at ambient temperature with environmentally benign water as an inert carrier. The product was simply obtained by filtration or centrifugation, without any additional purification. As such, the HANU™ 2X 15 flow photoreactor proved its benefit as process intensifying technology for the handling of slurries and suspensions in continuous flow photochemistry.Author contributions
Bavo Vandekerckhove – University of Ghent (Belgium), Faculty of Bioscience Engineering, Department of Sustainable Organic Chemistry and Technology, Coupure Links 653, B-9000 – designed the project, conducted all wet lab experiments, analysis and calculations, writing of the manuscript. Bart Ruttens – Ajinomoto Bio-Pharma Services Belgium, Cooppallaan 97, 9230 Wetteren, Belgium – supervised experiments, technical input. Bert Metten – Ajinomoto Bio-Pharma Services Belgium, Cooppallaan 97, 9230 Wetteren, Belgium – designed and supervised the project, technical input. Christian V. Stevens – University of Ghent (Belgium), Faculty of Bioscience Engineering, Department of Green Chemistry and Technology, Coupure Links 653, B-9000 Ghent – designed and supervised the project and edited the manuscript. Thomas S. A. Heugebaert – University of Ghent (Belgium), Faculty of Bioscience Engineering, Department of Green Chemistry and Technology, Coupure Links 653, B-9000 Ghent – designed and supervised the project, contributed to the implementation of the research, to the analysis of the results, to the writing of the manuscript. Email: E-mail: Thomas.Heugebaert@UGent.be.Conflicts of interest
There are no conflicts to declare.Acknowledgements
The authors are indebted to VLAIO – Belgium (Baekeland HBC.2021.0198) for financial support.Notes and references
- M. Isomura, D. Petrone and E. Carreira, Construction of Vicinal Quaternary Centers via Iridium-Catalyzed Asymmetric Allenylic Alkylation of Racemic Tertiary Alcohols, J. Am. Chem. Soc., 2021, 143, 3323–3329 CrossRef CAS PubMed.
- D. Pierrot and I. Marek, Synthesis of Enantioenriched Vicinal Tertiary and Quaternary Carbon Stereogenic Centers within an Acyclic Chain, Angew. Chem., 2020, 59, 36 CrossRef CAS PubMed.
- For select synthetic strategies to form vicinal quaternary stereocenters, see: (a) W. Shao, J. Huang, K. Guo, J. Gong and Z. Yang, Total Synthesis of Sinensilactam A, Org. Lett., 2018, 20, 1857–1860 CrossRef CAS PubMed; (b) E. Picazo, L. A. Morrill, R. B. Susick, J. Moreno, J. M. Smith and N. K. Garg, Enantioselective Total Syntheses of Methanoquinolizidine-Containing Akuammiline Alkaloids and Related Studies, J. Am. Chem. Soc., 2018, 140, 6483–6492 CrossRef CAS PubMed; (c) L. Deng, M. Chen and G. Dong, Concise Synthesis of (−)-Cycloclavine and (−)-5-epi-Cycloclavine via Asymmetric C−C Activation, J. Am. Chem. Soc., 2018, 140, 9652–9658 CrossRef CAS PubMed; (d) J. C. Hethcox, S. E. Shockley and B. M. Stoltz, Enantioselective Synthesis of Vicinal All-Carbon Quaternary Centers via Iridium-Catalyzed Allylic Alkylation, Angew. Chem., Int. Ed., 2018, 57, 8664–8667 CrossRef CAS PubMed; (e) G. Zhu, C. Zhou, S. Chen, S. Fu and B. Liu, Construction of BCDEF Core of Andilesin C, Org. Lett., 2019, 21, 7809–7812 CrossRef CAS PubMed; (f) J. H. Kim, Y. Chung, H. Jeon, S. Lee and S. Kim, Stereoselective Asymmetric Synthesis of Pyrrolidine with Vicinal Stereocenters Using a Memory of Chirality-Assisted Intramolecular SN2’ Reaction, Org. Lett., 2020, 22, 3989–3992 CrossRef CAS PubMed; (g) M. Poliakoff, J. M. Fitzpatrick, T. R. Farren and P. T. Anastas, Green Chemistry: Science and Politics of Change, Science, 2002, 297, 807–810 CrossRef CAS PubMed.
- J. J. Dotson, L. Liepuoniute, J. L. Bachman, V. M. Hipwell, S. I. Khan, K. N. Houk, N. K. Garg and M. A. Garcia-Garibay, Taming Radical Pairs in the Crystalline Solid State: Discovery and Total Synthesis of Psychotriadine, J. Am. Chem. Soc., 2021, 143, 4043–4054 CrossRef CAS PubMed.
- T. Laue and A. Plagens, Named Organic Reactions, John Wiley & Sons, 2nd edn, 2005, p. 320 Search PubMed.
- S. Shiraki, A. Natarajan and M. A. Garcia-Garibay, The Synthesis and Stereospecific Solid-State Photodecarbonylation of Hexasubstituted Meso- and d,l-Ketones, Photochem. Photobiol. Sci., 2011, 10(9), 1480 CrossRef CAS PubMed.
- J. J. Dotson, N. K. Garg and M. A. Garcia-Garibay, Evaluation of the photodecarbonylation of crystalline ketones for the installation of reverse prenyl groups on the pyrrolidinoindoline scaffold, Tetrahedron, 2020, 131181 CrossRef CAS PubMed.
- T. Y. Chang, J. J. Dotson and M. A. Garcia-Garibay, Scalable Synthesis of Vicinal Quaternary Stereocenters via the Solid-State Photodecarbonylation of a Crystalline Hexasubstituted Ketone, Org. Lett., 2020, 22(22), 8855–8859 CrossRef CAS PubMed.
- S. Shiraki, A. Natarajan and M. A. Garcia-Garibay, The synthesis and stereospecific solid-state photodecarbonylation of hexasubstituted meso- and d,l-ketones, Photochem. Photobiol. Sci., 2011, 1480–1487 CrossRef CAS PubMed.
- N. V. Lebedeva, V. F. Tarasov, M. J. E. Resendiz, M. A. Garcia-Garibay, R. C. White and M. D. E. Forbes, The Missing Link Between Molecular Triplets and Spin-Polarized Free Radicals: Room Temperature Triplet States of Nanocrystalline Radical Pairs, J. Am. Chem. Soc., 2010, 132(1), 82–84 CrossRef CAS PubMed.
- F. Family and M. A. Garcia-Garibay, Photodecarbonylation of Ketodiacids as Ammonium Salts: Efficient Formation of C−C Bonds Between Adjacent Quaternary Centers in the Crystalline State, J. Org. Chem., 2009, 74(6), 2476–2480 CrossRef CAS PubMed.
- M. Hurevich, J. Kandasamy, B. M. Ponnappa, M. Collot, D. Kopetzki, D. T. McQuade and P. H. Seeberger, Continuous Photochemical Cleavage of Linkers for Solid-Phase Synthesis, Org. Lett., 2014, 16(6), 1794–1797 CrossRef CAS PubMed.
- K. Loubière, M. Oelgemöller, T. Aillet, O. Dechy-Cabaret and L. Prat, Continuous-flow photochemistry: A need for chemical engineering, Chem. Eng. Process.: Process Intesif., 2016, 104, 120–132 CrossRef.
- A. Albini, Photochemistry, The Framework of Photochemistry: The Laws, Springer, Berlin, Heidelberg, 2016 Search PubMed.
- Analytik Jena, https://www.analytik-jena.us/products/lab-equipment/ultraviolet-products/uv-handlamps/uvp-xx-series-uv-bench-lamps/ (accessed March 15, 2023).
- J. Tao, S. F. Chow and Y. Zheng, Application of flash nanoprecipitation to fabricate poorly water-soluble drug nanoparticle, Acta Pharm. Sin. B, 2019, 4–18 CrossRef PubMed , ISSN 2211-3835.
- B. G. Carvalho, B. T. Ceccato, M. Michelon, S. W. Han and L. G. de la Torre, Advanced Microfluidic Technologies for Lipid Nano-Microsystems from Synthesis to Biological Application, Pharmaceutics, 2022, 14, 141 CrossRef CAS PubMed.
- J. Zong and J. Yue, Continuous Solid Particle Flow in Microreactors for Efficient Chemical Conversion, Ind. Eng. Chem. Res., 2022, 61(19), 6269–6291 CrossRef CAS.
- Creaflow, https://www.creaflow.be/hanutm-flow-reactors (accessed March 14, 2023).
- B. Vandekerckhove, N. Piens, B. Metten, C. V. Stevens and T. S. A. Heugebaert, Practical Ferrioxalate Actinometry for the Determination of Photon Fluxes in Production-Oriented Photoflow Reactors, Org. Process Res. Dev., 2022, 26(8), 2392–2402 CrossRef CAS.
- P. Bianchi, J. Williams and C. O. Kappe, Oscillatory flow reactors for synthetic chemistry applications, J. Flow Chem., 2020, 10, 475–490 CrossRef CAS.
- H. Jian and X. Ni, A Numerical Study on the Scale-Up Behaviour in Oscillatory Baffled Columns, Chem. Eng. Res. Des., 2005, 10, 1163–1170 CrossRef.
- H. Schlichting and K. Gersten, Boundary-Layer Theory, Springer, 2017, 978-3-662-52919-5 Search PubMed.
- S. Wah Keng, T. Mohd Sobri, K. Siti Kartom, T. Meor Zainal Meor and H. Nursul, Numerical Simulation of Fluid Flow Behaviour on Scale Up of Oscillatory Baffled Column, J. Eng. Sci. Technol., 2012, 7(1), 119–130 Search PubMed.
- T. McGlone, N. Briggs, C. Clark, C. Brown, J. Sefcik and J. Florence Alastair, Oscillatory flow reactors (OFRs) for continuous manufacturing and crystallization, Org. Process Res. Dev., 2015, 19(9), 1186–1202 CrossRef CAS.
- R. Kacker, S. I. Regensburg and H. J. M. Kramer, Residence time distribution of dispersed liquid and solid phase in a continuous oscillatory flow baffled crystallizer, Chem. Eng. J., 2017, 413–423 CrossRef CAS.
- M. Avila, D. F. Fletcher, M. Poux, C. Xuereb and J. Aubin, Mixing performance in continuous oscillatory baffled reactors, Chem. Eng. Sci., 2020, 219, 0009–2509 CrossRef.
- M. Zheng, J. Li, M. R. Mackley and J. Tao, The development of asymmetry for oscillatory flow within a tube containing sharp edge periodic baffles, Phys. Fluids, 2007, 19(11), 114101 CrossRef.
- C. Rosso, S. Gisbertz, J. D. Williams, H. P. L. Gemoets, W. Debrouwer, B. Pieber and C. O. Kappe, An oscillatory plug flow photoreactor facilitates semi-heterogeneous dual nickel/carbon nitride photocatalytic C–N couplings, React. Chem. Eng., 2020, 5, 597–604 RSC.
- W. Debrouwer, W. Kimpe, R. Dangreau, K. Huvaere, H. P. L. Gemoets, M. Mottaghi, S. Kuhn and K. Van Aken, Ir/Ni Photoredox Dual Catalysis with Heterogeneous Base Enabled by an Oscillatory Plug Flow Photoreactor, Org. Process Res. Dev., 2020, 24(10), 2319–2325 CrossRef CAS.
- M. Veerman, M. J. E. Resendiz and M. A. Garcia-Garibay, Large-Scale Photochemical Reactions of Nanocrystalline Suspensions: A Promising Green Chemistry Method, Org. Lett., 2006, 8(12), 2615–2617 CrossRef CAS PubMed.
- M. G. Hernández-Linares, G. Guerrero-Luna, S. Pérez-Estrada, M. Ellison, M. Ortin and M. A. Garcia-Garibay, Large-Scale Green Chemical Synthesis of Adjacent Quaternary Chiral Centers by Continuous Flow Photodecarbonylation of Aqueous Suspensions of Nanocrystalline Ketones, J. Am. Chem. Soc., 2015, 137(4), 1679–1684 CrossRef PubMed.
Footnote |
| † Electronic supplementary information (ESI) available. See DOI: https://doi.org/10.1039/d4re00058g |
| This journal is © The Royal Society of Chemistry 2024 |


