 Open Access Article
Creative Commons Attribution 3.0 Unported Licence
Generation of nitrogen by means of electrochemical oxygen depletion†
Dominik
Sachse
 ac,
Basil Noha
Chelachottil
a,
Andreas
Glüsen
 *a,
Martin
Müller
 a,
Uwe
Rau
 bc and
Ralf
Peters
 ad
ad
aForschungszentrum Jülich GmbH, Institute of Energy and Climate Research, IEK-14: Electrochemical Process Engineering, 52428 Jülich, Germany. E-mail: a.gluesen@fz-juelich.de
bForschungszentrum Jülich GmbH, Institute of Energy and Climate Research, IEK-5: Photovoltaics, 52428 Jülich, Germany
cJülich Aachen Research Alliance (JARA-Energy) and Faculty of Electrical Engineering and Information Technology, RWTH Aachen University, Schinkelstr. 2, 52062 Aachen, Germany
dRuhr-Universität Bochum, Faculty of Mechanical Engineering, Synthetic Fuels, Universitätsstr. 150, 44801 Bochum, Germany
First published on 16th April 2024
Abstract
Ammonia in the form of fertilizer is essential for feeding the world's population. It consists of hydrogen and nitrogen, with the latter being sourced from atmospheric nitrogen via diverse methodologies. Commonly utilized processes are cryogenic or pressure swing adsorption. Due to the necessity of mitigating climate change, it is important to obtain ammonia and nitrogen in an environmentally friendly, energy and resource-efficient way. Electrochemical oxygen reduction by means of an oxygen depolarized cathode offers a promising green, carbon dioxide neutral nitrogen separation possibility with the supply of renewable energy. In this paper, electrochemical single cells based on proton conducting polymer electrolyte membranes are investigated with respect to different operating parameters, including cell and process ones. Depending on the air flow rate and maximum current provided, the oxygen content within the gas stream is reduced to <1%. This reduction in oxygen content is achieved while maintaining a commendably high Faraday efficiency of 90% across a wide potential range. These outcomes underscore the potential of electrochemical cells as environmentally-friendly and efficient technologies for enriching nitrogen.
1. Introduction
Electrochemical oxygen depletion using an oxygen depolarized cathode offers the possibility of a green, carbon dioxide-neutral, separation of nitrogen and oxygen from air. The generated nitrogen can be used as a source for the electrochemical ammonia synthesis. The electrochemical ammonia synthesis enables less energy-intensive, carbon dioxide-neutral ammonia production.1–4 Moreover, ammonia is useable as a fuel or source of hydrogen due to its high energy density.5 In addition, especially in the present time, electrochemical synthesis offers decentralized production.6 For electrochemical ammonia synthesis, nitrogen and hydrogen are needed as reactants. During the electrochemical reaction using oxygen-depolarized cells, water is oxidized at the anode, where protons and oxygen are also produced. The pure oxygen can be used in different fields such as in medicine, including in the treatment of patients suffering from heart or lung diseases.7 O2 can also be used as an oxidant in fuel cells, instead of air. The partial pressure is higher and the needed volume is less. Fuel cells enable a carbon dioxide neutral energy supply.8 Argon, carbon dioxide (CO2), and other noble gases are still present in the gas. The noble gases do not influence the process. CO2 can be removed by means of liquid or solid adsorbents.9Currently, for the large-scale separation of nitrogen and oxygen cryogenic and pressure swing adsorption (PSA) are the most utilized technologies.7 In the cryogenic process, air is first purified and then the air components are subsequently separated via distillation.10 The cryogenic distillation enables a pure production of nitrogen (>99%), with the required products being in liquefied form. Nevertheless, it is also an energy intensive method.11 Cryogenic nitrogen requires about 0.7 kW h per norm cubic meter (Nm3) of N2 resulting in 0.89 kW h for 1 kg N2 (ρ(N2) = 1.25 kg m−3).12 The separation of the PSA is performed by the contact and adsorption of certain gas components like O2 on a microporous–mesoporous solid adsorbent at a relatively high pressure. The adsorbent can be reused by lowering the superincumbent gas-phase partial pressure inside the column, hence the adsorbed components desorb.13 The PSA enables a nitrogen purity of 98–99.5%.11 Furthermore, this technique is considered energy-intensive.14 The required electrical power for nitrogen PSA is 0.31 kW h per norm cubic meter of N2 resulting in 0.39 kW h for 1 kg of N2 at 1% O2. The required electrical power depends on the remaining oxygen content. In case of remaining 0.1% O2 the needed power is 0.58 kW h for 1 kg of N2.12
Another separation technology is electrochemical separation by means of a polymer electrolyte membrane. The system can work in an alkaline or acidic medium, depending on the membrane, catalysts, and electrodes. In the case of an acidic environment, the well-known proton-conducting polymer electrolyte membrane (PEM) Nafion® can be used.15 In this application, during the electrochemical process, water is introduced on the anode side, while air is supplied at the cathode. A potential is applied across the cell. The water molecules at the anode oxidizes (eqn (1)), resulting in the generation of protons (H+) and O2.
| 2H2O → 4H+ + 4e− + O2 (Anode reaction) | (1) |
| O2 + 4H+ + 4e− → 2H2O (Cathode reaction) | (2) |
| Nernst equation: U = U0 + RT/(zF)·ln(COx/CRe) | (3) |
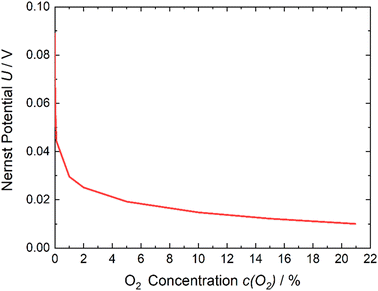 | ||
| Fig. 1 Nernst potential – oxygen content dependency. With decreasing amounts of oxygen on the cathode side, the potential required to run the reaction increases. | ||
H2 can be produced at the cathode at a potential of 1.23 V as well. Under this condition, it must be assured that operation is always outside the explosion limits of the ternary mixture of H2, O2, and N2. An explosive mixture is formed when hydrogen and oxygen contents are higher than 4% in the gas mixture.16 H2 can be used as an energy source17 or a recombination with the remaining oxygen is possible to reduce the oxygen content even further.18
In this paper, different operating parameters are outlined, such as: temperature, the flow rate of air and water, potential, hot pressing of the membrane with catalyst layers, the active cell area, and the membrane thickness regarding their influence on oxygen reduction using a depolarized cathode. In addition, the Faraday efficiency (FE) is studied with respect to the production of pure nitrogen. This oxygen reduction and nitrogen enrichment technology enables a portable, easy-to-handle system for generating pure nitrogen for electrochemical ammonia synthesis.
2. Experimental
The cell is a combination of a fuel cell cathode 1.3–1.4 mg cm−2 Pt/C HiSpec 9100 supported on carbon felt H2315 CX312 from Freudenberg and a PEM electrolysis anode 2 mg cm−2 IrOx from Alfa Aesar-/Thermo Fisher Scientific supported on a carbon paper from Toray, TFP-H 120® The Pt/C cathode is produced by means of the decal method and the IrOx layer via spray coating directly onto the membrane. Both electrodes were produced in house. These electrodes have high active surface areas and are fairly common materials.19,20 ESI† Fig. S1 illustrates the electrochemical cell and its corresponding flow field structure. Alternative materials were not considered, because these catalysts consistently yielded the most favorable outcomes, as asserted by Giddey et al.7 As PEM, Nafion™ membranes (Chemours) with different thicknesses were used. The active cell area was 6.25 cm2 and 17.64 cm2 in the smaller and larger cell. A hot-pressing process was studied with regard to oxygen depletion and cell performance. During hot pressing, the cathode electrode and anode gas diffusion layer are pressed together with the membrane (the anode cathode was sprayed onto the membrane directly), which leads to better ionic conductivity, and so a higher current density.21 This technique is used by default in water electrolysis.22 Hot pressing is performed at 130 °C the glass transition temperature of Nafion and 0.5 kN cm−2. The anode bipolar plate is stainless steel coated with platinum and the cathode bipolar plate is stainless steel coated with gold. The flow field in the bipolar plates features a meandering structure. The cell assembly process initially involves tightening the screws at a torque of 3 Nm, followed by a secondary tightening step at 5 Nm. The 5 Nm tightening is then repeated to ensure secure sealing. The quantification of the oxygen content is measured using the oxygen sensor “OMD-507 Oxygen Analyzer” from Southland Sensing, while the hydrogen content is measured with the sensor “FTC 300” from Messkonzept. It is noteworthy that both sensors have a specified error of 1% of their selected measuring range. The used mass flow controller for the air flux is from Brooks Instruments MultiFlo™ “GF40”. The mass flows were calibrated to 0 °C by Brooks Instruments and are given in NmL (norm milliliter). The air flow rates employed in this study conform to the prescribed standard flow rates as established in the literature, specifically 10, 50, and 100 NmL min−1. At the same time, the water flow rate was maintained at a constant rate of 10 NmL min−1.The maximum possible consumption of oxygen is limited through the current supply provided by the power station. The potentiostat, which was utilized in all experiments, is from Ivium the “Ocotostat 500” and has a maximum current supply of 5 A. The used current range of the potentiostat was ±10 Å and the measured current accuracy is 0.025% of the applied current range. If Faraday's law is considered (eqn (4))
| Q = n·F·z | (4) |
| p·V = n·R·T | (5) |
![[thin space (1/6-em)]](https://www.rsc.org/images/entities/char_2009.gif) 485 C mol−1, Q is the charge and n the number of mols. The resulting pressure of the experiments is atmospheric pressure p = 101
485 C mol−1, Q is the charge and n the number of mols. The resulting pressure of the experiments is atmospheric pressure p = 101![[thin space (1/6-em)]](https://www.rsc.org/images/entities/char_2009.gif) 325 Pa and z is the number of electrons. Four electrons are needed for the O2 reduction reaction. The calculation is based on a temperature of 273.15 K, because the mass flow controllers were calibrated at 0 °C. If a current of 5 Å is supplied for 1 min, it results in the amount of substance of 7.77 × 10⁻⁴ mol and hence, an oxygen volume of 17.42 NmL min−1. The oxygen content 20.94%23 of an air flow rate of 100 NmL min−1 (20.94 ml O2) is a little above the maximum content of oxygen, which can be reduced. Nevertheless, the flow rates of 10, 50, and 100 NmL min−1 are used as standard flow rates. In terms of the active cell area 17.64 cm2, these are 0.57 ≈ 0.6 NmL min−1 cm−2, 2.83 ≈ 3 NmL min−1 cm−2 and 5.67 ≈ 6 NmL min−1 cm−2.
325 Pa and z is the number of electrons. Four electrons are needed for the O2 reduction reaction. The calculation is based on a temperature of 273.15 K, because the mass flow controllers were calibrated at 0 °C. If a current of 5 Å is supplied for 1 min, it results in the amount of substance of 7.77 × 10⁻⁴ mol and hence, an oxygen volume of 17.42 NmL min−1. The oxygen content 20.94%23 of an air flow rate of 100 NmL min−1 (20.94 ml O2) is a little above the maximum content of oxygen, which can be reduced. Nevertheless, the flow rates of 10, 50, and 100 NmL min−1 are used as standard flow rates. In terms of the active cell area 17.64 cm2, these are 0.57 ≈ 0.6 NmL min−1 cm−2, 2.83 ≈ 3 NmL min−1 cm−2 and 5.67 ≈ 6 NmL min−1 cm−2.
The test setup, illustrated schematically in Fig. 2, was constructed to realize the experiments. Water was pumped with a circulation pump into the anode to provide the protons. The mass flow controller delivers the specific air flow rates to the cathode. Based on the reaction equation, eqn (2), water is produced on the cathode side. In addition, water from the anode side can move through the membrane via diffusion and electroosmotic drag. The water is emitted on the cathode side with the nitrogen, remaining oxygen (also noble gases and carbon dioxide), and possible produced hydrogen. Hence, the water influences the total volume flux and so the values of the O2 and H2 sensors. As of the temperature, the partial pressure of water is influenced,24 as is the gaseous volume. Therefore, a water condenser is integrated into the system to remove it from the gas stream. Thus, the gaseous volume of water is reduced. The water condenser cools the gas down to 3 °C. Hence, the water volume content of the gas is 0.75% (758.05/101![[thin space (1/6-em)]](https://www.rsc.org/images/entities/char_2009.gif) 325 Pa) of the gas stream. In comparison, the water content is 3.13% (3170/101
325 Pa) of the gas stream. In comparison, the water content is 3.13% (3170/101![[thin space (1/6-em)]](https://www.rsc.org/images/entities/char_2009.gif) 325 Pa) of the gas stream at room temperature. The O2 and H2 content are measured with their corresponding sensors.
325 Pa) of the gas stream at room temperature. The O2 and H2 content are measured with their corresponding sensors.
 | ||
| Fig. 2 Schematic illustration of the operating system. Water is introduced on anode side and air on cathode side. | ||
3. Results
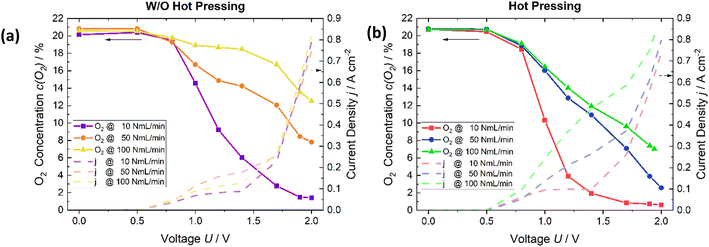
This study investigated the cell parameters of membrane thickness and size of the active cell area, as well as the influence of the process engineering parameters, the hot pressing of the cathode layer on the membrane, air flow rate, water condensation, and temperature effects.A cell with an active cell area of 6.25 cm2 was used to analyze the impact of hot pressing at room temperature. The employed air flow rates were, as previously mentioned, 10, 50, and 100 NmL min−1. The water flow rate was maintained at a constant rate of 10 NmL min−1. The water flow rate was also changed and studied; however, the experimental outcomes indicated that alteration in the water flowrate does not influence the extent of the oxygen reduction (see ESI† Fig. S2). The effect of hot pressing on the oxygen reduction is studied by measuring the oxygen ratio in the gas at the respective potentials. These oxygen values are then compared with the results of a cell that is not hot pressed.
For all flow rates, the remaining oxygen decreases more strongly of the MEA cell which is hot pressed (Fig. 3b) than the MEA cell which is not hot pressed (Fig. 3a). In the circumstance of 100 ml min−1, the oxygen content decreases from 13% to 7%. For the applied air flow rate of 50 ml min−1, the decline is from 8% to 3%, and for the last flow rate of 10 NmL min−1, it is from 1.5% to 0.5% at a potential of 2 V with a comparable concentration also being obtained at lower voltages also. Furthermore, as is written in ref. 21, the current densities increase due to hot pressing. Thus, it has a positive effect on the electrochemical cell's performance. Therefore, this method was used for the subsequent cell assemblies.
In Fig. 4, the thickness of the membrane is analyzed comparing Nafion 115 (127 μm thick, red) and Nafion 212 (51 μm thick, blue). The results are only studied for an air flow rate of 10 NmL min−1. Both membranes exhibit the same reduction in oxygen while applying a flow rate of 10 NmL min−1 (Fig. 4a). In the case where only oxygen reduction occurs below 1.23 V, the current densities of both membranes are equal. Starting from approximately 1.4 V the current densities of Nafion 212 increases more strongly than in the case of Nafion 115. Nafion 212 is thinner than Nafion 115 therefore the ohmic resistance is lower. This leads to a higher current flow at the same applied potential.
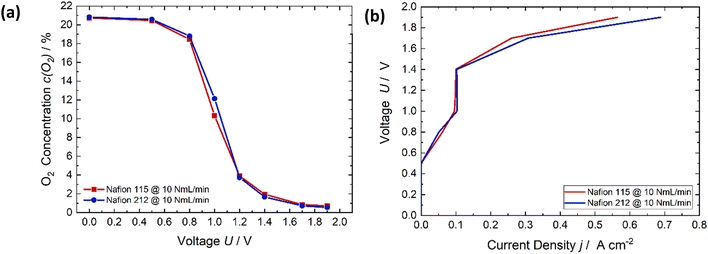 | ||
| Fig. 4 (a) Comparison of the oxygen content of different membrane thicknesses (127 μm, red and 51 μm, blue). (b) The respective voltage-current characteristic showing that there is no clear trend. | ||
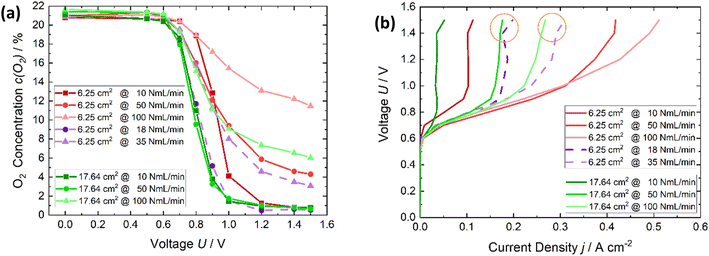
The results of the comparison of different active cell areas are displayed in Fig. 5. Fig. 5a shows in red, the oxygen depletion of the active cell area of 6.25 cm2 with air flow rates of 10, 50 and 100 NmL min−1. In violet are marked the results of the flow rates, which are referred on an area of 1 cm2, resulting in flow rates of 3 and 6 NmL min−1 cm−2, which are the same flow rates referred on 1 cm2 as for the cell area of 17.64 cm2 with flow rates of 50 and 100 NmL min−1 to enable an area-related comparison of both cells. The oxygen reduction regarding 3 NmL min−1 cm−2 are similar. The oxygen reduction content is lower for the smaller cell area with respect to 6 NmL min−1 cm−2. However, due to the power station it must be said that a complete depletion of an air flow rate of 100 NmL min−1 is not possible. Thus, regarding 3 ml min−1 cm−2 there is no difference in the cells. In Fig. 6b the polarization curves of the data shown in Fig. 5a are plotted. If the area-related flux rate is considered again, the current density, with the larger cell area (17.64 cm2), being a bit lower. This means that the current, energy required for oxygen depletion is lower for the same specific conditions (ml min−1 cm−2). As a result, not only is the quantitative amount of oxygen depletion with the larger cell area higher but is also more efficient in terms of energy. In conclusion, it can be said that a larger cell area is beneficial for the oxygen depletion and nitrogen enrichment.
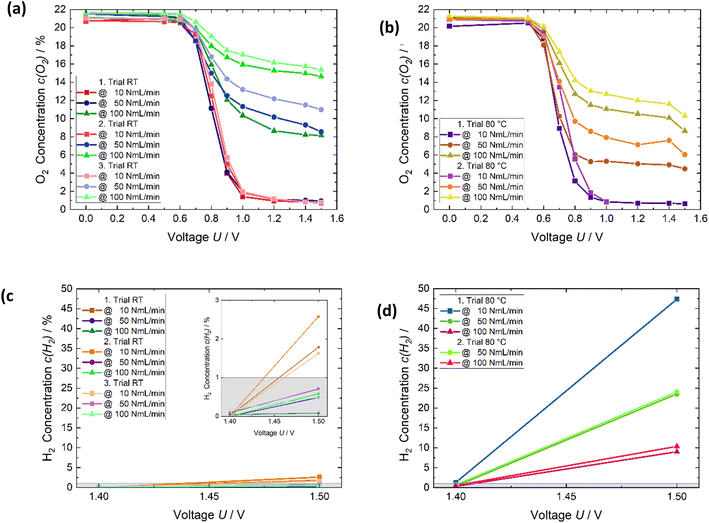
Fig. 6 shows the temperature influence, which was studied with respect to the extent of the oxygen reduction and hydrogen formation. In addition, the degradation effect was investigated, and occurs through the temperature change and repeated measurements. Fig. 6a displays the result and the respective trends of three tests at room temperature. The two measurements Fig. 6c and d exhibit the corresponding hydrogen results. In between the room temperature trials, the trials at 80 °C were measured. Fig. S3† illustrate schematically the measurement procedure for investigating the influence of temperature. For the lowest flow rate, 10 NmL min−1, the changing temperature and experiments had no influence on the performance of oxygen depletion (Fig. 6a and b). The oxygen content was roughly reduced to 1% from 1 V. In the case of 50 and 100 NmL min−1, the oxygen content in the gas increased strongly from the first to the second and third runs at room temperature (Fig. 6a). At a potential of 1.2 V the amount of oxygen increases from roughly 1% to 10% at 50 NmL min−1. The increase was from approximately 8% to 16% for 100 NmL min−1. It is assumed that caused by the temperature stress the oxygen reduction reaction was not so efficient anymore at room temperature.
The results applying 10 NmL min−1 were approximately the same at 80 °C as noted previously. There is a degradation from the first trial to the second in the case of the other flow rates at 80 °C. The oxygen quantity at 80 °C for both trials was lower compared to the second and third trials at room temperature due to the better kinetics at elevated temperatures. However, as written previously, if the results of the first and second trial of Fig. 6a are considered, it seems that the degradation is strengthened due to the temperature stress. The assumption is that the catalyst layer becomes ever more catalytically inactive, concerning the oxygen reduction reaction, but the kinetic becomes faster due to the temperature increase resulting in a higher oxygen reduction at 80 °C in comparison to the second and third trial at room temperature. Water condensation resulting in flooding the GDL and an impairment of the oxygen transfer to the cathode catalyst layer is a huge challenge in a fuel cell system.25 This is not a difficulty in this system and not the reason for the lower oxygen reduction, as the higher the air flow rate the better the removal of the water should be.
Fig. 6c and d presents the hydrogen concentration, which is measured. The hydrogen production strongly increases from room temperature to 80 °C. At room temperature, the amount of hydrogen is below 5% for all flow rates. The grey colored area displays the error margin of the hydrogen sensor, which is 1%. The produced hydrogen concentrations of the flow rates 50 and 100 NmL min−1 are in the error range. At 80 °C, it is higher than 10% for all flow rates. Repeating the measurement at 80 °C does not, degrade the hydrogen evolution. As expected, the kinetic in terms of hydrogen production is improved through the temperature increase. Furthermore, the lower the flow rate, the higher the amount of hydrogen. The reason for this is that in terms of 10 NmL min−1, most oxygen is already reduced at the higher potential, and hence the current, can be used for hydrogen evolution. The increase of the relative hydrogen extent from 1.4 V to 1.5 V is huge at 80 °C. Nevertheless, an overpotential is necessary to produce hydrogen. The increases production of hydrogen at elevated temperature is in this case, the competing reaction and reduces oxygen reduction.
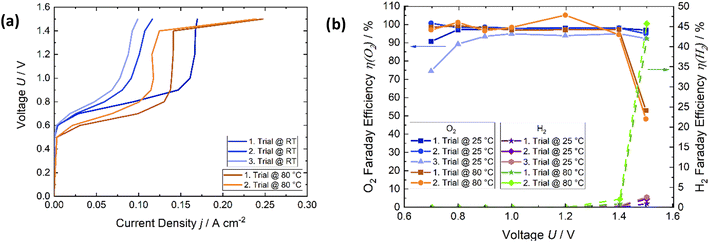
The results of temperature influence, degradation effects on the voltage–current characteristic, and subsequent determination of Faraday efficiency, are shown for the air flow rate of 50 NmL min−1 in Fig. 7. There are two distinct regions for both temperatures. The first region is the current density increase (Fig. 7a) from approximately 0.6 V to 0.9 V. The reactions according to eqn (1) and (2) occur when the oxygen out of the air gas stream is reduced to water and oxygen is produced at the anode. From 0.9 V to 1.4 V, the current remains almost constant. At a temperature of 80 °C, there is no current increase from 0.9 V to 1.4 V. Starting from 1.4 V, the second region occurs, and a second electrochemical reaction is carried out. Hydrogen evolution then starts to occur (2H+ + 2e− → H2). This leads to an increase in the current density. Hydrogen production and current density increase sharply at 80 °C and 1.5 V, which is due to the better catalytic kinetic that results in enhanced hydrogen production at 80 °C. This corresponds to the increasing hydrogen content in Fig. 6d compared to 6c. The current density decreases at room temperature, after applying 80 °C. This correlates with the effect of the increased measured oxygen content at room temperature. As is shown in Fig. 6, the air flow rate impacts the oxygen reduction and hydrogen production, and hence the current density. The higher the air flow rate, the higher the current density, which leads to higher absolute reductions of oxygen, but not relative ones. The Faraday efficiency of oxygen reduction (η(O2)) was close to 100% for the first and second trials at room temperature in the voltage range of 0.8–1.5 V with respect to the error (see Fig. 9). At 80 °C, the Faraday efficiency is close to 100% as well, but it drops sharply at 1.5 V because hydrogen formation significantly increases. Nevertheless, the Faraday efficiency is quite high over the temperature and voltage range.
In order to verify the oxygen reduction, process the reproducibility of the experiments was assessed and the influence of the error also examined (Fig. 8). The exact same measurement was repeated twice with two fresh cells and MEAs. An average value and the standard deviation were then calculated. The error of the oxygen sensor as written before was specified with 1% of the selected measuring range.
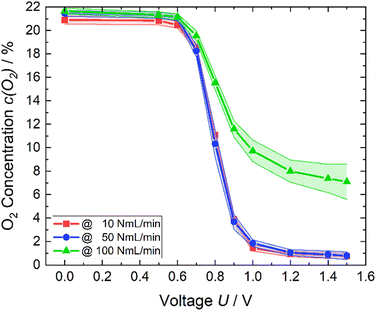 | ||
| Fig. 8 Remaining oxygen content (line with dots) and the resulting error (colored area) of each air flow rate. | ||
Concerning the measuring range of 0–25% of the sensor, which was used, resulted in an error of 0.25%. The total error is shown for each air flow rate of 10, 50, and 100 NmL min−1 as the colored area (Fig. 8). The error was bigger for smaller potentials in case of 10 NmL min−1 whereas for 50 NmL min−1, it was the other way around. However, the scattering of 10 and 50 NmL min−1 were fairly small. Applying 100 NmL min−1 leads to an increase in errors if the applied voltage becomes greater than 1.0 V.
An applied voltage greater than or equal to 1.2 V will cause the residual oxygen to drop below 1% while using 10 or 50 NmL min−1 as flow rates. It is possible to strongly enrich nitrogen. The parameters should be selected based on the desired result. Already at a potential of 1.0 V, the remaining oxygen quantity is only slightly larger than at 1.5 V. This means that one third of the energy can be saved. Furthermore, it must be considered which quantity of oxygen should be reduced and at which time. Time permitting, a flow rate of 10 NmL min−1 allows much lower power consumption than the flow rate of 50 NmL min−1.
As mentioned previously, a total depletion of an air flow rate of 100 NmL min−1 is not possible within the current limit of the potentiostat. This leads to a higher remaining oxygen content.
The affirmation of favorable outcomes for the air flow rate of 100 NmL min−1 is substantiated by the empirical results displayed in Fig. 9. The mean value of the Faraday efficiency of 100 NmL min−1 is approximately 97%, considering the error a Faraday efficiency of 100% is reached. The efficiency of 50 NmL min−1 is similar. Over the voltage range from 0.8 V to 1.5 V η(O2) remains stable, and close to 100%. The Faraday efficiency while applying 10 NmL min−1 exhibits a lower profile across the potential range. Expect at the applied potential of 1.4 V. Görlin et al.26 found in a study on oxygen evolution that oxidation of metal surfaces can significantly reduce the Faraday efficiency. We assume that a similar reaction may be the competing reaction here at the anode.
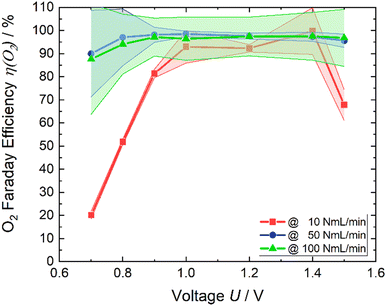 | ||
| Fig. 9 Faraday efficiency of oxygen (line with dots) and the respective error (colored area) of each air flow rate. | ||
Drawing on results of this work, a calculation was performed, to study how much energy is needed to produce 1 kg of nitrogen using the electrochemical oxygen depletion method. 1 kg of N2 corresponds to 0.79 Nm3 of N2. If the traces of CO2 and noble gases are neglected in air, the amount of N2 is 79% and O2 is 21% in the air. This leads to an inlet air gas stream of 1.0 m3. Hence, 0.21 Nm3/0.3 kg O2 (ρ(O2) = 1.43 kg m−3) needs to be reduced to generated 1 kg N2. The molar mass of oxygen is M(O2) = 32 g mol−1. The equation used to calculate the amount of substance is (eqn (6)).
| n = m/M | (6) |
| E = Q·U | (7) |
If it is assumed that the same oxygen amount is reached and the measured current is constant at 0.8 V due to the optimization of parameters, the required energy is E(0.8 V) = 0.79 kW h for 1 kg of N2. Considering Fig. 1 and eqn (1)–(3) to reach 1% of remaining O2 in the gas, the minimum required energy is E(0.03 V) = 0.03 kW h. If the actual energy requirement can be brought close to this value due to optimization of parameters like higher catalyst loading, larger active cell area, which lead to reducing over potentials, the process will be much more energetic efficient than the cryogenic distillation (0.89 kW h  ) and PSA (0.39 kW h
  ). For all methods the energy consumption increases in dependency of the desired purity of nitrogen. However, the needed energy increase of these methods is not equal.
Conclusion
An oxygen-depolarized cathode was studied for the reduction of oxygen and enrichment of nitrogen for the electrochemical ammonia synthesis. Through optimization of the cell and process parameters, the oxygen content in an air gas stream can be reduced to less than 1% oxygen in the gas stream. These parameters are the air flow rates, hot pressing, active cell area, membrane thickness, potentials, and temperature. A lower air flow rate, hot pressing and a larger active cell area lead to higher degrees of oxygen reduction. A low flow rate extends the residence time in the cell and therefore the reaction time. Hot pressing results in decreasing the ohmic resistance, which leads to higher current densities and due to the larger active cell area, the catalyst surface area is larger. This shows that a better MEA enables a better oxygen reduction and reduces the energy consumption. Higher potentials also lead to better oxygen reduction. However, depending on the air flow rate a maximum reduction is reached above a certain voltage. A maximum reduction is reached for an air flow rate of 10 NmL min−1 at 1.2 V. A further increase of voltage lead to higher losses and a less efficient system. A higher temperature leads to cell degradation and less oxygen reduction depending on the air flow rate. After the temperature increase, the oxygen content in the cathode outlet gas stream increased from 1% to 10% at an air flow rate of 50 NmL min−1 and 1.2 V at room temperature. Thus, operation at room temperature achieved much better oxygen depletion. No influence of membrane thickness could be detected in the experiments. The small single cell with an active area of 17.64 cm2 reduces the oxygen content below 1% in an air gas stream of 50 NmL min−1. The Faraday efficiency remains high and close to 100%, and stable across a wide potential range. With respect to the extent of remaining oxygen, air flow rate and energy consumption conditions can be chosen, which are suitable for their specific applications. The energy consumption calculation shows that the required energy needed to provide 1 kg of N2 by electrochemical oxygen depletion (1.18 kW h) is a little bit larger than cryogenic distillation (0.89 kW h ) and pressure swing adsorption (0.39 kW h
  ). We expect by reducing the over potentials the electrochemical oxygen depletion can be more efficient than the current technologies. Using renewable energy, the electrochemical oxygen reduction offers a very good possibility to extract green nitrogen from air and the production of pure oxygen at the anode. In addition, due to the easy cell setup, an up scaling is feasible to utilize higher air flow rates and distributed nitrogen production all over the world is possible.
Conflicts of interest
There are no conflicts to declare.Acknowledgements
This work was financially supported by the European Union's Horizon 2020 research and innovation program under the call H2020-LC-SC3-2020-RES-RIA. TELEGRAM project grant agreement no. 101006941.References
- X. Yang, et al., Mechanistic Insights into Electrochemical Nitrogen Reduction Reaction on Vanadium Nitride Nanoparticles, J. Am. Chem. Soc., 2018, 140, 13387–13391, DOI:10.1021/jacs.8b08379.
- T. Xu, et al., Recent Advances in Nonprecious Metal Oxide Electrocatalysts and Photocatalysts for N 2 Reduction Reaction under Ambient Condition, Small Sci., 2021, 1(5), 2000069, DOI:10.1002/smsc.202000069.
- H. Shen, et al., Electrochemical ammonia synthesis: Mechanistic understanding and catalyst design, Chem, 2021, 7(7), 1708–1754, DOI:10.1016/j.chempr.2021.01.009.
- D. Liu, et al., Development of Electrocatalysts for Efficient Nitrogen Reduction Reaction under Ambient Condition, Adv. Funct. Mater., 2021, 31(11), 2008983, DOI:10.1002/adfm.202008983.
- L. Hu, A. Khaniya, J. Wang, G. Chen, W. E. Kaden and X. Feng, Ambient Electrochemical Ammonia Synthesis with High Selectivity on Fe/Fe Oxide Catalyst, ACS Catal., 2018, 8(10), 9312–9319, DOI:10.1021/acscatal.8b02585.
- S. Z. Andersen, et al., Increasing stability, efficiency, and fundamental understanding of lithium-mediated electrochemical nitrogen reduction, Energy Environ. Sci., 2020, 13(11), 4291–4300, 10.1039/D0EE02246B.
- S. Giddey, F. T. Ciacchi and S. Badwal, High purity oxygen production with a polymer electrolyte membrane electrolyser, J. Membr. Sci., 2010, 346(1), 227–232, DOI:10.1016/j.memsci.2009.09.042.
- Energy.gov, Fuel Cells, https://www.energy.gov/eere/fuelcells/fuel-cells (accessed Sep. 3, 2023).
- C. Zhang, S. Sun, S. He and C. Wu, Direct air capture of CO2 by KOH-activated bamboo biochar, J. Energy Inst., 2022, 105, 399–405, DOI:10.1016/j.joei.2022.10.017.
- A. Smith and J. Klosek, A review of air separation technologies and their integration with energy conversion processes, Fuel Process. Technol., 2001, 70(2), 115–134, DOI:10.1016/S0378-3820(01)00131-X , Available: https://www.sciencedirect.com/science/article/pii/S037838200100131X.
- J. Rizk, M. Nemer and D. Clodic, A real column design exergy optimization of a cryogenic air separation unit, Energy, 2012, 37(1), 417–429, DOI:10.1016/j.energy.2011.11.012.
- A. Schulte-Schulze-Berndt and K. Krabiell, Nitrogen generation by pressure swing adsorption based on carbon molecular sieves, Gas Sep. Purif., 1993, 7(4), 253–257, DOI:10.1016/0950-4214(93)80026-S , Available: https://www.sciencedirect.com/science/article/pii/095042149380026S.
- S. Sircar, Pressure Swing Adsorption, Ind. Eng. Chem. Res., 2002, 41(6), 1389–1392, DOI:10.1021/ie0109758.
- B. Belaissaoui, Y. Le Moullec, H. Hagi and E. Favre, Energy Efficiency of Oxygen Enriched Air Production Technologies: Cryogeny vs Membranes, Energy Procedia, 2014, 63, 497–503, DOI:10.1016/j.egypro.2014.11.054.
- R. Kuwertz, C. Kirstein, T. Turek and U. Kunz, Influence of acid pretreatment on ionic conductivity of Nafion® membranes, J. Membr. Sci., 2016, 500, 225–235, DOI:10.1016/j.memsci.2015.11.022.
- V. Schröder, B. Emonts, H. Janßen and H.-P. Schulze, Explosion Limits of Hydrogen/Oxygen Mixtures at Initial Pressures up to 200 bar, Chem. Eng. Technol., 2004, 27(8), 847–851, DOI:10.1002/ceat.200403174.
- B. Johnston, M. C. Mayo and A. Khare, Hydrogen: the energy source for the 21st century, Technovation, 2005, 25(6), 569–585, DOI:10.1016/j.technovation.2003.11.005.
- K. C. Sandeep, R. Bhattacharyya, C. Warghat, K. Bhanja and S. Mohan, Experimental investigation on the kinetics of catalytic recombination of hydrogen with oxygen in air, Int. J. Hydrogen Energy, 2014, 39(31), 17906–17912, DOI:10.1016/j.ijhydene.2014.08.148.
- S. Shiva Kumar and V. Himabindu, Hydrogen production by PEM water electrolysis – A review, Mater. Sci. Energy Technol., 2019, 2(3), 442–454, DOI:10.1016/j.mset.2019.03.002.
- S. Litster and G. McLean, PEM fuel cell electrodes, J. Power Sources, 2004, 130(1–2), 61–76, DOI:10.1016/j.jpowsour.2003.12.055.
- A. Therdthianwong, P. Manomayidthikarn and S. Therdthianwong, Investigation of membrane electrode assembly (MEA) hot-pressing parameters for proton exchange membrane fuel cell, Energy, 2007, 32(12), 2401–2411, DOI:10.1016/j.energy.2007.07.005.
- E. Slavcheva, I. Radev, S. Bliznakov, G. Topalov, P. Andreev and E. Budevski, Sputtered iridium oxide films as electrocatalysts for water splitting via PEM electrolysis, Electrochim. Acta, 2007, 52(12), 3889–3894, DOI:10.1016/j.electacta.2006.11.005.
- E. K. Berner and R. A. Berner, Global Environment: Water, Air, and Geochemical Cycles, Princeton, NJ: Princeton University Press, 2nd edn, 2012, Available: https://ebookcentral.proquest.com/lib/kxp/detail.action?docID=7131915 Search PubMed.
- CRC handbook of chemistry and physics: A ready-reference book of chemical and physical data, ed. D. R. Lide, Boca Raton: CRC Press, 85th edn, 2004 Search PubMed.
- H. Li, et al., A review of water flooding issues in the proton exchange membrane fuel cell, J. Power Sources, 2008, 178(1), 103–117, DOI:10.1016/j.jpowsour.2007.12.068.
- M. Görlin, et al., Oxygen Evolution Reaction Dynamics, Faradaic Charge Efficiency, and the Active Metal Redox States of Ni-Fe Oxide Water Splitting Electrocatalysts, J. Am. Chem. Soc., 2016, 138, 5603–5614, DOI:10.1021/jacs.6b00332.
Footnote |
| † Electronic supplementary information (ESI) available. See DOI: https://doi.org/10.1039/d4re00104d |
| This journal is © The Royal Society of Chemistry 2024 |

