 Open Access Article
Application of the three-reactor hydrogenation process in the recycling utilization of waste lubricating oil and study on the catalyst deactivation mechanism
You
Fang
a,
Peng
Zhang
 *bc,
Mengya
Guo
bc,
Shuke
Guo
bc,
Fujiang
Wang
bc and
Mingxing
Tang
 *bc
*bc
aCNOOC Huizhou Petrochemical Company Limited, 516086, China
bInstitute of Coal Chemistry, Chinese Academy of Sciences, Taiyuan 030001, China
cState Key Laboratory of Coal Conversion, Institute of Coal Chemistry, Chinese Academy of Sciences, Taiyuan 030001, China
First published on 19th September 2024
Abstract
In the recycling of waste lubricating oil, the rapid deactivation of catalysts during the hydrotreating process limits their industrial application. In this paper, a three-reactor process is proposed for the refining of waste lubricating oil, which is compared with the conventional two-reactor process. Experimental results reveal that the three-reactor technique demonstrates enhanced performance in hydrodesulfurization (HDS), hydrodechlorination (HDCl), hydrodenitrogenation (HDN), hydro-decolorization, and demetallization, effectively doubling the service life of the catalysts. Characterization of the deactivated catalysts identifies carbon deposition, silicon (Si) poisoning, and boron (B) poisoning as the primary factors contributing to catalyst deactivation. The presence of a protective agent (the second catalyst) within the three-reactor process effectively removes Si and B, thereby mitigating the Si and B poisoning of the primary hydrogenation catalyst, and extending the catalyst's lifespan. This approach offers a viable solution to the challenge of frequent catalyst deactivation encountered during the high-value utilization of waste lubricating oils, thereby providing an effective pathway for overcoming this issue in the chemical industry.
1. Introduction
Lubricating oils are among the most valuable, yet minor, constituents of oil, extensively used in various motor vehicles and mechanical equipment.1 Their primary functions include reducing friction, noise, sealing, and cooling.2 Lubricating oils are composed mainly of base oil (71.5–96.2%) and additives (3.8–28.5%), with the specific types of additives varying by region and country.3,4 However, prolonged use leads to the deterioration of lubricating oils due to the formation and accumulation of oxidation products and harmful substances, such as metal debris, dust, carbon, colloids, and asphaltene. These contaminants impair the oil's original functions, such as lubrication, antifriction, cooling, sealing, and antivibration, resulting in waste lubricating oil (WLO).5,6 With the rapid development of industrial society, demand for lubricating oil and the need for effective waste lubricating oil treatment have increased significantly.7,8Various techniques9–11 have been employed for recycling WLO, including the acid clay process, solvent extraction, distillation–clay filtration, chemical and clay treatment and membrane technology. Particularly, the acid clay process12–14 has been popular for some time, however, it caused serious secondary pollution and is being phased out in favor of hydrorefining.15 Hydrorefining, facilitated by catalysts, involves a series of reactions including hydrodesulfurization, hydrodeoxidation, hydrodenitrogenation, hydrodechlorination, and hydrodemetallation. These reactions effectively remove harmful impurities from the feedstock, thereby enhancing the added value of the product. This hydrogenation technique is currently recognized as the most efficient method for the treatment of waste lubricating oil and holds promising prospects for widespread application.16 At present, widely used hydrogenation processes include Kleen, KTI, Snamprogetti, REVIVOIL, DCH, Recyclon, etc.17,18 The KTI process,19 a typical distillation–hydrogenation process, involves distillation, vacuum distillation, and hydrorefining. The Snamprogetti process20 is an evolution of the acid clay process, producing products through repeated propane extraction after vacuum distillation. The REVIVOIL process21 can achieve a 12% asphalt recovery on the basis of hydrorefining, significantly reducing energy consumption. The Kleen process21 involves separating base oil and kerosene by adding catalysts in a vacuum fixed bed reactor, significantly improving the quality of the hydrogenated product. However, high costs due to catalyst deactivation limit their broader adoption. In summary, the presence of various additives in waste lubricating oil can affect the quality of the recycled oil products. Moreover, during use, the lubricating oil can undergo oxidation reactions, producing oxygen-containing compounds such as organic acids, which can corrode equipment and catalysts, thus increasing the difficulty of processing. Therefore, developing appropriate treatment processes tailored to the properties of waste lubricating oil is crucial for the high-value utilization of waste lubricating oil.
Traditionally, two reactors are used for the hydrogenation process of waste lubricating oil. The first reactor is loaded with a low-temperature prehydrogenation catalyst, primarily utilizing NiMo catalysts to remove easily polymerizable gums and conjugated diolefins at low temperatures. The second reactor is charged with a high-temperature main hydrogenation catalyst, primarily using NiMo or CoMo catalysts, to remove heteroatoms such as organic sulfides, chlorides, and nitrides at high temperatures, achieving the purpose of decolorization and refining. However, industrial applications have shown that the two-reactor hydrogenation process suffers from issues such as short catalyst life and poor product quality, which urgently require improvement.
In this study, the three-reactor hydrogenation process was employed for the hydrogenation reaction of waste lubricating oil to enhance the service life of the catalyst. The deactivation mechanism of the catalyst has also been thoroughly investigated, which contributes to the improvement of the hydrogenation process and the development of more targeted catalysts. This paper aims to investigate the efficacy of a three-stage hydrogenation process for the treatment of waste lubricating oil, and to discover the reason of catalyst deactivation, thereby providing a reference for the technological development and progress in the field of high-value utilization of waste lubricating oil.
2. Experimental
2.1 Materials
Waste lubricating oil is provided by Hebei Rongda Company. Dimethyl disulfide, N-hexane, toluene, ethanol, and cyclohexane were purchased from Aladdin Chemical Reagent Co. Ltd. The water used for experiments and characterization was deionized water.2.2 The flowchart of the three-reactor process
The catalysts used in this manuscript are prepared by the Institute of Coal Chemistry, Chinese Academy of Sciences and the specification characters are listed in Table 1. After the reaction, the obtained products were subjected to color comparison and analytical measurements of sulfur, chlorine, nitrogen, and metal content to assess the performance differences between the two hydrogenation processes. The spent catalyst was washed with toluene for 48 h in a Soxhlet extractor to remove the remaining oil on the surface of the catalyst.| Two-reactor process | Three-reactor process | ||||
|---|---|---|---|---|---|
| First reactor | Second reactor | First reactor | Second reactor | Third reactor | |
| Catalyst | NiMo/γ-Al2O3 | NiMo/γ-Al2O3 | NiMo/γ-Al2O3 | NiMo/γ-Al2O3 | NiMo/γ-Al2O3 |
| Reaction temperature, °C | 200 | 300 | 200 | 260 | 300 |
| Reaction pressure, MPa | 3.8 | 3.8 | 3.8 | 3.8 | 3.8 |
| Specific area, m2 g−1 | 152 | 145 | 152 | 300 | 145 |
| Pore volume, m3 g−1 | 0.52 | 0.48 | 0.52 | 0.62 | 0.48 |
| Average pore diameter, nm | 10.2 | 9.1 | 10.2 | 12.4 | 9.1 |
| Ni, % | 3.2 | 2.6 | 3.2 | 2.2 | 2.6 |
| Mo, % | 8.1 | 9.3 | 8.1 | 7.8 | 9.3 |
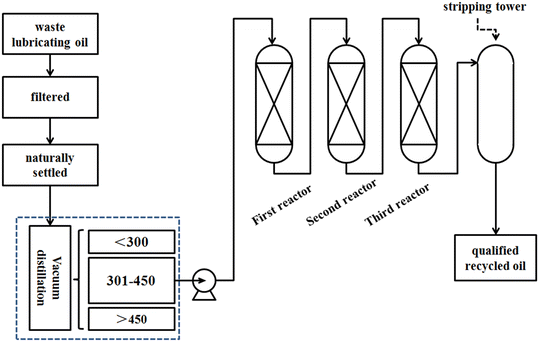
The three-reactor process is used in this manuscript and the flowchart of the hydrogenation process is illustrated in Fig. 1. Waste lubricating oil is first filtered to remove mechanical impurities, and then subjected to sedimentation for oil–water separation. Subsequently, it undergoes distillation. The waste lubricating oil is fractionated into three fractions, that is below 300 °C, 300–450 °C, and above 450 °C fractions. Finally, the 300–450 °C fraction serves as the feedstock for hydrogenation to obtain a qualified product. Three catalysts with different functionalities are loaded into three reactors. The first catalyst removes easily polymerizable organic compounds at low temperatures. The second catalyst is responsible for the removal of organosilicons and organometallic compounds to extend the lifespan of the primary hydrogenation catalyst. Meanwhile the third catalyst serves as a hydrorefining catalyst, primarily aimed at the removal of organic sulfur, organic chlorine, organic nitrogen, and decolorization. For comparison, this paper also investigates a two-reactor hydrogenation process, and the catalysts correspond to the first and third catalysts of the three-reactor process. The character specifications of the catalysts used in this manuscript are listed in Table 1. The difference between these two processes lies in the addition of a protective catalyst in the three-reactor process for desilication and demetallization. This catalyst possesses a higher specific surface area, pore volume, and pore diameter to enhance its accommodation capacity.
2.3 Activation and evaluation of the catalysts
The catalysts were activated by sulfidation under the following conditions: P = 3.8 MPa, H2/feed ratio = 800, LHSV = 1.8 h−1, T = 150 °C (2 h) → 230 °C (4 h) → 290 °C (2 h) → 320 °C (2 h) → 150 °C (4 h). Hydrogenation of waste lubricating oil was carried out in a fixed bed reactor under the following conditions: P = 3.8 MPa, LHSV = 5.0 h−1, H2/feedstock ratio of 800. The experiment was conducted at low pressure and high space velocity to shorten the evaluation period.2.4 Characterization
The specific surface area, pore volume, and average pore size were determined using the Brunauer–Emmett–Teller (BET) method with nitrogen adsorption–desorption measurements conducted on a TriStar 3000 at 77.4 K. The pore size distribution was measured using the Barrett–Joyner–Halenda (BJH) method. The trace element content in catalysts and oil products was measured by inductively coupled plasma atomic emission spectroscopy (ICP-OES) using a Thermo iCAP6300 spectrometer. Sulfur and nitrogen contents in the oil were analyzed using a TSN-5000 Plus sulfur and nitrogen analyzer, while the chlorine content was determined with a JF-WK-2000 microcoulometry comprehensive analyzer. In the determination of sulfur (S), nitrogen (N), and chlorine (Cl), the decomposition temperature of the instrument is set to 1050 °C. X-ray photoelectron spectroscopy (XPS) was performed using a PHI-5000 VersaProbe III (Kratos AXIS ULTRA DLD), with spectra calibrated to the C 1s position at 284.86 eV and analyzed using CasaXPS software. CHNS analysis of the fresh and deactivated catalysts was conducted using a Euro EA3000 analyzer. Scanning electron microscopy (SEM) was used for high magnification imaging and elemental analysis. Pellets of fresh and spent catalysts were cut radially to generate a flat surface, and the distribution of elements was determined by energy dispersive X-ray (EDX) analysis. FTIR spectra were recorded with a Thermo Fisher Nicolet iS50 spectrometer equipped with an MCT/A detector. The spectra were obtained with 64 scans at a resolution of 4 cm−1. The sample mixture with KBr was pressed into a pellet at 8 MPa, and collected in the range of 400–4000 cm−1.3. Results and discussion
3.1 Fractionation of waste lubricating oil
The waste lubricating oil was separated by vacuum distillation; the appearance of waste lubricating oil and its various fractions are shown in Fig. 2. The color of waste lubricating oil is dark brown. After distillation, the light fraction (below 300 °C) and middle fraction (301–450 °C) exhibit a lighter color, while the heavy fraction (above 450 °C) becomes darker in color. Their physical properties are shown in Table 2. The results show that the 301–450 °C fraction in the vacuum-distilled waste lubricating oil constitutes 90% of the total oil, which is significantly higher than the other distillate fractions (2% and 8%). On the other hands, the analysis results show that sulfur (S), nitrogen (N), chlorine (Cl), and silicon (Si) in the waste lubricating oil are rather high in the light distillation fraction (below 300 °C). The acid value of this fraction is 2.5 mg KOH g−1, which is relatively high and can cause significant corrosion to the catalyst and equipment, making it an important factor affecting the catalyst's lifespan. Therefore, this fraction is not suitable for use as a raw material. On the other hand, the heavy distillation fraction (above 450 °C) contains higher percentages of boron (B), phosphorus (P), colloids and asphaltene. These substances can severely affect the service life of the catalyst in the hydrogenation process of waste lubricating oil.16,22–24 This fraction constitutes only 8% of the total, which is a relatively small proportion, and thus, it is not considered as a feedstock. Therefore, the middle distillation fraction (301–450 °C) is used as the feedstock in this manuscript.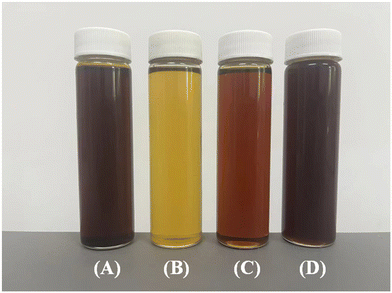 | ||
| Fig. 2 The appearance of waste lubricating oil and its various fractions: (A) WLO, (B) <300 °C, (C) 301–450 °C, and (D) >450 °C. | ||
| WLO | <300 °C | 301–450 °C | >450 °C | |
|---|---|---|---|---|
| Mass percentage % | 2 | 90 | 8 | |
| Flash point °C | 181 | 120 | 180 | 223 |
| Kinematic viscosity@40 °C | 20.4 | 15.3 | 20.3 | 25.3 |
| Kinematic viscosity@100 °C | 3.69 | 1.33 | 3.68 | 3.68 |
| Copper corrosion (100 °C h−1) | 3.5 | 8 | 3 | 3 |
| Color (ASTM) | 8.9 | 7.2 | 8.5 | 10.6 |
| Density | 0.865 | 0.815 | 0.864 | 0.877 |
| Gum | 3 | 2.5 | 3.1 | 4.1 |
| Water content (%) | 1.3 | 6.1 | 0.1 | 0.1 |
| Acidity (mg KOH g−1) | 1.7 | 2.5 | 1.6 | 1.5 |
| Elemental analysis (wt%) | ||||
|---|---|---|---|---|
| C | 85.66 | 85.12 | 85.65 | 86.32 |
| H | 12.73 | 12.85 | 12.74 | 12.32 |
| O | 0.56 | 0.59 | 0.55 | 0.56 |
| Element contents (ppm) | ||||
|---|---|---|---|---|
| S | 1210 | 2105 | 1205 | 1011 |
| N | 620 | 965 | 612 | 586 |
| Cl | 669 | 1520 | 652 | 638 |
| B | 15.9 | 8.9 | 15.2 | 25.3 |
| P | 2.7 | 1.8 | 2.4 | 6.8 |
| Ca | 3.8 | 1.5 | 3.5 | 8.2 |
| Zn | 0.2 | 0.1 | 0.2 | 0.6 |
| Si | 66.5 | 88.9 | 65.2 | 45.6 |
| Fe | 4 | 3.1 | 3.5 | 9.5 |
3.2 Hydrogenation results
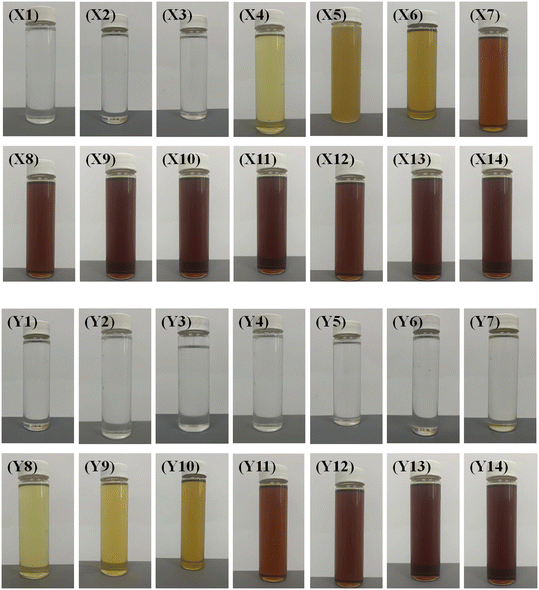
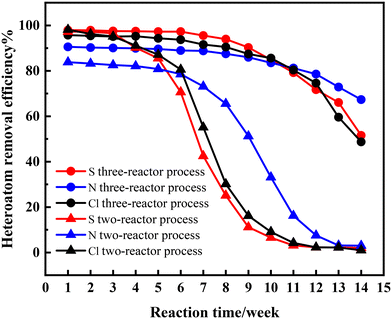
This paper compares the effects of the two-reactor and three-reactor processes. The decolorization effect is a crucial indicator for the high-value utilization of waste lubricating oil. Therefore, the color comparison was conducted. A sample is collected and analyzed weekly to assess and compare the hydrogenation effects. The obtained products for the two-reactor process were named as X1–X14 and Y1–Y14 for the three-reactor process, respectively. Their performance is presented in Fig. 3, 4 and Table 3. It is seen that the color of samples X1–X3 and Y1–Y7 was nearly colorless and transparent, with removal efficiencies for sulfur (S), nitrogen (N), and chlorine (Cl) above 82.53%. This indicates that the catalysts exhibited high activity in hydrogenation and are efficient at the initial stage of the reaction. The three-reactor hydrogenation technique exhibits a pronounced improvement in efficacy over the conventional two-reactor hydrogenation process.| Sample | S con% | N con% | Cl con% | Sample | S con% | N con% | Cl con% |
|---|---|---|---|---|---|---|---|
| X1 | 97.23 | 83.77 | 98.12 | Y1 | 97.93 | 90.55 | 95.71 |
| X2 | 97.21 | 83.21 | 96.23 | Y2 | 97.84 | 90.22 | 95.40 |
| X3 | 96.51 | 82.53 | 95.12 | Y3 | 97.51 | 90.06 | 95.09 |
| X4 | 90.21 | 82.10 | 91.12 | Y4 | 97.43 | 89.92 | 95.25 |
| X5 | 85.53 | 80.81 | 87.11 | Y5 | 97.26 | 89.59 | 94.33 |
| X6 | 70.60 | 78.51 | 80.55 | Y6 | 97.26 | 88.93 | 93.71 |
| X7 | 42.50 | 73.12 | 55.12 | Y7 | 95.52 | 88.79 | 91.56 |
| X8 | 25.11 | 65.51 | 30.12 | Y8 | 93.94 | 87.50 | 90.49 |
| X9 | 11.14 | 51.23 | 16.15 | Y9 | 90.27 | 85.96 | 87.42 |
| X10 | 6.52 | 33.12 | 9.10 | Y10 | 84.88 | 83.52 | 85.58 |
| X11 | 3.12 | 16.23 | 4.22 | Y11 | 79.19 | 81.19 | 80.36 |
| X12 | 2.25 | 7.51 | 2.30 | Y12 | 71.70 | 78.54 | 74.57 |
| X13 | 2.20 | 3.12 | 2.20 | Y13 | 66.05 | 72.86 | 59.59 |
| X14 | 2.00 | 3.00 | 1.00 | Y14 | 51.56 | 67.33 | 48.69 |
Surprisingly, it was observed that the removal efficiency of nitrogen was slightly lower than that of sulfur and chlorine, likely because C–N bonds are more difficult to break under the same reaction conditions.25,26 As the reaction progressed, the product turned light yellow on the fourth week (X4) and subsequently deepened in color, indicating a rapid decline in catalyst activity. Unsurprisingly, the catalytic activities in the two-reactor hydrogenation process deactivated rapidly, with significant activity loss observed from sample X5. This phenomenon has been validated during industrial application processes.
For the three-reactor process, within 7 weeks, the sample remained colorless and transparent. On the 8th week (Y8), a light yellow color appeared in the sample, and subsequently, the color deepened gradually but still lighter than that for the two-reactor process. The duration of decolorization maintenance and the depth of coloration indicate that the lifespan of the three-stage hydrogenation process can be prolonged at least twice that of the two-reactor process. Notably, the removal efficiency of nitrogen decreased slowly, even as the activities of hydrodesulfurization (HDS) and hydrodechlorination (HDCl) declined rapidly in both the two-reactor and three-reactor processes. This indicates that these three reactions occur at different active centers.
The previous section investigates the feasibility of the high-value utilization of waste lubricating oil through the hydrogenation process under low pressure and high space velocity conditions. The results indicate that the three-reactor hydrogenation technology can significantly extend the catalyst's lifespan. However, catalyst deactivation was still observed after 14 weeks of use, necessitating research into the primary causes of catalyst deactivation, which would promote the development of new catalysts and process improvements. Due to the relatively high reaction temperatures in the main hydrogenation stage, industrial applications have shown that catalyst deactivation primarily occurs on the last catalyst. Therefore, this paper focuses on the characterization and analysis of the last catalyst to identify the primary causes of catalyst deactivation. The spent catalysts were washed using toluene for 48 hours in a Soxhlet extractor. The resulting catalysts were labeled A2 (the second catalyst for the two-reactor process) and A3 (the third catalyst for the three-reactor process). Subsequently, A2 and A3 were calcined at 550 °C for 8 hours with a heating rate of 5 °C per minute. The calcined catalysts were labeled AC2 and AC3, respectively.
3.3 Reason of catalyst deactivation
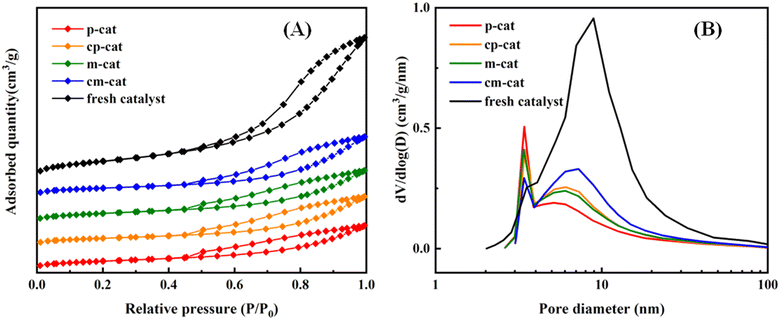 | ||
| Fig. 5 N2 adsorption–desorption isotherms (A) and pore size distribution curves (B) calculated from adsorption branches of the fresh catalyst, A2, A3, AC2 and AC3. | ||
| Samples | BET surface area (m2 g−1) | Pore volume (cm3 g−1) | Average pore size (nm) |
|---|---|---|---|
| Fresh catalyst | 183 | 0.48 | 7.9 |
| A2 | 57 | 0.14 | 4.8 |
| A3 | 67 | 0.17 | 6.2 |
| AC2 | 63 | 0.17 | 6.2 |
| AC3 | 72 | 0.20 | 6.9 |
Pore size distribution curves for the fresh and spent catalysts are presented in Fig. 5(B). The figure illustrates that the catalysts possess a bimodal pore structure. It can be observed that the mesopores of the two used catalysts have significantly decreased, with an increased proportion of micropores. This may be due to the accumulation of carbon deposits and inorganic compound deposits within the pore channels, causing the pore diameters to shrink. Notably, the decrease in porosity and surface area is more pronounced in the A2 catalyst than in the A3 catalyst, indicating more severe blockage. While inorganic compound deposition over the catalyst surface is typically responsible for such issues,27 the spent catalysts (A2 and A3) showed no significant changes in textural properties after being calcined at 550 °C, and their activity did not recover after decarburization. Therefore, the conclusion is that inorganic deposition poisoning is the primary cause of catalyst deactivation, rendering the catalyst non-regenerable due to the inorganic deposition poisoning.
| Sample | C | H | N | S |
|---|---|---|---|---|
| Fresh catalysts | 0.02 | 1.0 | 0.01 | 3.39 |
| A2 | 5.25 | 1.28 | 0.33 | 6.32 |
| A3 | 6.51 | 1.49 | 0.29 | 6.57 |
| AC2 | 0.21 | 1.1 | 0.01 | 0.21 |
| AC3 | 0.34 | 1.1 | 0 | 0.42 |
| Element | Atomic proportion | ||||
|---|---|---|---|---|---|
| A2 | AC2 | A3 | AC3 | Fresh cat | |
| Mo | 4.62 | 4.36 | 3.54 | 3.15 | 7.40 |
| Fe | 0.52 | 0 | 1.03 | 0.3 | 0 |
| Ni | 0.1 | 0.33 | 1.78 | 0.5 | 1.00 |
| Al | 33.1 | 36.96 | 36.52 | 46.9 | 78.51 |
| Si | 34.5 | 31.02 | 22.71 | 21.05 | 1.53 |
| As | 0.9 | 0 | 4.92 | 0 | 0.42 |
| P | 2.24 | 7.99 | 10.82 | 5.57 | 7.57 |
| S | 4.76 | 3.04 | 3.41 | 4.48 | 2.48 |
| B | 19.25 | 15.57 | 15.15 | 14.91 | 0 |
| W | 0 | 0.76 | 0.12 | 0.6 | 1.13 |
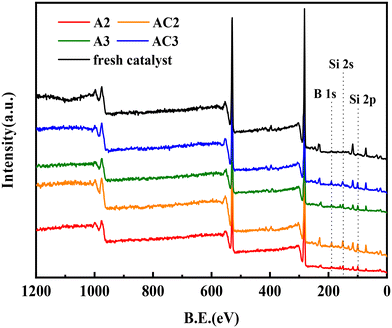
The data in Table 6 reveal that the silicon (Si) content increased from 1.53% in the fresh catalyst to 34.5% in A2 and 22.71% in A3. Similarly, the boron (B) content increased to 19.25% in A2 and 15.15% in A3, while no boron was detected in the fresh catalyst. It should be noted that the contents of Si and B did not change after calcination at 550 °C. These results align well with the BET data, suggesting that the inorganic elements are Si and B. And the deposition of Si and B led to the deactivation of the catalysts. Due to the presence of a protective agent in the second reactor, the amount of Si deposition on the A3 catalyst was significantly reduced, which enhanced the hydrogenation efficiency and prolonged the service life of the three-reactor hydrogenation process.
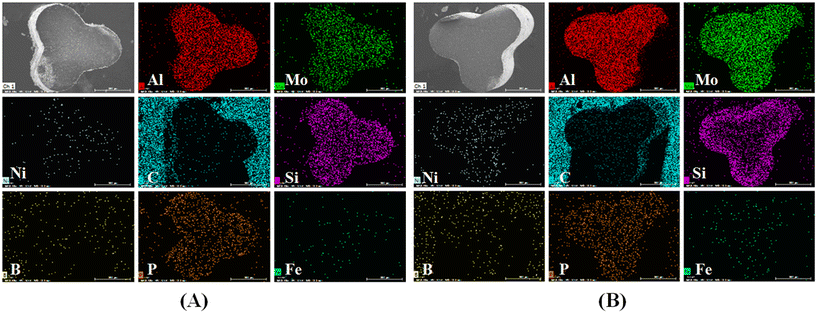 | ||
| Fig. 7 SEM-EDS element mapping of A2 (A) and A3 (B) (distribution of Mo, Ni, C, Fe, Al, P, B and Si on the catalysts). | ||
It is shown in the literature28 that adsorption of silicon-containing compounds occurs in close proximity to sulfide active component particles. Therefore, the large molecules (such as sulfur containing compounds, nitrogenous containing compounds, polycyclic aromatic hydrocarbon, etc.) from waste lubricating oil are limited by steric hindrance, leading to catalyst deactivation. In our case, the same situation signifies that Si and B deposition over the catalyst surface was the important cause of catalyst deactivation. More importantly, this finding helps explain the shorter lifespan of the two-reactor process and provides guidance on how to prolong catalyst life in the future.
| Sample | B% | As% | Si% | P% | Ni% | Co% | Mo% | Al% |
|---|---|---|---|---|---|---|---|---|
| A2 | 3.10 | 0.14 | 1.14 | 3.75 | 2.21 | 2.60 | 7.51 | 41.55 |
| A3 | 2.50 | 0.01 | 0.71 | 2.86 | 2.31 | 2.61 | 9.84 | 41.66 |
| Fresh catalyst | 0.04 | 0.01 | 0.08 | 2.47 | 2.44 | 2.75 | 8.60 | 43.17 |
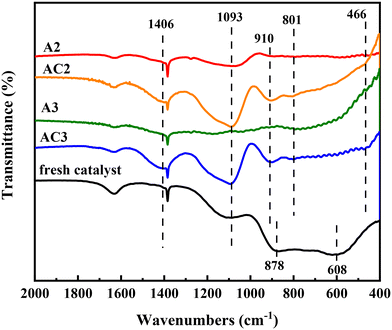
After calcination, the coke covering the alumina surface is gradually removed, but the typical Al2O3 absorption bands do not return to the levels seen in the fresh catalyst. Fortunately, the absorption bands of other impurities appear gradually. The shoulder peak at 1406 cm−1 in AC2 and AC3 is ascribed to the vibration absorption peak of B–O–B, confirming the presence of boron compounds.32 Additionally, three bands centered at 1093, 801, and 466 cm−1 emerge in the AC2 catalyst, corresponding to the asymmetric stretching, symmetric stretching, and bending modes of Si–O–Si, respectively.33,34 These bands were not observed in the spent catalysts (A2 and A3), likely due to coke accumulation.
It is well known that HDN conversion is independent of catalyst composition but dependent on Brønsted acid sites (BASs).35 The hydrogenolysis reactions of nitrogen-containing compounds from waste lubricating oil require planar π-adsorption with the BAS in the catalysts.36 Interestingly, previous reports indicate that BASs form when Si is adsorbed on Al2O3.37 In our case (Fig. 8), a peak at 910 cm−1 characteristic of Si–O–Al vibration was observed, indicating the formation of BASs on the catalyst surface. Additionally, silicon occupies the hydroxyl positions on Al2O3, hindering the adsorption of chlorine and reducing catalyst activity. Consequently, the transformation of nitrogen-containing compounds becomes easier compared to sulfur-containing compounds, which helps explain the faster decline in desulfurization rate accompanied by catalyst deactivation.38
3.4 ICP results of the products
The ICP data are shown in Table 8. For the first product, the removal efficiency of silicon (Si) reached 98.4%. However, it is evident that this conversion rate declines as the reaction progresses. This trend is likely similar for other elements newly accumulated in the spent catalysts, such as boron (B) and calcium (Ca).| WLO | Y1 | Y2 | Y3 | Y4 | Y5 | Y6 | Y7 | Y8 | Y9 | Y10 | Y11 | Y12 | Y13 | Y14 | |
|---|---|---|---|---|---|---|---|---|---|---|---|---|---|---|---|
| Si | 65.2 | 1 | 1.6 | 2.1 | 2.3 | 2.9 | 3 | 4.7 | 5.1 | 7.6 | 11.3 | 22.5 | 29.6 | 36.2 | 44.1 |
| Ca | 3.5 | <0.1 | <0.1 | <0.1 | <0.1 | <0.1 | <0.1 | <0.1 | <0.1 | <0.1 | <0.1 | 0.4 | 0.6 | 0.9 | 1.2 |
| Fe | 3.5 | <0.1 | <0.1 | <0.1 | <0.1 | <0.1 | <0.1 | <0.1 | <0.1 | <0.1 | <0.1 | <0.1 | <0.1 | 0.8 | 2.3 |
| B | 15.2 | 0.2 | 0.2 | 0.2 | 0.3 | 0.2 | 0.2 | 0.3 | 0.3 | 0.4 | 1.9 | 4.3 | 8.7 | 10.5 | 12.6 |
| P | 2.4 | <0.1 | <0.1 | <0.1 | <0.1 | <0.1 | <0.1 | <0.1 | <0.1 | <0.1 | <0.1 | <0.1 | <0.1 | 0.5 | 0.9 |
4. Conclusions
This study investigates the hydrogenation effects of a two-reactor and a three-reactor process for waste lubricating oil. The research indicates that the three-reactor process exhibits superior hydrogenation efficiency; the removal efficiencies of sulfur (S), nitrogen (N), and chlorine (Cl) remained above 80% for 10 weeks, compared to just 4 weeks for the two-reactor hydrogenation process and the decoloration effect increased from 3 to 7 weeks. This suggests that the three-reactor process is more suitable for the high-value utilization of waste lubricating oil. An in-depth investigation into the deactivation mechanisms of the catalysts in both processes reveals that pore blockage is the primary cause of catalyst deactivation. Carbon deposits can be removed through calcination, whereas Si and B cannot be regenerated by calcination, resulting in permanent deactivation due to the coverage of active sites and pore blockage by these inorganic species. The protective agent used in the three-reactor process effectively removes these inorganic deposits, thereby safeguarding the main hydrogenation catalyst. This research provides significant insights into the high-value utilization of waste lubricating oil.Data availability
The data that support the findings of this study are available from the corresponding author (Peng Zhang) upon reasonable request.Author contributions
Fang You: writing – original draft – preparation; data curation. Peng Zhang: writing – review and editing. Mengya Guo: visualization and data curation. Shuke Guo: supervision and resources. Fujiang Wang: investigation and formal analysis. Mingxing Tang: ideas; funding acquisition and project administration.Conflicts of interest
The authors declare no competing financial interest.Acknowledgements
This work was supported by the National Natural Science Foundation (22072173, U19100202, 21603256, 22078351 and 22008167), the National Key Research and Development Program (2023YFB4103300), the 8th Division of Xinjiang Production and Construction Corps, Science and Technology Project of Shihezi City (2022JB02), and the Key Research and Development Program of Shanxi Province (202102090301005).References
- P. Agamuthu, O. P. Abioye and A. A. Aziz, J. Hazard. Mater., 2010, 179, 891–894 CrossRef CAS PubMed.
- S. C. Chin, N. Shafiq and F. Nuruddin, Journal of Civil and Environmental Engineering, 2012, 6, 254–260 Search PubMed.
- S. Rafat, I. Hamawand and T. Yusaf, Energies, 2013, 6, 1023–1049 CrossRef.
- H. Li and S. X. Lin, Energy Policy, 2011, 39, 4624–4630 CrossRef.
- A. N. Jun-Xin, Z. Hui-Juan and W. Hui-Dong, Fine and Specialty Chemicals, 2010, 18, 1 Search PubMed.
- B. Bob and H. Arpad, Environ. Sci. Technol., 2004, 38, 353–358 CrossRef PubMed.
- Y. L. Hsu, C. H. Lee and V. B. Kreng, Expert Syst. Appl., 2010, 37, 419–425 CrossRef.
- W. Juan, A. N. Jinmin and L. Jie, Thermal Power Generation, 2010, 39, 58 Search PubMed.
- S. M. Al-Zahrani and M. D. Putra, J. Ind. Eng. Chem., 2013, 19, 536–539 CrossRef CAS.
- P. Ouyang and X.-M. Zhang, Sci. Adv. Mater., 2019, 11, 196–202(197) CrossRef CAS.
- W. Chang, D. Zhao, J. Lian, S. Han and Y. Xue, Pet. Sci. Technol., 2019, 37, 837–844 CrossRef CAS.
- A. J. Rifliansah, R. H. M. Utomo, J. P. Sutikno and R. Handogo, IOP Conf. Ser.: Mater. Sci. Eng., 2019, 543, 012050 CAS.
- D. Kemala, S. Sarwanto Moersidik, S. Adityosulindro, F. Hilwa, M. Olivia, A. Marto, K. Yamamoto, D. Wishart, E. Saputra and I. D. Ketut Sudarsana, MATEC Web Conf., 2019, 276, 06020 CrossRef CAS.
- T. E. Oladimeji, K. M. Oguntuashe, M. E. Emetere and V. E. Efeovbokhan, Int. J. Adv. Des. Manuf. Technol., 2020, 106, 4157–4167 CrossRef.
- Y. Daisho, Qiche Anquan Yu Jieneng Xuebao, 2010, 1(01), 6–13 Search PubMed.
- M. A. Al-Ghouti and L. Al-Atoum, J. Environ. Manage., 2008, 90, 187–195 CrossRef PubMed.
- R. R. Mohammed, I. A. R. Ibrahim, A. H. Taha and G. McKay, Chem. Eng. J., 2013, 220, 343–351 CrossRef CAS.
- F. Fauser and W. Ritz, Conserv. Recycl., 1979, 3, 135–141 CrossRef CAS.
- M. F. Ali, A. J. Hamdan and F. Rahman, Am. Chem. Soc., Div. Fuel Chem., 1995, 40, 901–907 CAS.
- C. Kajdas, TriboTest, 2000, 7, 137–153 CrossRef CAS.
- A. Kupareva, P. Mäki-Arvela and D. Y. Murzin, J. Chem. Technol. Biotechnol., 2013, 88, 1780–1793 CrossRef CAS.
- G. Burke, B. R. Singh and L. Theodore, Handbook of environmental management and technology, Wiley-Interscience, 2000 Search PubMed.
- X. Ge, L. Shi and X. Wang, Ind. Eng. Chem. Res., 2014, 53, 6351–6357 CrossRef CAS.
- J. Kong, G. Achari and C. H. Langford, J. Environ. Sci. Health, Part A: Toxic/Hazard. Subst. Environ. Eng., 2013, 48, 92–98 CrossRef CAS PubMed.
- Z. Sarbak, React. Kinet. Catal. Lett., 1979, 12, 265–271 CrossRef CAS.
- J. G. Choi, J. R. Brenner, C. W. Colling, B. G. Demczyk, J. L. Dunning and L. T. Thompson, ChemInform, 1992, 23 DOI:10.1002/chin.199244325.
- J. Ancheyta, Deactivation of Hydroprocessing Catalysts, Deactivation of Heavy Oil Hydroprocessing Catalysts, 2016, vol. 6, p. 7 Search PubMed.
- K. A. Nadeina, M. O. Kazakov, A. A. Kovalskaya, V. V. Danilevich, O. V. Klimov, I. G. Danilova, D. F. Khabibulin, E. Y. Gerasimov, I. P. Prosvirin, V. A. Ushakov, K. V. Fedotov, D. O. Kondrashev, A. V. Kleimenov and A. S. Noskov, Catal. Today, 2019, 329, 53–62 CrossRef CAS.
- J. M. Saniger, Mater. Lett., 1995, 22, 109–113 CrossRef CAS.
- G. Busca, V. Lorenzelli, G. Ramis and R. J. Willey, Surface sites on spinel-type and corundum-type metal oxide powders, Langmuir, 2002, 9, 1492–1499 CrossRef.
- P. Pérez-Romo, C. Aguilar-Barrera, G. C. Laredo, C. Ángeles-Chávez and J. Fripiat, Appl. Catal., A, 2021, 611, 117964 CrossRef.
- R. Svoboda and J. Málek, J. Non-Cryst. Solids, 2015, 419, 39–44 CrossRef CAS.
- A. Bertoluzza, C. Fagnano, M. A. Morelli, V. Gottardi and M. Guglielmi, J. Non-Cryst. Solids, 1982, 48, 117–128 CrossRef CAS.
- E. Finocchio, G. Garuti, M. Baldi and G. Busca, Chemosphere, 2008, 72, 1659–1663 CrossRef CAS PubMed.
- S. Eijsbouts, C. Sudhakar, V. H. J. D. Beer and R. Prins, ChemInform, 1991, 127, 605–618 CAS.
- P. Pérez-Romo, J. Navarrete-Bolaños, C. Aguilar-Barrera, C. Angeles-Chavez and G. C. Laredo, Appl. Catal., A, 2014, 485, 84–90 CrossRef.
- D. D. J. P. Martínez, G. A. A. Quiroga, S. A. G. Duarte and A. C. Hurtado, Rev. Fac. Ing., 2011, 57, 23–30 Search PubMed.
- T. C. Ho and L. Qiao, J. Catal., 2010, 269, 291–301 CrossRef CAS.
| This journal is © The Royal Society of Chemistry 2024 |

