 Open Access Article
Towards routine organic structure determination using Raman microscopy†
Jason
Malenfant
,
Lucille
Kuster
,
Yohann
Gagné
,
Kouassi
Signo
,
Maxime
Denis
,
Sylvain
Canesi
 * and
Mathieu
Frenette
 *
*
Department of Chemistry, NanoQAM, Centre Québécois des Matériaux Fonctionnels (CQMF), Université du Québec à Montréal, Montreal, Quebec H3C 3P8, Canada. E-mail: canesi.sylvain@uqam.ca; frenette.mathieu@uqam.ca
First published on 14th November 2023
Abstract
Raman microscopy can reveal a compound-specific vibrational “fingerprint” from micrograms of material with no sample preparation. We expect this increasingly available instrumentation to routinely assist synthetic chemists in structure determination; however, interpreting the information-dense spectra can be challenging for unreported compounds. Appropriate theoretical calculations using the highly efficient r2SCAN-3c method can accurately predict peak positions but are less precise in matching peak heights. To limit incorrect biases while comparing experimental and theoretical spectra, we introduce a user-friendly software that gives a match score to assist with structure determination. The capabilities and limitations of this approach are demonstrated for several proof-of-concept examples including the characterization of intermediates in the total synthesis of deoxyaspidodispermine.
Introduction
Following synthesis, chemists rely on a range of analytical techniques to verify molecular structures (Table 1). As a characterization method, visual inspection is clearly insufficient—most synthetic organic molecules are white to off-white powders. Still, a sample's interaction with visible light can reveal surprisingly precise information about its composition. Visible light and molecules can undergo inelastic collisions, first described by Sir Chandrasekhara Venkata Raman,1 establishing the basis for a spectroscopic technique that now bears his name. Raman spectroscopy is a relatively underused structure elucidation method by synthetic organic chemists, but this characterization method is prevalent in material science.2 As with infrared spectroscopy, Raman spectroscopy reports a vibrational spectrum that is specific to a molecular structure and geometry. The peaks in Raman spectra are narrower and observable at lower wavenumbers than those in infrared spectra, which better exposes the numerous peaks found in the fingerprint region (∼200–1800 cm−1). Furthermore, infrared techniques are negatively affected by omnipresent interferents water and CO2, while their presence is largely unseen in Raman spectra.| Technique | Information | Sub-mg? | Non-destructive? | No sample preparation? |
|---|---|---|---|---|
| a If proper care is taken not to damage the sample with high laser intensity. | ||||
| Infrared | Fingerprint | No  |
Yes  |
Yes  |
| Mass spectrometry | Mass | Yes  |
No  |
Yes  |
| 1H NMR | Structural | Yes  |
Yes  |
No  |
| 13C NMR | Structural | No  |
Yes  |
No  |
| Conventional Raman | Fingerprint | No  |
Yesa |
Yes  |
| Raman microscopy | Fingerprint |
Yes

|
Yes

|
Yes

|
Raman spectroscopy and Raman microscopy are increasingly available analytical tools with several advantages that foreshadow their use in routine organic structure determination. Samples are non-destructively measured directly in their powder form, without sample preparation or the need for expensive deuterated solvents. Air-, moisture- and temperature-sensitive samples can be measured in an inert atmosphere (through a quartz vial) or directly under liquid nitrogen.2d Confocal Raman microscopy can measure vibrational spectra with a spatial resolution of less than 10 μm3 or about 10 pg of solid sample. With such a low sample size needed to record a vibrational spectrum and the often-remarked fingerprint-quality of these spectra, Raman microscopy is primed to assist chemists in routine structure determination. Standard Raman spectrometers, which are more widely available, can also generate excellent data with milligrams of sample.
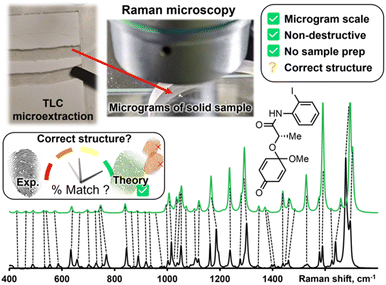
While Raman spectra databases can confirm a match for reported compounds,3 the same exercise is more difficult for unreported spectra. Leaning on theoretical predictions to fill in this gap is a woefully underused strategy in routine structure determination. Fortunately, vibrational modes are amongst the most precisely predicted properties by Density Functional Theory (DFT) calculations. Peak positions in predicted spectra rely mostly on molecular bonding and geometry; both these properties are accurately modeled by relatively inexpensive DFT calculations. While it is challenging to interpret a medium-sized molecule's Raman spectrum without a valid comparison, matching an experimental spectrum to a DFT-predicted spectrum is more straightforward. DFT-correlated Raman microscopy can be integrated in an organic synthetic process as illustrated in Fig. 1. Following purification of synthetic products, via preparatory thin layer chromatography (TLC) for example, as little as 10 μg of material are needed to be analyzed with an appropriate confocal Raman microscope setup. The correlation between experimental and calculated peak positions is often quite good, as indicated qualitatively with dashed lines in Fig. 1.
While DFT calculations can offer satisfactory matches in the number and position of Raman peaks, predicted Raman intensities require the third derivative of electronic densities—a calculation that is far from precise.4 Despite poorly predicted peak heights, matching experimental Raman spectra with DFT calculations has confirmed many molecular structures,5 including elusive reactive intermediates.6 Because it favorably predicts molecular geometries, the ubiquitous B3LYP has been the hegemonic functional in DFT-correlated Raman spectroscopy. Recently, Grimme and co-workers introduced the r2SCAN-3c method,7 which is implemented in the free-for-academics ORCA software.8 The r2SCAN-3c method will routinely reproduce the structural accuracy of triple-ζ B3LYP calculations (e.g., B3LYP/def2-TZVPD) using ≥10× less calculation time (vide infra).7 Less expensive calculations allow researchers to quickly predict Raman spectra, which opens the door for routine structure elucidation by DFT-correlated Raman spectroscopy. Herein, we describe the application of r2SCAN-3c calculations in routine organic structure prediction from molecular solids (i.e., powder samples).
As with most spectral comparisons, deciding if a predicted spectrum corresponds to the correct structure is a subjective and a potentially biased exercise. To help with this decision, we implement a pipeline for spectral processing and quantitative match assessment. This approach yields a user-friendly percent match between predicted and experimental spectra for user-generated structures. We demonstrate DFT-correlated spectral matching in several proof-of-concept examples, including the match of synthetic intermediates from the total synthesis of deoxyaspidodispermine.9
Method
SARA, or “Similarity Assessment of Raman Arrays”, is the name given to the software written by author J. M. to process Raman spectra. It was programmed in numerical Python with a certain level of automation in mind and runs in seconds. The script takes as input a directory path for a folder containing Raman data files to be compared. Theoretical and baseline-corrected experimental spectrum can be differentiated to SARA by either file extension, or an identifier string (“exp” or “theo”) in the filename. Compatible file formats include comma-separated values (CSV), Renishaw WiRE files, as well as Gaussian- and ORCA-calculated spectra. Once baseline-corrected spectra-containing files are submitted, the software starts pre-processing and calculating the match score for every pair of submitted experimental and theoretical spectra according to the algorithm described in Fig. 2.The core correlation metric employs the weighted cross-correlation average (WCCA) as first described by De Gelder et al.10 and originally used for powder X-ray diffraction. This method was shown to outperform the root mean square error metric with Raman spectra for small molecules.11 In order to adapt this algorithm in a way that limits the errors in modeled peak intensities, spectra are passed through a compression filter which maps the intensities according to a pre-defined logarithm-like function (Fig. S4†). This compression stretches the intensity of peaks towards the spectrum's maximum intensity, rendering peak intensities closer to one another without taking a drastic “barcode spectrum” approach. The bottom-left part of this curve reduces the weakest-intensity peaks to have less significance in the score calculation. The middle and top-right part of the curve serve to gently enhance the mid-intensity peaks to make them more similar to the strongest peaks. This has the benefit of bringing the very small peaks to lower intensities, and more intense peaks closer to each other in height. For each pair of spectra, the score calculation starts with pre-processing, defined in six steps: (1) the files are parsed. If necessary, peak broadening using a specifically parametrized Voigt profile12 is applied to files consisting of only theoretical wavenumbers to obtain a realistic spectrum. (2) Both spectra are sorted by ascending wavenumber. (3) A user-defined theoretical frequency correction factor is applied to the theoretical spectrum—a 0.98 correction factor was used in this study. (4) Both spectra are resampled to obtain a directly comparable resolution of 1 cm−1. (5) The spectral intensities are individually normalized using the min–max method. (6) The compression function (eqn S(1)†) is applied to the intensities. With the pre-processing complete, the match score can be calculated, as described by De Gelder and colleagues, with a Karfunkel window using parameters shown in Fig. 2.
One autocorrelation signal is integrated per spectrum, and their cross-correlation is computed, allowing for the SARA score to be assigned to the pair of spectra. When all the scores are calculated, a text-based matrix of scores is generated in CSV format for exporting to a file or spreadsheet software. The match score closest to 100 for a specific DFT-calculated spectrum will indicate the most likely structure for each experimental spectrum according to our algorithm.
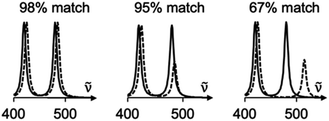
Experimentally, measuring the same sample on different instruments or using different acquisition parameters will result in noticeable spectral differences that are difficult to correct. Fortunately, one can standardize peak positions by calibrating the instrument with a known sample, usually cyclohexane or silicon.33 The y-axis is more challenging to correct. Since Raman spectra are more accurately predicted and measured in position than intensity, SARA was designed to penalize shifts in peak position more severely than mismatches in peak height (Fig. 3).
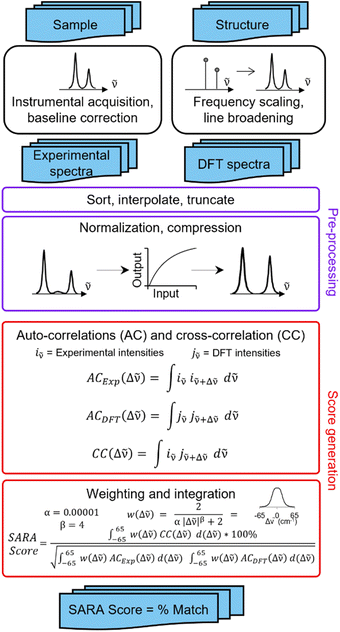 | ||
| Fig. 3 Proposed algorithm to generate match scores between experimental spectra and theoretical calculations. | ||
Computational details
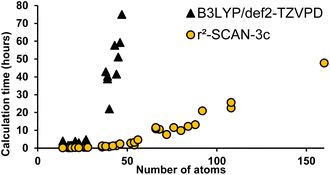
All DFT calculations were carried out using parallel13 ORCA14,15 version 5 (ref. 16) at the r2SCAN-3c level of theory7 with the resolution of identity approximation.17 The recently introduced r2SCAN-3c level of theory uses the re-regularized meta-GGA functional r2SCAN18 with the basis set Def2-mTZVPP. It automatically applies the geometrical counterpoise,19 and D4 corrections,20,21 which compensate for the basis set superposition error and dispersion interactions, respectively. Geometrical conformer search, dimer preparation protocols, example inputs and data processing are included in the ESI.† Fig. S5† shows the ∼15× reduction in calculation time for r2SCAN-3c versus B3LYP/Def2-TZVPD.Results and discussion
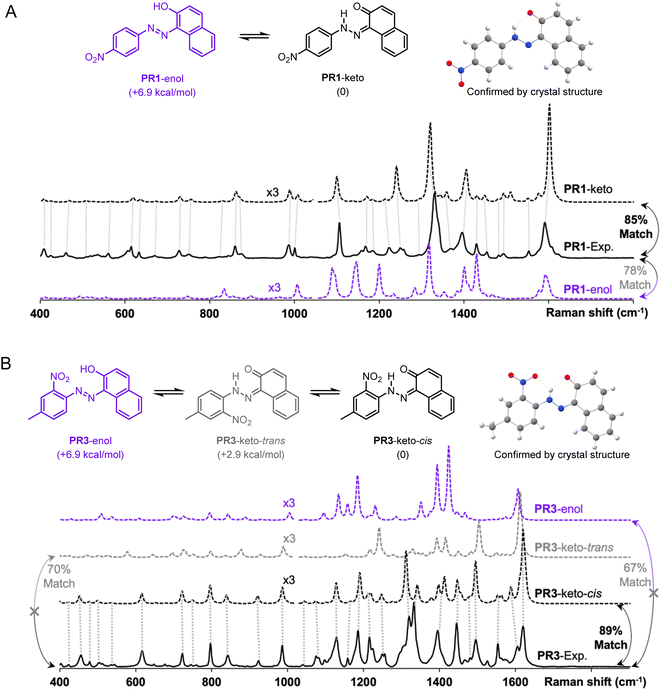
The advantages of Raman spectroscopy and microscopy in routine organic structure predictions are clear: the method is non-destructive and requires sub-milligram quantities of material. Additionally, the information-rich experimental data are molecule-specific and, in several cases, geometry-specific. Raman spectra have been used to distinguish between crystalline polymorphs22,23 and polymer orientation,24 however, the differences between these spectra are relatively minor. In the absence of reported Raman spectra, spectral assignment for medium-sized molecules is a complex task which is often less intuitive to interpret than NMR or mass spectrometry data. The proposed algorithm aims to improve a theory-guided workflow that introduces Raman spectroscopy as a tool in routine organic structure determination.Since Raman spectroscopy contributed prominently to the identification of pigments used in historical artifacts due to the non-destructive and spatially resolved nature of Raman microscopy,25 the SARA matching algorithm was applied to identify the solid-state structure of two pigments, Pigment Red 1 (PR1) and Pigment Red 3 (PR3) (see Fig. 4).
These molecules can exist as several conformers and crystal structures are reported for both molecules.26–28 Both compounds are clearly identified as the keto forms according to bond lengths, i.e., PR1-keto and PR3-keto-cis versus other possible enantiomers/geometries PR1-enol and PR3-keto-trans or PR3-enol. The structures were calculated with the level of theory r2SCAN-3c and free energy calculations confirm the most stable form. Visual inspection of DFT-predicted spectra with the reported experimental spectra does offer a qualitatively similar conclusion. Satisfyingly, treatment of Raman data with SARA gives the highest match score for the correct structure. We observe for the pigment PR1 that the PR1-keto isomer gives the best correlation with a match score of 85%. For molecule PR3, the PR3-keto-cis isomer gives the best correlation at 89%.
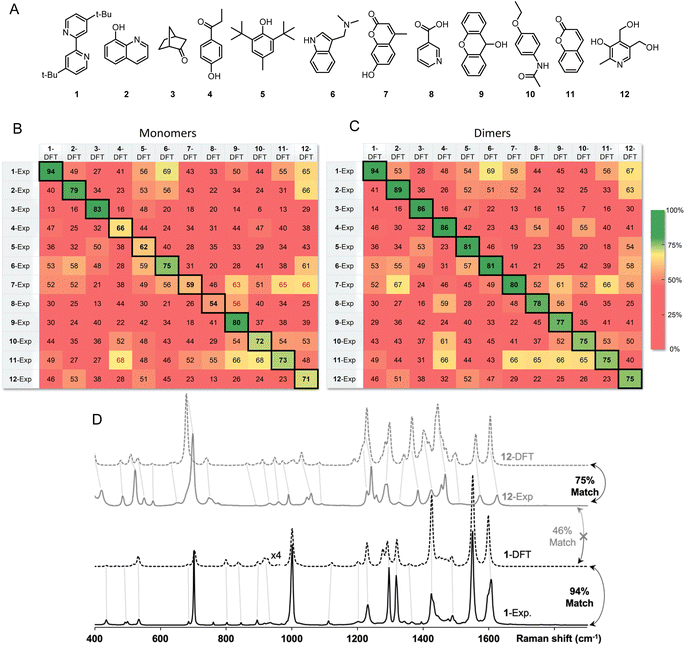
Inspired by the promise of Raman microscopy in the routine structure elucidation of synthetic products, we applied the SARA algorithm to verify its performance against a series of 12 small molecules (Fig. 5A). An ideal outcome would be perfect match scores when comparing experimental and theoretical spectra for the same molecule. Additionally, no higher scores should be found in the comparison of dissimilar structures (i.e., false positives). Each of the 12 powder samples were measured using Raman microscopy (see ESI† for experimental details). Predicting their Raman spectra from monomers in the gas phase gave decent results but presented several problems. Several molecules gave good match scores when comparing experimental and theoretical spectra (ranging from 54–94%), as seen in the diagonal of Fig. 4B, however, there were several notable false positives for dissimilar structures.
Instead of predicting Raman spectra from single molecules in the gas phase, an ideal approach would be to use precise crystalline structures as input. Most molecules do not have reported crystal structures, of course, and crystal structure prediction is at the forefront of computational chemistry research.29 In addition, precise calculations for repeating unit cells of medium-sized molecules are currently prohibitively time-consuming. As a compromise between gas-phase monomers and full crystalline structures, we explored dimers of molecules. Both B3LYP/def2-TZVP and the recent composite method r2SCAN-3c offered accurate spectral matches, however, r2SCAN-3c calculations showed dramatically lower computational cost as the system size increases (Fig. 6).
After standard geometry optimization, several dimer geometries were generated from chemical intuition, with pairs selected to maximize H-bonding or pi-stacking. The lowest electronic energy geometry was then chosen to perform a frequency calculation and to predict a Raman spectrum.
The match scores between experimental and predicted spectra from dimers of the same 12-molecule set are shown in Fig. 5C. The diagonal correlation showed better match scores ranging from 75 to 94%. Using dimers, importantly, no false positives were found, showing promise for the use of this method in routine organic structure determination. Fig. 5D shows the correlation scores between the theoretical spectra (modeled with dimers) and the experimental spectra between molecule 1 and 12 with a 94% and 75% match, respectively. Spectra comparison between the DFT predicted spectra of 1 and experimental spectrum of 12 show expected differences that explain a lower match score of 46%.
The effectiveness of our protocol was evaluated in the identification of two products resulting from a reaction (see Fig. 7). The reduction of (+)-camphor (13) with NaBH4 yields a mixture of two isomers, (+)-borneol (14) and (+)-isoborneol (15) (see ESI† for a synthetic protocol). Following their separation via preparative thin layer chromatography and solvent extraction of the appropriate chromatographic region, the Raman spectra of the vacuum-dried extracted solids were acquired. The data presented in Fig. 6 were obtained with ∼15 μg of each sample, i.e., the smallest spec of sample visible by the naked eye.
 | ||
| Fig. 7 Application of the proposed workflow introduced in Fig. 1. Milligram-scale reduction of 13 yields a mixture of 14 and 15 which were separated via preparatory thin layer chromatography and solvent extraction. Analysis of ∼15 μg of each sample by Raman microscopy gave good matches with DFT-predicted spectra using dimers. Calculated match scores using the SARA algorithm confirmed the assignments. | ||
While they are quite similar, some differences are visually noticeable between the experimental spectra of the two isomers. Interpreting these spectra, unaided by DFT-calculations, would be challenging. The DFT-calculated spectra for dimers of 13 and 14 are, unsurprisingly, similar as well. Subjectively, the position of peak predictions satisfyingly overlay with experimental peak positions as indicated by the dotted lines that link pairs of spectra. Quantitatively, the SARA algorithm can also help pair experimental spectra to isomers 13 and 14. The correlation scores obtained with the SARA algorithm are higher for the experimental and theoretical spectra of the same molecule (87% for 14 and 90% for 15) than for different molecules (83% and 79%). This proof-of-concept workflow shows how Raman microscopy, highly efficient r2SCAN-3c DFT calculations and the SARA software can differentiate and identify two isomeric products using very little isolated product.
The proposed methodology is expected to be particularly beneficial in multi-step syntheses, where milligram-scale synthetic attempts can yield microgram quantities of isolatable products. In such systems, mass spectrometry can give a good idea of possible products, and Raman microscopy would further confirm or deny proposed structures. With this goal in mind, we followed a recently reported total synthesis of deoxyaspidodispermine using Raman microscopy as a structure elucidation tool.9 A total of 6 structures, molecules 16 to 21 (Fig. 8A), were isolated and analyzed by Raman microscopy (see ESI† for experimental and theoretical spectra). Comparing experimental and DFT-predicted spectra for similar molecules gave satisfyingly high match scores, varying between 78% and 95% using monomers or dimers (Fig. 8B and C, respectively). The match score matrix was able to reliably identify the correct molecule, except for the final transformation from 20 to 21 where relatively small structural changes are noted. A near false-positive is observed in the final result (Fig. 8C), however, the correct assignment becomes obvious with the 95% match score for molecule 20.
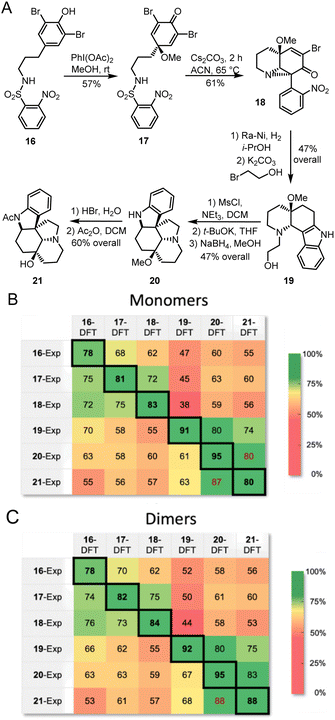 | ||
| Fig. 8 (A) Structure of intermediates analyzed by Raman microscopy during the racemic synthesis of deoxyaspidodispermine.9 Match scores between experimental Raman spectra for compounds 16 to 21 and calculated Raman spectra using the r2SCAN-3c level of theory for monomers (B) and dimers (C). | ||
This manuscript highlights the potential of Raman spectroscopy and microscopy coupled with spectral prediction in routine organic structure determination. Several exciting avenues have been proposed in the literature that will continue to improve this technique's potential, including machine learning to increase match prediction accuracy,30 crystal structure prediction to better describe intermolecular interactions,31 and Raman optical activity which can distinguish between enantiomers.32 The identification of impurities, expansion into organometallic compound identification and the development of other matching algorithms that take advantage of peak deconvolution are possible future directions.
Special considerations
As with any analytical technique, special considerations must be kept in mind to acquire adequate Raman data.33 The following pitfalls should be avoided. As mentioned throughout the text, samples were measured on quartz since laboratory glass has a non-negligible Raman signal. Another common enemy of Raman spectroscopy is fluorescence—a very weak fluorescent signal can easily dominate Raman signals. If the fluorescence signal is not completely overpowering, proper baseline correction can extract Raman spectra.34 While Raman signals are more intense with short wavelength excitation, longer wavelength excitations are often used to avoid fluorescence. Another common pitfall arises from coloured impurities in samples. The Raman signal of impurities that absorb the laser excitation can be greatly enhanced due to the resonance Raman effect. In these cases, the Raman spectrum could be disproportionately contaminated by that of the coloured impurity. Impurities that do not absorb the laser excitation wavelength and that are present below ∼5% should not dramatically affect the protocol and match results. Undoubtably, the match score will decrease with increasing impurity content and proper structural assessment will become more challenging.A common strategy to enhance a molecule's Raman signal is to employ plasmonic absorption from a nearby metallic surface. The resulting Surface-Enhanced Raman Spectrum (SERS) offers greatly enhanced sensitivity with reports of single-molecule detection in many cases.35 It is important to note, however, that the molecule's orientation with respect to the metal surface will amplify certain modes versus others.36 Predicting SERS spectra with DFT calculations is a challenge at this point but will certainly lead to structure determination breakthroughs in the future.
Conclusion
As it becomes more widely available, Raman microscopy will play a growing role in routine structure determination. From sub-milligram quantities of material, without sample preparation, information-rich Raman spectra can be generated. While a well-resolved spectrum is specific to a molecule's bonding and geometry, unambiguous interpretation of a molecule's Raman spectrum can be challenging. Fortunately, DFT calculations are well-suited to predict the number and position of Raman peaks, particularly in the fingerprint region. The r2SCAN-3c method, as implemented in the ORCA software, was found to give adequately predicted Raman spectra with remarkable speed compared to similarly accurate methods.While peak positions are well-predicted by DFT calculations, peak heights remain poorly described. To limit bias when comparing experimental and DFT-calculated Raman spectra, an algorithm that limits the impact of peak height was developed to give a score, out of 100, for a proposed structure. This simple output confirmed the correct structure between several proposed structures, including isomers and conformers.
Some molecules require a better description of their intermolecular forces to properly predict the Raman spectra of their powder forms. In these cases, an appropriate dimer afforded a significant improvement over single molecules in predictive power. This approach was validated with several proof-of-concept examples, including the characterization of synthetic intermediates in the total synthesis of deoxyaspidodispermine. Computationally aided spectral matching will continue to improve, and, as it does, we expect Raman microscopy to find growing applicability in routine organic structure determination.
Data availability
The open-source code for the SARA program can be found at author Jason Malenfant's GitHub repository (https://github.com/jasonMal42/SARA).Author contributions
The initial idea was conceived by M. F., J. M. and L. K. J. M. developed the algorithm, wrote the Python code, measured the Raman spectra and generated the theoretical spectra. Y. G. extracted/calculated spectra found in Fig. 4 and assisted with conformer searches. K. S., M. D., and S. C. provided synthetic samples and helped design/guide the studies. M. F., L. K., and J. M. wrote the initial draft which was edited with the other authors.Conflicts of interest
There are no conflicts to declare.Acknowledgements
We gratefully acknowledge NSERC for funding in the form of a Discovery Grant to M. F. and S. C. as well as an equipment grant to M. F. that allowed the purchase of a Raman microscope, which is maintained by Gwénaël Chamoulaud at the NanoQAM and CQMF research platforms. Calculations were conducted using the ORCA software using computational resources provided by Calcul Québec (https://calculquebec.ca) and the Digital Research Alliance of Canada (https://alliancecan.ca).Notes and references
- C. V. Raman, A new radiation, Indian J. Phys., 1927, 2, 387 Search PubMed , http://hdl.handle.net/10821/377.
- (a) J. B. Wu, M. L. Lin, X. Cong, H. N. Liu and P. H. Tan, Raman spectroscopy of graphene-based materials and its applications in related devices, Chem. Soc. Rev., 2018, 47(5), 1822–1873 RSC; (b) N. Kuhar, S. Sil, T. Verma and S. Umapathy, Challenges in application of Raman spectroscopy to biology and materials, RSC Adv., 2018, 8(46), 25888–25908 RSC; (c) A. Orlando, F. Franceschini, C. Muscas, S. Pidkova, M. Bartoli, M. Rovere and A. Tagliaferro, A comprehensive review on Raman spectroscopy applications, Chemosensors, 2021, 9(9), 262 CrossRef CAS; (d) R. N. Compton and N. I. Hammer, Raman Under Liquid Nitrogen (RUN), J. Phys.: Conf. Ser., 2014, 548(1), 012017, DOI:10.1088/1742-6596/548/1/012017.
- J. L. Robertson, R. S. Senger, J. Talty, P. Du, A. Sayed-Issa, M. L. Avellar, L. T. Ngo, M. Gomez De La Espriella, T. N. Fazili, J. Y. Jackson-Akers and et al, ., Alterations in the molecular composition of COVID-19 patient urine, detected using Raman spectroscopic/computational analysis, PLoS One, 2022, 17(7), e0270914, DOI:10.1371/journal.pone.0270914.
- E. E. Zvereva, A. R. Shagidullin and S. A. Katsyuba, Ab initio and DFT predictions of infrared intensities and Raman activities, J. Phys. Chem. A, 2011, 115(1), 63–69, DOI:10.1021/jp108057p.
- (a) A. Juneau and M. Frenette, Raman Spectra of Persistent Radical Anions from Benzophenone, Fluorenone, 2, 2′-Bipyridyl, 4, 4′-Di-tert-butyl-2, 2′-dipyridyl, and Anthracene: Excellent Agreement between DFT and Experiment for Highly Delocalized Radical Systems, J. Phys. Chem. B, 2022, 125(6), 1595–1603, DOI:10.1021/acs.jpcb.0c04742; (b) J. Kiefer, J. Fries and A. Leipertz, Experimental Vibrational Study of Imidazolium-Based Ionic Liquids: Raman and Infrared Spectra of 1-Ethyl-3-methylimidazolium bis(trifluoromethylsulfonyl)imide and 1-Ethyl-3-methylimidazolium ethylsulfate, Appl. Spectrosc., 2007, 61(12), 1306–1311, DOI:10.1366/000370207783292000; (c) A. Käppler, D. Fischer, S. Oberbeckmann, G. Schernewski, M. Labrenz, K.-J. Eichhorn and B. Voit, Analysis of Environmental Microplastics by Vibrational Microspectroscopy: FTIR, Raman or Both?, Anal. Bioanal. Chem., 2016, 408(29), 8377–8391, DOI:10.1007/s00216-016-9956-3.
- (a) A. Juneau, I. Lepage, S. G. Sabbah, A. H. Winter and M. Frenette, Mechanistic Insight into Phenol Dearomatization by Hypervalent Iodine: Direct Detection of a Phenoxenium Cation, J. Org. Chem., 2022, 87(21), 14274–14283, DOI:10.1021/acs.joc.2c01765; (b) G. Ćirić-Marjanović, M. Trchová and J. Stejskal, The chemical oxidative polymerization of aniline in water: Raman spectroscopy, J. Raman Spectrosc., 2008, 39(10), 1375–1387, DOI:10.1002/jrs.2007.
- S. Grimme, A. Hansen, S. Ehlert and J.-M. Mewes, r2SCAN-3c: a “Swiss army knife” composite electronic-structure method, J. Chem. Phys., 2021, 154(6), 064103, DOI:10.1063/5.0040021.
- F. Neese, The ORCA program system, Wiley Interdiscip. Rev.: Comput. Mol. Sci., 2012, 2(1), 73–78, DOI:10.1002/wcms.81.
- K. Signo and S. Canesi, Synthesis of Deoxyaspidodispermine based on a Functional Protecting Group Strategy, Org. Lett., 2022, 24(27), 4939–4942, DOI:10.1021/acs.orglett.2c01878.
- R. de Gelder, R. Wehrens and J. A. Hageman, A generalized expression for the similarity of spectra: application to powder diffraction pattern classification, J. Comput. Chem., 2001, 22(3), 273–289, DOI:10.1002/1096-987x(200102)22:3<273::Aid-jcc1001>3.0.Co;2-0.
- S. Z. Fairchild, C. F. Bradshaw, W. Su and S. K. Guharay, Predicting Raman spectra using density functional theory, Appl. Spectrosc., 2009, 63(7), 733–741, DOI:10.1366/000370209788700991.
- T. Sundius, Computer fitting of Voigt profiles to Raman lines, J. Raman Spectrosc., 1973, 1(5), 471–488, DOI:10.1002/jrs.1250010506.
- F. Neese, F. Wennmohs, U. Becker and C. Riplinger, The ORCA quantum chemistry program package, J. Chem. Phys., 2020, 152(22), 224108, DOI:10.1063/5.0004608.
- F. Neese, The SHARK integral generation and digestion system, J. Comput. Chem., 2022, 44(3), 381, DOI:10.1002/jcc.26942.
- S. Lehtola, C. Steigemann, M. J. T. Oliveira and M. A. L. Marques, Recent developments in libxc — a comprehensive library of functionals for density functional theory, SoftwareX, 2018, 7, 1–5, DOI:10.1016/j.softx.2017.11.002.
- F. Neese, Software update: the ORCA program system—version 5.0, Wiley Interdiscip. Rev.: Comput. Mol. Sci., 2022, 12(5), e1606, DOI:10.1002/wcms.1606.
- F. Neese, An improvement of the resolution of the identity approximation for the formation of the Coulomb matrix, J. Comput. Chem., 2003, 24(14), 1740–1747, DOI:10.1002/jcc.10318.
- J. W. Furness, A. D. Kaplan, J. Ning, J. P. Perdew and J. Sun, Accurate and Numerically Efficient r2SCAN Meta-Generalized Gradient Approximation, J. Phys. Chem. Lett., 2020, 11(19), 8208–8215, DOI:10.1021/acs.jpclett.0c02405.
- H. Kruse and S. Grimme, A geometrical correction for the inter- and intra-molecular basis set superposition error in Hartree-Fock and density functional theory calculations for large systems, J. Chem. Phys., 2012, 136(15), 154101, DOI:10.1063/1.3700154.
- E. Caldeweyher, S. Ehlert, A. Hansen, H. Neugebauer, S. Spicher, C. Bannwarth and S. Grimme, A generally applicable atomic-charge dependent London dispersion correction, J. Chem. Phys., 2019, 150(15), 154122, DOI:10.1063/1.5090222.
- E. Caldeweyher, J.-M. Mewes, S. Ehlert and S. Grimme, Extension and evaluation of the D4 London-dispersion model for periodic systems, Phys. Chem. Chem. Phys., 2020, 22(16), 8499–8512, 10.1039/D0CP00502A.
- A. Paudel, D. Raijada and J. Rantanen, Raman spectroscopy in pharmaceutical product design, Adv. Drug Delivery Rev., 2015, 89, 3–20, DOI:10.1016/j.addr.2015.04.003.
- S. Roy, B. Chamberlin and A. J. Matzger, Polymorph Discrimination using Low Wavenumber Raman Spectroscopy, Org. Process Res. Dev., 2013, 17(7), 976–980, DOI:10.1021/op400102e.
- M. Richard-Lacroix and C. Pellerin, Orientation and Structure of Single Electrospun Nanofibers of Poly(ethylene terephthalate) by Confocal Raman Spectroscopy, Macromolecules, 2012, 45(4), 1946–1953, DOI:10.1021/ma202749d.
- H. G. M. Edwards, C. J. Brooke and J. K. F. Tait, Fourier Transform Raman Spectroscopic Study of Pigments from English Mediaeval Wall Paintings, J. Raman Spectrosc., 1997, 28(2–3), 95–98, DOI:10.1002/(sici)1097-4555(199702)28:2/3<95::Aid-jrs74>3.0.Co;2-0.
- C. R. Groom, I. J. Bruno, M. P. Lightfoot and S. C. Ward, The Cambridge Structural Database, Acta Crystallogr., Sect. B: Struct. Sci., Cryst. Eng. Mater., 2016, 72(2), 171–179, DOI:10.1107/S2052520616003954.
- A. Whitaker, Z. Kristallogr., Kristallgeom., Kristallphys., Kristallchem., 1980, 152, 227 CrossRef CAS.
- A. Whitaker, Z. Kristallogr., Kristallgeom., Kristallphys., Kristallchem., 1978, 147, 99 CrossRef CAS.
- J. A. Weatherby, A. F. Rumson, A. J. A. Price, A. O. de la Roza and E. R. Johnson, A density-functional benchmark of vibrational free-energy corrections for molecular crystal polymorphism, J. Chem. Phys., 2022, 156(11), 114108, DOI:10.1063/5.0083082.
- (a) F. Lussier, V. Thibault, B. Charron, G. Q. Wallace and J.-F. Masson, TrAC, Trends Anal. Chem., 2020, 124, 115796 CrossRef CAS; (b) R. Han, R. Ketkaew and S. Luber, J. Phys. Chem. A, 2022, 126, 801–812 CrossRef CAS PubMed.
- J. Nyman and S. M. Reutzel-Edens, Faraday Discuss., 2018, 211, 459–476 RSC.
- P. L. Polavarapu and E. Santoro, Nat. Prod. Rep., 2020, 37, 1661–1699 RSC.
- P. Vandenabeele, Raman Spectroscopy in Daily Lab-life, in Practical Raman Spectroscopy – An Introduction, John Wiley & Sons, Ltd, 2013, pp. 101–148 Search PubMed.
- J. Liu, J. Sun, X. Huang, G. Li and B. Liu, Goldindec: A Novel Algorithm for Raman Spectrum Baseline Correction, Appl. Spectrosc., 2015, 69(7), 834–842 CrossRef CAS PubMed.
- J. Langer, D. Jimenez de Aberasturi, J. Aizpurua, R. A. Alvarez-Puebla, B. Auguié, J. J. Baumberg, G. C. Bazan, S. E. J. Bell, A. Boisen, A. G. Brolo, J. Choo, D. Cialla-May, V. Deckert, L. Fabris, K. Faulds, F. J. García de Abajo, R. Goodacre, D. Graham, A. J. Haes, C. L. Haynes, C. Huck, T. Itoh, M. Käll, J. Kneipp, N. A. Kotov, H. Kuang, E. C. Le Ru, H. K. Lee, J.-F. Li, X. Y. Ling, S. A. Maier, T. Mayerhöfer, M. Moskovits, K. Murakoshi, J.-M. Nam, S. Nie, Y. Ozaki, I. Pastoriza-Santos, J. Perez-Juste, J. Popp, A. Pucci, S. Reich, B. Ren, G. C. Schatz, T. Shegai, S. Schlücker, L.-L. Tay, K. G. Thomas, Z.-Q. Tian, R. P. Van Duyne, T. Vo-Dinh, Y. Wang, K. A. Willets, C. Xu, H. Xu, Y. Xu, Y. S. Yamamoto, B. Zhao and L. M. Liz-Marzán, ACS Nano, 2020, 14, 28–117 CrossRef CAS PubMed.
- N. Asadi-Aghbolaghi, R. Rüger, Z. Jamshidi and L. Visscher, J. Phys. Chem. C, 2020, 124(14), 7946–7955 CrossRef CAS.
Footnote |
| † Electronic supplementary information (ESI) available: ORCA input file examples and computational protocol; match scores for monomer, dimer and tetramer modeling for molecules 1 through 12; information on optimized structures from which Raman spectra were calculated, including optimized atomic coordinates and energies; experimental and theoretical Raman spectra of all samples; commercial sources for all chemicals; synthesis results for the reduction of molecule 13; equation for SARA's pre-processing compression function. See DOI: https://doi.org/10.1039/d3sc02954a |
| This journal is © The Royal Society of Chemistry 2024 |

