 Open Access Article
Amorphous conversion in pyrolytic symmetric trinuclear nickel clusters trigger trifunctional electrocatalysts†
Li
Li
a,
Hui-Feng
Zhao
a,
Mei-Xing
Gan
b,
Tao
Zhang
a,
Jia-Ning
Li
b,
Shi
Tao
*c,
Jing
Peng
d,
Hai-Bin
Yu
 *a and
Xu
Peng
 *b
*b
aWuhan National High Magnetic Field Center, School of Physic, Huazhong University of Science and Technology, Wuhan 430074, China. E-mail: haibinyu@hust.edu.cn
bCollege of Chemistry and Chemical Engineering, Hubei University, Wuhan 430062, China. E-mail: pengxu@hubu.edu.cn
cSchool of Electronic and Information Engineering, Jiangsu Laboratory of Advanced Functional Materials, Changshu Institute of Technology, Changshu 215500, China. E-mail: taoshi@cslg.edu.cn
dShenzhen Key Laboratory of Energy Materials for Carbon Neutrality, Shenzhen Institutes of Advanced Technology, Chinese Academy of Sciences, Shenzhen 518055, China
First published on 16th April 2024
Abstract
The pursuit of multifunctional electrocatalysts holds significant importance due to their comprehension of material chemistry. Amorphous materials are particularly appealing, yet they pose challenges in terms of rational design due to their structural disorder and thermal instability. Herein, we propose a strategy that entails the tandem (low-temperature/250–350 °C) pyrolysis of molecular clusters, enabling preservation of the local short-range structures of the precursor Schiff base nickel (Ni3[2(C21H24N3Ni1.5O6)]). The temperature-dependent residuals demonstrate exceptional activity and stability for at least three distinct electrocatalytic processes, including the oxygen evolution reaction (η10 = 197 mV), urea oxidation reaction (η10 = 1.339 V), and methanol oxidation reaction (1358 mA cm−2 at 0.56 V). Three distinct nickel atom motifs are discovered for three efficient electrocatalytic reactions (Ni1 and Ni1′ are preferred for UOR/MOR, while Ni2 is preferred for OER). Our discoveries pave the way for the potential development of multifunctional electrocatalysts through disordered engineering in molecular clusters under tandem pyrolysis.
Introduction
Developing clean and renewable energy sources to address the energy crisis has attracted worldwide interest. In the era of next-generation energy, water splitting for hydrogen production and fuel cell applications has garnered a lot of attention.1 Overall water splitting requires the oxygen evolution reaction (OER),2 while fuel cells necessitate the urea oxidation reaction (UOR)3 and methanol oxidation reaction (MOR).4 Multifunctional electrocatalysts are materials that can efficiently catalyze multiple electrochemical reactions, such as OER, UOR and MOR.5 These electrocatalysts are important for various technologies, such as fuel cells,6 electrolyzers,7 and metal–air batteries,8 as they can improve the overall performance and efficiency of these devices. Importantly, multifunctional electrocatalysts can enable the development of integrated systems that perform multiple electrochemical reactions in a single device, leading to more compact and efficient energy conversion systems.9The design and synthesis of efficient and stable multifunctional electrocatalysts present significant challenges. This is because those different electrochemical reactions take place via different mechanisms. The OER comprises four-electron transfer steps, resulting in the evolution of O2. In contrast, the UOR proceeds through six-electron transfer steps, converting urea into CO2 and N2. The mechanism of the MOR is more complex, involving six-electron transfers. Therefore, designing a multifunctional catalyst for OER, UOR, and MOR that simultaneously meets criteria for uniformity, efficiency, and stability is a challenge.10–12
Amorphous materials are characterized by long-range disorder and only short-range order.13,14 Their local atomic environment and electronic states can be modulated to enhance the intrinsic reactivity of each site, meeting the requirements of multifunctional catalysts. The abundant defects and inherent structural disorder greatly facilitate charge transfer and ion diffusion.15 Therefore, they possess more abundant active sites, wider compositional ranges, and higher structural flexibility.16 However, the design of amorphous materials poses challenges because of their disordered and unstable structures. Currently, there is no universal approach that can effectively control highly efficient structures. The intrinsic correlation between structure and activity remains unclear.17,18
To study the detailed or characteristic structure of amorphous materials, scientists often study their transition from crystalline to amorphous. By studying the degree and the path of amorphous change, along with modulating defects or disorders in crystals, structural insights into amorphous materials can be obtained. Based on the above theory, our experience of the effect of pyrolysis on coordination molecular clusters can play a good demonstration role.19,20 We have studied the process of coordination of molecular clusters from crystalline to amorphous and later to crystalline during pyrolysis and determined the in situ reconstruction process and information about the amorphous structure.21 However, previous studies often focused on the stage of high-temperature pyrolysis transformation (above 400 °C), where the structure is easy to characterize and clear in crystalline materials. The transformation mechanism of tandem pyrolysis (low temperature <400 °C) in amorphous materials has not been well studied, and the difficulty of research is greater due to the lower degree of amorphous material.
Therefore, it is crucial to design a tandem pyrolysis system with clear crystalline and amorphous transition processes to clarify the electrochemical performance changes and active site selectivity design of electrocatalysts during crystalline and amorphous transition processes. Herein, we propose a tandem pyrolysis approach that retains partial local coordination environments of the crystalline phase, providing the possibility of highly dispersed active sites. Controlling amorphous structures through tandem pyrolysis triggers a chemical environment of metals in the crystalline phase that can be retained, unlike high-temperature pyrolysis of organic frameworks, which causes structural collapse due to traditional carbon graphitization. Surprisingly, obtained disordered materials from symmetric trinuclear nickel clusters exhibit three excellent electrocatalytic functionalities (OER/UOR/MOR) with distinct selectivity, Ni1, Ni1′ and Ni2, where this paves the way for potentially developing multifunctional electrocatalysts through disordered engineering and provides insights into establishing structure–property relationships in amorphous materials.
Results and discussions
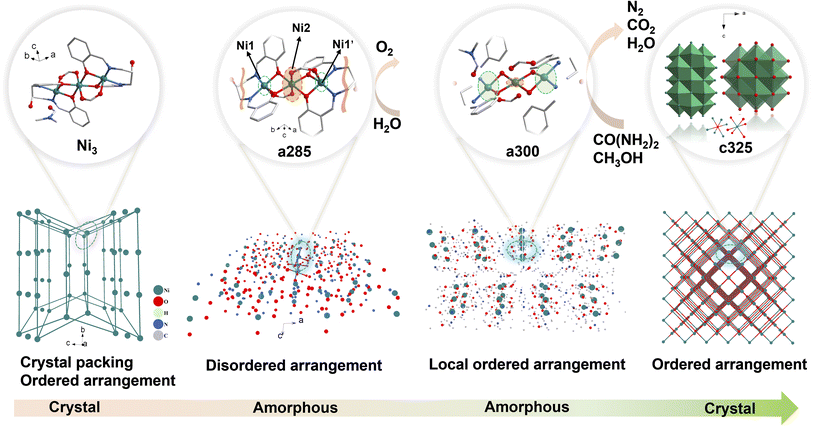
The schematic illustration of tandem pyrolysis in Ni3 crystal was shown in Scheme 1. The single-crystal X-ray diffraction data found Ni3 belongs to the triclinic crystal system P![[1 with combining macron]](https://www.rsc.org/images/entities/char_0031_0304.gif) space group. The nickel (Ni) atoms are coordinated by two O bridges in an opposing direction, with Ni1 and Ni1′ being connected to Ni2 via μ2-O1 and μ2-O1′ bridge connections, two O bridges in opposite directions, Ni atoms are chelated by N on the ligand imine and O on the phenolic hydroxyl group. The oxygen on the free hydroxyl group on the ligand and O on the DMF molecule are not involved in the coordination (Fig. S2†). The bond lengths of Ni1–N1 and Ni1–N2 in the compound are 2.012 (4) Å and 2.026 (4) Å, respectively. The bond lengths of Ni1–O1, Ni1–O2, and Ni1–O5 in the compound are 1.997 (3) Å, 2.029 (3) Å, and 2.215 (3) Å, respectively.
space group. The nickel (Ni) atoms are coordinated by two O bridges in an opposing direction, with Ni1 and Ni1′ being connected to Ni2 via μ2-O1 and μ2-O1′ bridge connections, two O bridges in opposite directions, Ni atoms are chelated by N on the ligand imine and O on the phenolic hydroxyl group. The oxygen on the free hydroxyl group on the ligand and O on the DMF molecule are not involved in the coordination (Fig. S2†). The bond lengths of Ni1–N1 and Ni1–N2 in the compound are 2.012 (4) Å and 2.026 (4) Å, respectively. The bond lengths of Ni1–O1, Ni1–O2, and Ni1–O5 in the compound are 1.997 (3) Å, 2.029 (3) Å, and 2.215 (3) Å, respectively.
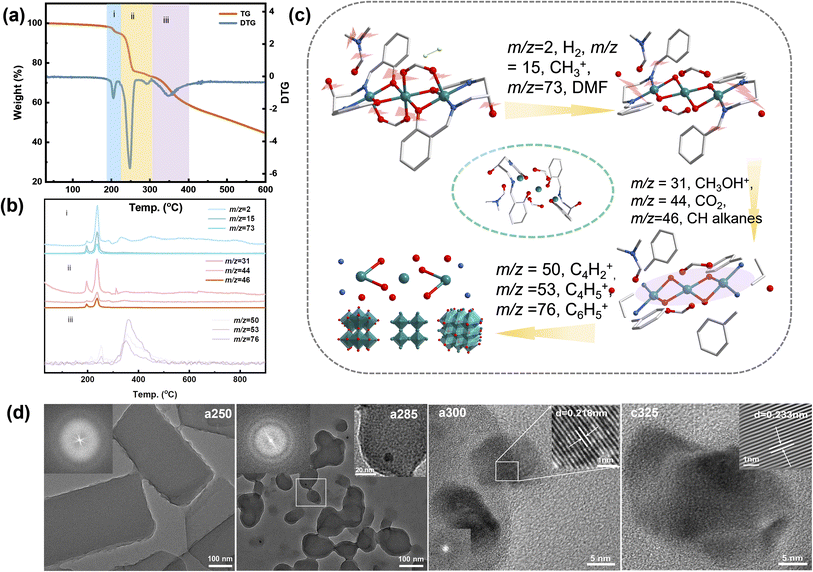
The TG curve is shown in Fig. 1a, mass losses and corresponding temperatures during the three stages of pyrolysis are 3.33%, 22.6%, and 21.74%, respectively. The pyrolysis process of the compounds is divided mainly into three stages: (i) the first stage is the loss of guest molecules at 213 °C and the main source of H2 (m/z = 2, where hydrogen is obtained from the condensation of aromatic structures), CH3+ (m/z = 15), and DMF (m/z = 73). (ii) The second stage at 213–308 °C is the basic pyrolysis stage of the complex, and the main small molecular fragments lost include CH2CHOH+ (m/z = 31), CO2 (m/z = 44), CH2CHOHCH2+ (m/z = 46). (iii) The third stage starts at 310 °C and lasts until 900 °C. There is a rapid weight loss stage between 308 °C and 413 °C, accompanied by the loss of C4H2+ (m/z = 50), C4H5+ (m/z = 53) and C6H5+ (m/z = 76). According to TG-MS data (Fig. 1b and c), following chemical reactions occurred in this process:
| 2C21H24N3Ni1.5O6 → CxHx−1NyNiy/2Oz + H2, DMF + chain alkanes | (1) |
| CxHx−1NyNiy/2Oz → hydrocarbons (CxHx−1CHOHCH) + N-containing, C hybrid compounds + amorphous state NiOx | (2) |
| Hydrocarbons (CxHx−1CHOHCH) → Ni/NiOx@NCs | (3) |
| 2C21H24N3Ni1.5O6 → amorphous state NiOx → Ni/NiOx@NCs | (4) |
Scanning and transmission electron microscopy (SEM and TEM) were utilized to examine the morphology, size, and microstructure of pyrolysis products. The sample subjected to tandem-temperature pyrolysis exhibited an amorphous structure, as evidenced by diffuse rings in fast Fourier transform (FFT) patterns and high-resolution TEM (HRTEM) images (Fig. 1). a250 and a285 samples were confirmed to be amorphous by TEM analysis of heat-treated samples (Fig. 1d). The corresponding FFT patterns (insets of Fig. 1d) displayed a diffuse ring for the edge and a halo pattern for the core, further corroborating the amorphization in the edge region.22 After collapse of the structure, c325 particles agglomerated, but no obvious difference was observed in the microscopic morphology before and after agglomeration (Fig. S4†). This indicates that the sample tends towards stability.23 Further analysis verified that main products after pyrolysis were Ni and NiO, along with a peripheral carbon layer. Due to the uniform distribution of metal, oxide, and carbon layers, the nickel metal is largely exposed, which may facilitate faster electron transfer for improved electrocatalytic performance.24
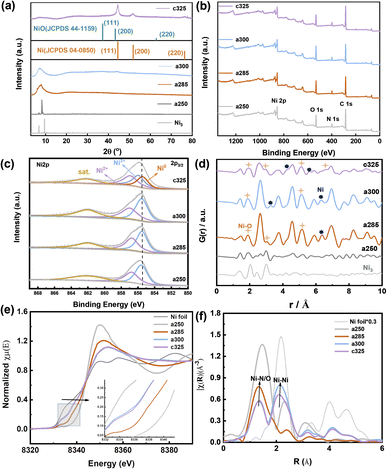
The representative peaks at 44.5°, 51.8°, and 76.4° are assigned to (111), (200), and (220) planes of metallic nickel (JCPDS 04-0850),25 respectively, indicating the amorphous nature of c325. When the pyrolysis temperature reaches 250 °C, the crystal structure has changed, and wide peaks appear at about 2θ = 8.59° for a285 and a300, which proves that the compound has changed from a crystalline state to an amorphous and crystalline transition state (Fig. 3a). Compared with the Ni/NiO standard card, the crystal plane index of c325 contains mainly NiO (JCPDS 47-1049)26 and Ni (JCPDS 04-0850) after pyrolysis at 325 °C.
The surface chemical states of a250, a285, a300, and c325 were examined by XPS. The surface chemical composition consisted of C, N, O, and Ni (Fig. 2b). The high-resolution Ni 2p spectrum displayed a peak at 855.8 eV for Ni 2p3/2 of Ni3+, along with two satellite peaks at 862.3 eV and 880.6 eV, indicating the oxidation of surface Ni to Ni(II) or Ni(III) in the pyrolysis products. Compared to standard XPS data for nickel compounds, the peak positions of the c325 samples at 856.8 eV (Ni 2p3/2) and 874.3 eV (Ni 2p1/2) exhibited a positive shift versus standard NiO positions, while typical NiO satellite peaks were at 860.6 eV and 877.9 eV; the two satellite peaks of pyrolysis samples (862.3 eV and 880.6 eV) shifted forward, suggesting that the surface Ni existed predominantly as Ni(III). The literature standard peak positions for Ni(III) in NiOx were 855.5 eV (Ni 2p3/2) and 873.3 eV (Ni 2p1/2).27 Compared to standard positions, the peak positions of synthesized samples were positively shifted (Fig. 2c), indicating that the nickel valence state on the surface of our prepared samples was higher than the typical Ni(III). Since high-valent nickel serves as active sites for methanol adsorption, this may promote high activity for the methanol oxidation reaction.28
Using PDF analyses, more information on the structure and particle size of Ni species can be obtained. The small crystallite sizes cause deviations on the absolute scale for G(r) and intensity ratios. At short range (below γ of 10 Å, Fig. 2d), both PDFs are practically equal, not only in the position of the peaks but also in their intensity. The peaks at 2.48 Å, 3.52 Å, 4.30 Å, 5.56 Å, and 6.56 Å belong to Ni0. 3.01 Å, 5.10 Å, and 6.61 Å, which correspond to Ni–O, are consistent with XANES results. X-ray absorption near-edge structure (XANES) and extended X-ray absorption fine structure (EXAFS) spectroscopy analyses were conducted. The XANES spectrum at the Ni K-edge revealed that compound Ni3 exhibited the highest white line intensity, whereas the Ni foil displayed the lowest intensity.29
The experimental findings indicate that at 285 °C, the nickel (Ni) valence state lies between Ni2+ and Ni3+ (Fig. 2e). After tandem pyrolysis, the Ni valence state in each sample exceeds that of the initial sample. Notably, in the a250 sample, the Ni valence state remains lower than the original, implying retention of its metallic phase during pyrolysis. The reciprocal space (R-space) analysis reveals two distinct coordination peaks at 1.61 and 2.15 Å (uncorrected for phase shift) (Fig. 2f), assignable to Ni–O/N and Ni–Ni interactions, respectively. Specifically, a285 predominantly exhibits the Ni–O/Ni–N form, with the 2.15 Å peak corresponding to the single scattering path of Ni–Ni.
The spectral analysis of a300 closely resembles that of nickel, maintaining stability at approximately 2.15 Å. For a250, a285, a300, and c325, dual peaks in the EXAFS spectrum are evident, appearing at 1.73 Å and 2.14 Å, respectively. Focusing on Fourier-transformed (FT) peaks near 1.73 Å, a detailed analysis reveals an average Ni–Ni spacing marginally shorter than that of Ni3+ (2.49 Å), indicating the presence of coordination unsaturation and structural distortion in the local coordination of nickel (Ni–O or Ni–N).30 Concomitantly, close to 2.14 Å, the FT peak resulting from the single scattering of the Ni–Ni path suggests the existence of metallic phases. The observable strength of the Ni–Ni bond peak in a300 and Ni–O coordination in c325 imply that 300 °C represents a temperature node for the structural transition from an amorphous to a crystalline state. This structural insight underscores the complex interplay between tandem pyrolysis and evolution of nickel coordination environments in examined samples.31
The catalytic performance of prepared electrocatalysts is evaluated by electrochemical testing, and the OER conversion mechanism is as follows:5
| Ni + 2OH− → Ni–O + H2O + 2e− |
| Ni–O + 2OH− → Ni + O2 + 2H2O + 2e− |
| UOR: Ni + OH− → Ni–OH |
| 6Ni(OH)2 + 6OH− → 6NiOOH + 6H2O + 6e− + CO(NH2)2 → 6Ni(OH)2 + N2 + CO2(g). |
| MOR: Ni + OH− → Ni–OH |
| Ni–CH3OH* → OH−–CH3O* → CH2O* → CHO* → CO* → COOH* → CO2 + H2O. |
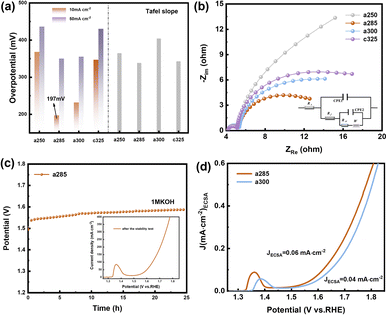
Due to the pronounced electronic correlation effect within the three-dimensional orbitals of nickel atoms, catalysts based on nickel have consistently been a focal point in OER research. The redox peak of Ni(II)/Ni(III) is susceptible to oxidation, showcasing the potential of nickel-based materials for finely tuning electronic structures and serving as effective active sites for methanol oxidation. This insight prompted an investigation into the electrocatalytic performance of OER/UOR/MOR under alkaline conditions. The electrocatalytic OER performance of all catalysts (a250, a285, a300, and c325) was assessed via LSV using a standard three-electrode system in a nitrogen-saturated 1 M KOH electrolyte. In Fig. 3a, a285 exhibited a mere 197 mV overpotential to achieve a reference current density of 10 mA cm−2. Tafel plots, derived from polarization curves to gain deeper insight into electrochemical reaction kinetics (Fig. S9†), revealed a Tafel slope of 156.21 mV dec−1 for a285 and 161.44 mV dec−1 for a300.
The data demonstrates that a285 and a300 also exhibit good dynamics at high current densities of 50 mA cm−2. Fig. 3b illustrates the equivalent circuit diagram used for fitting, where Rs represents the contact resistance, which can be respectively represented as charge transfer resistance (Rct) and Warburg impedance (Zw), with R being the internal resistance,32 the value of the X-axis intercept of the semicircle, which was 4.30 Ω cm2 before the first cyclic voltammetry cycle. The Faraday process can be further divided into two parts: charge transfer and mass transfer.33 The Nyquist plot shows that a285 has the smallest semicircle radius, indicating the minimum charge transfer resistance (Rct). This could be attributed to the rapid reaction kinetics of electrocatalytic water oxidation or the large specific surface area.34 We quantified the electrochemically active surface area (ECSA) through electrochemical double-layer capacitors (Cdl). CV curves in the non-Faraday region, recorded at various scanning rates (20, 40, 60, 80, and 120 mV s−1) in 1.0 M KOH, are presented. The Cdl of a300 was determined to be 12.00 mF cm−2 by calculating the difference in current density at half of the slope using the linear relationship (ja − jc)/2. Following closely, the Cdl value of a285 was measured as 8.72 mF cm−2 (Fig. S10†).
Recognizing the long-term durability as a pivotal indicator in the development of high-performance electrocatalysts, these findings contribute to a comprehensive assessment of electrochemical characteristics and potential applications of studied materials.35 The stability of a285 was evaluated through chronoamperometry in 1.0 M KOH at a constant overpotential of 50 mV, as depicted in Fig. 3c. Following more than 24 hours of long-term stability testing, the potential required to maintain current density exhibited minimal variation. Subsequent to stability testing, LSV was conducted again, the overpotential was measured as 260 mV at 10 mA cm−2, underscoring the excellent stability of the a285 sample in long-term oxygen evolution reactions under alkaline conditions.
We normalized the current density based on the corresponding roughness factor (Rf) obtained from ECSA results (Fig. 3d). At a 350 mV overpotential, the specific current density of a300 was 0.04 mA cm−2, while that of a285 was 0.06 mA cm−2. The higher specific current density of a285 compared to the control sample a300 suggests that a285 is inherently more active. This phenomenon may arise from the synergistic effect of exposing more active sites in unique structural features of a285, along with the accelerated electron transfer and significantly improved OER activity induced by Ni3+ species on the oxidation surface.
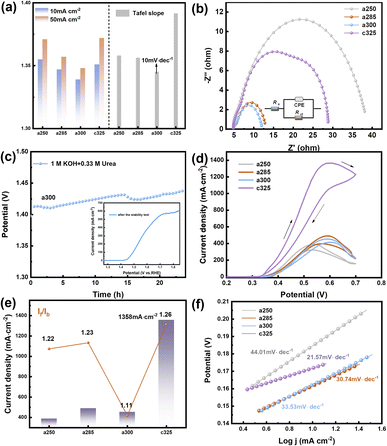
The UOR performance was evaluated in oxygen-saturated 1 M KOH + 0.33 M urea. For a300, a sharp increase in the anodic current was observed at an onset potential of 1.339 V vs. RHE. The electrode potentials at 10 mA cm−2 were 1.355 V, 1.347 V, and 1.339 V for a250, a285, and a300 electrodes, respectively. The Tafel slope of a300 was as low as 10.15 mV dec−1, lower than a285 (12.65 mV dec−1) or c325 (20.59 mV dec−1) (Fig. 4a). This indicates that the reaction follows the Volmer-Tafel mechanism where the chemical recombination of adsorbed H is the rate-determining step. The low Tafel slope of a300 signifies high UOR catalytic activity arising from fast and efficient charge and mass transfer during the catalytic process.36
In Fig. 4b, the electrochemical impedance spectrum of the catalyst after the addition of urea solution reveals that the a300 catalyst exhibits the optimal kinetic process. The electrochemical double-layer capacitance fitting curve, derived from the cyclic voltammetry curve within the valid Ladi interval (Fig. S15†), confirms that the a300 sample possesses the highest Cdl value (Cdl = 2.31 mF cm−2), indicative of a relatively large electrochemical specific surface area. Utilizing eqn (4), turnover frequency (TOF) values for the catalyst were calculated as 0.22 s−1, 0.26 s−1, 0.11 s−1, and 0.16 s−1, respectively. The a300 catalyst demonstrates robust intrinsic activity. In Fig. 4c, the chronopotentiometric curve of a300 over 24 hours reveals sustained performance, and subsequent LSV curve scanning indicates a rise in potential and a decrease in the number of active sites. This decline in active sites, coupled with the extended sample consumption over time, suggests that the favorable UOR response is likely to be attributable to the presence of abundant active sites in the catalyst.
The MOR performance of the pyrolysis electrocatalyst was assessed through CV in 1.0 M KOH and 0.5 M methanol solution. Prior to MOR testing, a CV activation consisting of 50 cycles was conducted in a solution of 1 M KOH and 0.5 M CH3OH until a stable curve shape was achieved. The resulting CV curve exhibits two distinct oxidation peaks, with the forward peak current (If) during forward scanning and reverse peak current (Ib) during reverse scanning occurring around 0.55 V. If is associated with the formation of intermediate product CO during methanol oxidation, while Ib corresponds primarily to the oxidation of adsorbed intermediate species that are not fully oxidized.37 The peak current density of c325 is notably the highest at 1358 mA cm−2, surpassing that of a250 (388 mA cm−2), a285 (490 mA cm−2), and a300 (453 mA cm−2) (Fig. 4d). This performance is superior to that of most reported Ni-based electrocatalysts, underscoring the efficacy of c325 in methanol oxidation reactions.
The Tafel slopes for methanol electrooxidation of a250, a285, a300, and c325 were 44.01, 30.74, 33.53, and 21.57 mV dec−1, respectively (Fig. 4f). Compared to other groups, c325 exhibited the lowest Tafel slope, indicating significantly enhanced kinetics for methanol electrooxidation. Key indicators of electrocatalytic efficiency and catalyst tolerance to carbonaceous intermediates are If and Ib values.38 The If/Ib ratios were 1.22, 1.23, 1.11, and 1.26 for a250, a285, a300, and c325, respectively (Fig. 4e). This improved electrooxidation performance is attributed primarily to abundant nickel active sites and unsaturated coordination in the amorphous material continually generated by decomposition of the complex framework.39 The c325 sample exhibited a Cdl of 2.4 mF cm−2 (Fig. S16†), indicating a large electrochemically active surface area. The fracturing of the peripheral carbon skeleton and formation of N–Ni, Ni–O, and Ni–Ni bonds likely exposed more Ni nanocrystals, increasing the specific surface area and MOR activity. Based on electrochemical results, we demonstrate the tremendous potential of amorphous and crystalline derivatives prepared from Ni3-derived precursors for OER, UOR and MOR electrocatalytic applications.40
DFT calculations were performed to elucidate the underlying mechanism for the enhanced OER performance. Ni sites play an important role in the catalytic process, as the density of states (DOS) of the Ni2 atom in Ni3 crystals and a285 is concentrated at the Fermi level. Adsorption of electrons on the Ni2 surface can shift the d-band center of the Ni2 atom in a285 closer to the Fermi level (Fig. 5b). The higher OER activity could be attributed to stabilized OH− adsorption on the Ni2 surface, which accelerates O2 evolution (Fig. 5d). The remarkable OER electrocatalytic activity and stability of a285 can be ascribed to following reasons. As demonstrated by combined TG-MS, XPS, XANES, and DFT analyses, the amorphous structure provides rich 3d diffusion channels for charge carriers and contains highly dispersed Ni2 sites with defined charge states and bonding. This enables selective and efficient catalysis of specific reactions. The outstanding electrocatalytic performance of a285 further validates the structural advantages of the nickel complex.
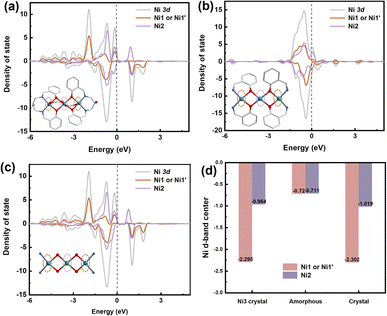 | ||
| Fig. 5 Theoretical calculation. (a) Density of states (DOS) (N 2p) of (a) Ni3-crystal, (b) a285, and (c) c325 crystal. (d) D-band of nickel atoms. | ||
Conclusions
In summary, we have uncovered modulation mechanisms of electrocatalytic oxygen/urea/methanol oxidation reactivity correlated with crystalline-to-amorphous transitional motifs in nickel clusters mediated by prudent tandem-temperature pyrolysis through rigorous experimentation combined with theoretical calculations. In situ TG-MS technology coupled with X-ray distribution function analysis was utilized to investigate the crystalline-to-amorphous transformation of Ni3 during tandem pyrolysis. A homogeneous amorphous material was generated in the pyrolysis process, primarily attributed to inadequate ligand fracturing, which facilitated electron transfer. Density functional theory calculations further revealed that the three amorphous Ni atoms were located near the Fermi level. The Ni2, Ni1 and Ni1′ components not only offer abundant diffusion pathways for hydroxyl ions but also possess highly dispersed nickel metallic sites, a concentrated density of states, and definitive interfacial bonding. Moreover, Ni2, Ni1 and Ni1′ nanoparticles catalyze oxygen evolution reactions (a285) and urea (a300)/methanol (c325) oxidation reactions with remarkably high selectivity and efficiency (η10 = 197 mV, η10 = 1.339 V and 1358 mA cm−2 at 0.56 V, respectively). Such attributes render this material among the most exceptional nickel-based electrocatalysts for these reaction systems, unveiling new opportunities to enable enhanced oxygen evolution through electronic structure engineering of nickel metal (or amorphous compounds) for water splitting applications.Data availability
All experimental data associated with this article have been included in the main text and ESI.†Author contributions
Xu Peng and Hai-Bin Yu conceived the idea, co-wrote the paper and supervised the whole experimental procedure and data analysis. Li Li, Hui-Feng Zhao, Mei-Xing Gan, Tao Zhang, Jia-Ning Li, Shi Tao and Jing Peng performed the experiments, analyzed the data and wrote the manuscript. All the authors discussed the results, commented on and revised the manuscript.Conflicts of interest
There are no conflicts to declare.Acknowledgements
This work is supported by the National Thousand a Young Talents Program of China, Fundamental Research Funds for the Central Universities (2018KFYXKJC009), Wuhan Knowledge Innovation Special Project (2023020201020422), and Natural Science Foundation of the Jiangsu Higher Education Institutions (23KJA430001).Notes and references
- N. K. Oh, J. Seo, S. Lee, H. J. Kim, U. Kim, J. Lee, Y. K. Han and H. Park, Highly efficient and robust noble-metal free bifunctional water electrolysis catalyst achieved via complementary charge transfer, Nat. Commun., 2021, 12, 4606 CrossRef CAS PubMed.
- R. Zhang, W. Liu, F.-M. Zhang, Z.-D. Yang, G. Zhang and X. C. Zeng, COF-C4N Nanosheets with uniformly anchored single metal sites for electrocatalytic OER: from theoretical screening to target synthesis, Appl. Catal., B, 2023, 325, 122366 CrossRef CAS.
- S. Xu, X. Ruan, M. Ganesan, J. Wu, S. K. Ravi and X. Cui, Transition Metal-Based Catalysts for Urea Oxidation Reaction (UOR): Catalyst Design Strategies, Applications, and Future Perspectives, Adv. Funct. Mater., 2024, 2313309 CrossRef.
- H. Cheng, B. Dong, Q. Liu and F. Wang, Direct Electrocatalytic Methanol Oxidation on MoO3/Ni(OH)2: Exploiting Synergetic Effect of Adjacent Mo and Ni, J. Am. Chem. Soc., 2023, 145, 26858–26862 CrossRef CAS PubMed.
- M. Hao, J. Chen, J. Chen, K. Wang, J. Wang, F. Lei, P. Hao, X. Sun, J. Xie and B. Tang, Lattice-disordered high-entropy metal hydroxide nanosheets as efficient precatalysts for bifunctional electro-oxidation, J. Colloid Interface Sci., 2023, 642, 41–52 CrossRef CAS PubMed.
- Y. Li, L. Zhao, X. Du, W. Gao, C. Zhang, H. Chen, X. He, C. Wang and Z. Mao, Cobalt-doped IrRu bifunctional nanocrystals for reversal-tolerant anodes in proton-exchange membrane fuel cells, Chem. Eng. J., 2023, 461, 141823 CrossRef CAS.
- X. Zhang, A. Wu, D. Wang, Y. Jiao, H. Yan, C. Jin, Y. Xie and C. Tian, Fine-tune the electronic structure in Co-Mo based catalysts to give easily coupled HER and OER catalysts for effective water splitting, Appl. Catal., B, 2023, 328, 122474 CrossRef CAS.
- P. Thangavel, H. Lee, T.-H. Kong, S. Kwon, A. Tayyebi, J.-h. Lee, S. M. Choi and Y. Kwon, Immobilizing Low-Cost Metal Nitrides in Electrochemically Reconstructed Platinum Group Metal (PGM)-Free Oxy-(Hydroxides) Surface for Exceptional OER Kinetics in Anion Exchange Membrane Water Electrolysis, Adv. Energy Mater., 2023, 13, 2203401 CrossRef CAS.
- Z. Li, B. Li, M. Yu, C. Yu and P. Shen, Amorphous metallic ultrathin nanostructures: A latent ultra-high-density atomic-level catalyst for electrochemical energy conversion, Int. J. Hydrogen Energy, 2022, 47, 26956–26977 CrossRef CAS.
- Z. Chen, Q. Fan, J. Zhou, X. Wang, M. Huang, H. Jiang and H. Cölfen, Toward Understanding the Formation Mechanism and OER Catalytic Mechanism of Hydroxides by In Situ and Operando Techniques, Angew. Chem., Int. Ed., 2023, 62, e202309293 CrossRef CAS PubMed.
- A. Shahzad, F. Zulfiqar and M. Arif Nadeem, Cobalt containing bimetallic ZIFs and their derivatives as OER electrocatalysts: A critical review, Coord. Chem. Rev., 2023, 477, 214925 CrossRef CAS.
- S. Cao, J. Qi, F. Lei, Z. Wei, S. Lou, X. Yang, Y. Guo, P. Hao, J. Xie and B. Tang, Reduction-induced surface reconstruction to fabricate cobalt hydroxide/molybdenum oxide hybrid nanosheets for promoted oxygen evolution reaction, Chem. Eng. J., 2021, 413, 127540 CrossRef CAS.
- L. Zhou, P. Jiao, L. Fang, L. Liu, Z. Hao, H. Wang, Y. M. Kang, K. Zhang and J. Chen, Two-Phase Transition Induced Amorphous Metal Phosphides Enabling Rapid, Reversible Alkali-Metal Ion Storage, ACS Nano, 2021, 15, 13486–13494 CrossRef CAS PubMed.
- S. Wang, W. Huo, H. Feng, Z. Xie, J. K. Shang, E. V. Formo, P. H. C. Camargo, F. Fang and J. Jiang, Enhancing Oxygen Evolution Reaction Performance in Prussian Blue Analogues: Triple-Play of Metal Exsolution, Hollow Interiors, And Anionic Regulation, Adv. Mater., 2023, 35, 2304494 CrossRef CAS PubMed.
- Z. Jia, T. Yang, L. Sun, Y. Zhao, W. Li, J. Luan, F. Lyu, L. C. Zhang, J. J. Kruzic, J. J. Kai, J. C. Huang, J. Lu and C. T. Liu, A Novel Multinary Intermetallic as an Active Electrocatalyst for Hydrogen Evolution, Adv. Mater., 2020, 32, 2000385 CrossRef CAS PubMed.
- Z. Jia, J.-L. Jiang, L. Sun, L.-C. Zhang, Q. Wang, S.-X. Liang, P. Qin, D.-F. Li, J. Lu and J. J. Kruzic, Role of Boron in Enhancing Electron Delocalization to Improve Catalytic Activity of Fe-Based Metallic Glasses for Persulfate-Based Advanced Oxidation, ACS Appl. Mater. Interfaces, 2020, 12, 44789–44797 CrossRef CAS PubMed.
- J. Ding, D. Ji, Y. Yue and M. M. Smedskjaer, Amorphous Materials for Lithium-Ion and Post-Lithium-Ion Batteries, Small, 2024, 20, e2304270 CrossRef PubMed.
- X. Li, W. Cai, D.-S. Li, J. Xu, H. Tao and B. Liu, Amorphous alloys for electrocatalysis: the significant role of the amorphous alloy structure, Nano Res., 2021, 16, 4277–4288 CrossRef.
- F. Zhou, M. Gan, D. Yan, X. Chen and X. Peng, Hydrogen-Rich Pyrolysis from Ni-Fe Heterometallic Schiff Base Centrosymmetric Cluster Facilitates NiFe Alloy for Efficient OER Electrocatalysts, Small, 2023, 19, e2208276 CrossRef PubMed.
- T. Li, Y. F. Wang, Z. Yin, J. Li, X. Peng and M. H. Zeng, The sequential structural transformation of a heptanuclear zinc cluster towards hierarchical porous carbon for supercapacitor applications, Chem. Sci., 2022, 13, 10786–10791 RSC.
- L. Wang, L. Li, M. Gan, Z. Wang, T. Li, Z. Wang, Y. Li, S. Tao and X. Peng, Micro-pyrolysis perturbation promotes electrocatalytic activity of tetranuclear nickel clusters, Electrochim. Acta, 2023, 464, 142794 CrossRef CAS.
- J. Liu, J. Nai, T. You, P. An, J. Zhang, G. Ma, X. Niu, C. Liang, S. Yang and L. Guo, The Flexibility of an Amorphous Cobalt Hydroxide Nanomaterial Promotes the Electrocatalysis of Oxygen Evolution Reaction, Small, 2018, 14, e1703514 CrossRef PubMed.
- H.-l. Li, Y.-y. Wang, C.-m. Liu, S.-m. Zhang, H.-f. Zhang and Z.-w. Zhu, Enhanced OER performance of NiFeB amorphous alloys by surface self-reconstruction, Int. J. Hydrogen Energy, 2022, 47, 20718–20728 CrossRef CAS.
- S. Hu, S. Wang, C. Feng, H. Wu, J. Zhang and H. Mei, Novel MOF-Derived Nickel Nitride as High-Performance Bifunctional Electrocatalysts for Hydrogen Evolution and Urea Oxidation, ACS Sustainable Chem. Eng., 2020, 8, 7414–7422 CrossRef CAS.
- R. Yuvakkumar, S. Lee, G. W. Lee and S. I. Hong, An environment benign biomimetic synthesis of mesoporous NiO concentric stacked doughnuts architecture, Microporous Mesoporous Mater., 2015, 207, 185–194 CrossRef CAS.
- Ö. Çoban, S. Tekmen, E. Gür and S. Tüzemen, High optical response NiO, Pd/NiO and Pd/WO3 hydrogen sensors, Int. J. Hydrogen Energy, 2022, 47, 25454–25464 CrossRef.
- G. Chen, Z. Hu, Y. Zhu, Z.-G. Chen, Y. Zhong, H.-J. Lin, C.-T. Chen, L. H. Tjeng, W. Zhou and Z. Shao, Ultrahigh-performance tungsten-doped perovskites for the oxygen evolution reaction, J. Mater. Chem. A, 2018, 6, 9854–9859 RSC.
- M. Wang, X. Dong, Z. Meng, Z. Hu, Y. G. Lin, C. K. Peng, H. Wang, C. W. Pao, S. Ding, Y. Li, Q. Shao and X. Huang, An Efficient Interfacial Synthesis of Two-Dimensional Metal–Organic Framework Nanosheets for Electrochemical Hydrogen Peroxide Production, Angew. Chem., Int. Ed., 2021, 60, 11190–11195 CrossRef CAS PubMed.
- D. Wang, J. Wang, X. Luo, Z. Wu and L. Ye, In Situ Preparation of Mo2C Nanoparticles Embedded in Ketjenblack Carbon as Highly Efficient Electrocatalysts for Hydrogen Evolution, ACS Sustainable Chem. Eng., 2017, 6, 983–990 CrossRef.
- Y. Bai, Y. Wu, X. Zhou, Y. Ye, K. Nie, J. Wang, M. Xie, Z. Zhang, Z. Liu, T. Cheng and C. Gao, Promoting nickel oxidation state transitions in single-layer NiFeB hydroxide nanosheets for efficient oxygen evolution, Nat. Commun., 2022, 13, 6094 CrossRef CAS PubMed.
- I. S. Pieta, A. Rathi, P. Pieta, R. Nowakowski, M. Hołdynski, M. Pisarek, A. Kaminska, M. B. Gawande and R. Zboril, Electrocatalytic methanol oxidation over Cu, Ni and bimetallic Cu-Ni nanoparticles supported on graphitic carbon nitride, Appl. Catal., B, 2019, 244, 272–283 CrossRef CAS.
- S. S. Jeon, P. W. Kang, M. Klingenhof, H. Lee, F. Dionigi and P. Strasser, Active Surface Area and Intrinsic Catalytic Oxygen Evolution Reactivity of NiFe LDH at Reactive Electrode Potentials Using Capacitances, ACS Catal., 2023, 13, 1186–1196 CrossRef CAS.
- S. Shit, S. Chhetri, W. Jang, N. C. Murmu, H. Koo, P. Samanta and T. Kuila, Cobalt Sulfide/Nickel Sulfide Heterostructure Directly Grown on Nickel Foam: An Efficient and Durable Electrocatalyst for Overall Water Splitting Application, ACS Appl. Mater. Interfaces, 2018, 10, 27712–27722 CrossRef CAS PubMed.
- S. Hu, C. Feng, S. Wang, J. Liu, H. Wu, L. Zhang and J. Zhang, Ni3N/NF as Bifunctional Catalysts for Both Hydrogen Generation and Urea Decomposition, ACS Appl. Mater. Interfaces, 2019, 11, 13168–13175 CrossRef CAS PubMed.
- S. Samanta, K. Bhunia, D. Pradhan, B. Satpati and R. Srivastava, Ni and Cu ion-exchanged nanostructured mesoporous zeolite: a noble metal free, efficient, and durable electrocatalyst for alkaline methanol oxidation reaction, Mater. Today Energy, 2018, 8, 45–56 CrossRef.
- B. Cui, C. Wang, S. Huang, L. He, S. Zhang, Z. Zhang and M. Du, Efficient multifunctional electrocatalyst based on 2D semiconductive bimetallic metal-organic framework toward non-Pt methanol oxidation and overall water splitting, J. Colloid Interface Sci., 2020, 578, 10–23 CrossRef CAS PubMed.
- L. Jin, Q. Meng, M. Ma, X. Gao, A. Chen, X. Sun and D. Zhou, Stable and active methanol oxidation via anchored PtRu alloy nanoparticles on NiFe layered double hydroxides, Green Chem., 2024, 26, 3221–3228 RSC.
- R. Sha and S. Badhulika, Facile synthesis of three-dimensional platinum nanoflowers decorated reduced graphene oxide: an ultra-high performance electro-catalyst for direct methanol fuel cells, Mater. Sci. Eng., B, 2018, 231, 115–120 CrossRef CAS.
- B. Habibi and N. Delnavaz, Electrooxidation of glycerol on nickel and nickel alloy (Ni–Cu and Ni–Co) nanoparticles in alkaline media, RSC Adv., 2016, 6, 31797–31806 RSC.
- C. Wang, H. Yang, Y. Zhang and Q. Wang, NiFe Alloy Nanoparticles with hcp Crystal Structure Stimulate Superior Oxygen Evolution Reaction Electrocatalytic Activity, Angew. Chem., Int. Ed., 2019, 58, 6099–6103 CrossRef CAS PubMed.
Footnote |
| † Electronic supplementary information (ESI) available. CCDC 2270095. For ESI and crystallographic data in CIF or other electronic format see DOI: https://doi.org/10.1039/d4sc01696c |
| This journal is © The Royal Society of Chemistry 2024 |

