
 Open Access Article
 This Open Access Article is licensed under a Creative Commons Attribution-Non Commercial 3.0 Unported Licence
Structure-enabled long-lived charge separation in single crystals of an asymmetric donor–acceptor perylenediimide cyclophane†
Malik L.
Williams‡
,
Adam F.
Coleman‡
,
Kathryn R.
Peinkofer
 ,
Ryan M.
Young
* and
Michael R.
Wasielewski
*
,
Ryan M.
Young
* and
Michael R.
Wasielewski
*
Department of Chemistry and Paula M. Trienens Institute for Sustainability and Energy Northwestern University, Evanston, IL 60208-3113, USA. E-mail: m-wasielewski@northwestern.edu
First published on 21st June 2024
Abstract
We report the synthesis and characterization of a covalently linked asymmetric cyclophane comprising a 1,7-di(pyrrolidin-1′-yl)perylene-3,4,9,10-bis(dicarboximide) (pyrPDI) and 1,6,7,12-tetra(4′-t-butylphenoxy)perylene-3,4,9,10-bis(dicarboximide) (tpPDI), which absorbs light from 400–750 nm. Single crystals of pyrPDI-tpPDI were analyzed by using X-ray diffraction and transient absorption microscopy. The crystal structure contains several types of intermolecular donor–acceptor interactions (pyrPDI–pyrPDI, tpPDI–tpPDI, and pyrPDI-tpPDI) in addition to the covalently installed intramolecular interaction. Following photoexcitation of the pyrPDI-tpPDI single crystal, the transient absorption data show that charge separation occurs in τ = 21 ps, which is about nine times faster than in toluene solution, while charge recombination occurs in τ > 2 μs, which is more than 400 times longer than in solution. The faster charge separation in the single crystals results from the intermolecular donor–acceptor pyrPDI-tpPDI interactions, while the greatly enhanced charge-separated state lifetime is a consequence of charge transport through the intermolecular π-stacks. These results demonstrate the utility of pre-organizing donor–acceptor structural motifs to elicit specific crystal morphologies that can lead to enhanced photogenerated charge carrier lifetimes for solar energy conversion.
Introduction
Single cocrystals featuring organic donor–acceptor (D–A) pairs have emerged as valuable tools for probing the intricacies of charge transfer (CT) exciton dynamics within solid materials.1–4 Their inherent anisotropic properties yield insights into how the generation and movement of CT excitons are influenced by specific molecular arrangements,5–11 crucial for optimizing solar energy conversion. Key factors for effective solar energy conversion in these single D–A crystals include prompt CT exciton formation,12 efficient generation of charge carriers from these excitons, and high mobility of these carriers for facile migration towards electrodes or interfaces. Numerous investigations on these cocrystals have shed light on the mechanisms underlying CT exciton generation, evolution, and charge migration.1–3,12–15 Notably, two predominant structural motifs—alternating DADA π-stacks and segregated DDDD and AAAA stacks—emerge from non-covalent interactions like π–π stacking, CT interactions, as well as halogen and hydrogen bonding.1–3,13,14,16 The intimate electronic coupling facilitated by close D–A packing often results in distinctive CT absorption bands in their electronic spectra, enabling direct photoinduced formation of the CT state. However, this can also precipitate rapid charge recombination, hindering CT exciton diffusion and dissociation. While certain D–A cocrystals exhibit prolonged CT states and significant exciton mobilities, extending their lifetimes remains a formidable challenge in crystal engineering, necessitating greater control over D–A interactions within crystal structures.Given that cocrystal structures are primarily dictated by non-covalent interactions, precisely regulating the spatial arrangement of D and A units proves challenging. In contrast, growing single crystals of covalently linked D–A systems offers distinct advantages, including fixed donor–acceptor connectivity and precise control over local D-to-A stoichiometry.17 Moreover, the inherent connectivity of these systems facilitates diverse structural modulations, allowing exploration of alternative packing morphologies. These covalently bound D–A single crystals serve to deepen our understanding of the intricate relationship between structure and CT dynamics, bridging critical gaps in current knowledge.
In this work we have synthesized and crystallized an asymmetric cyclophane, pyrPDI-tpPDI (Scheme 1), containing 1,7-bis(pyrrolidin-1′-yl)-perylene-3,4![[thin space (1/6-em)]](https://www.rsc.org/images/entities/char_2009.gif) :9,10-bis(dicarboximide) (pyrPDI)18–21 as the donor and 1,6,7,12-tetra(phenoxy)-perylene-3,4:9,10-bis(dicarboximide) (tpPDI)22–24 as the acceptor linked via para-xylylene spacers. In solution, as expected, the charge separation (CS) rate in pyrPDI-tpPDI is strongly solvent dependent, with full charge separation occurring in polar CH2Cl2, while a pseudo-equilibrium between the singlet excited state and the charge-separated state is observed in non-polar toluene. Single crystals of pyrPDI-tpPDI were grown and their X-ray structure was obtained. Attempts were made to cocrystallize both tpPDI with pyrPDI and the analogous dianhydrides tpPDA with pyrPDA, however, neither combination resulted in cocrystals, most likely due to steric hindrance between the phenoxy and pyrrolidine substituents. The crystal structure of pyrPDI-tpPDI shows aspects of both structural motifs often found in the D–A cocrystals mentioned above. This unusual combination of both packing types yields rapid and full CS in τ = 180 ps produce a charge-separated state with τ > 2 μs. These qualities make pyrPDI-tpPDI well suited for exploring the dependence of charge generation and migration in single crystals targeting solar energy conversion and other optoelectronic applications. Moreover, the results show the advantages of the covalent D–A design for crystal engineering specific donor–acceptor interactions.
:9,10-bis(dicarboximide) (pyrPDI)18–21 as the donor and 1,6,7,12-tetra(phenoxy)-perylene-3,4:9,10-bis(dicarboximide) (tpPDI)22–24 as the acceptor linked via para-xylylene spacers. In solution, as expected, the charge separation (CS) rate in pyrPDI-tpPDI is strongly solvent dependent, with full charge separation occurring in polar CH2Cl2, while a pseudo-equilibrium between the singlet excited state and the charge-separated state is observed in non-polar toluene. Single crystals of pyrPDI-tpPDI were grown and their X-ray structure was obtained. Attempts were made to cocrystallize both tpPDI with pyrPDI and the analogous dianhydrides tpPDA with pyrPDA, however, neither combination resulted in cocrystals, most likely due to steric hindrance between the phenoxy and pyrrolidine substituents. The crystal structure of pyrPDI-tpPDI shows aspects of both structural motifs often found in the D–A cocrystals mentioned above. This unusual combination of both packing types yields rapid and full CS in τ = 180 ps produce a charge-separated state with τ > 2 μs. These qualities make pyrPDI-tpPDI well suited for exploring the dependence of charge generation and migration in single crystals targeting solar energy conversion and other optoelectronic applications. Moreover, the results show the advantages of the covalent D–A design for crystal engineering specific donor–acceptor interactions.
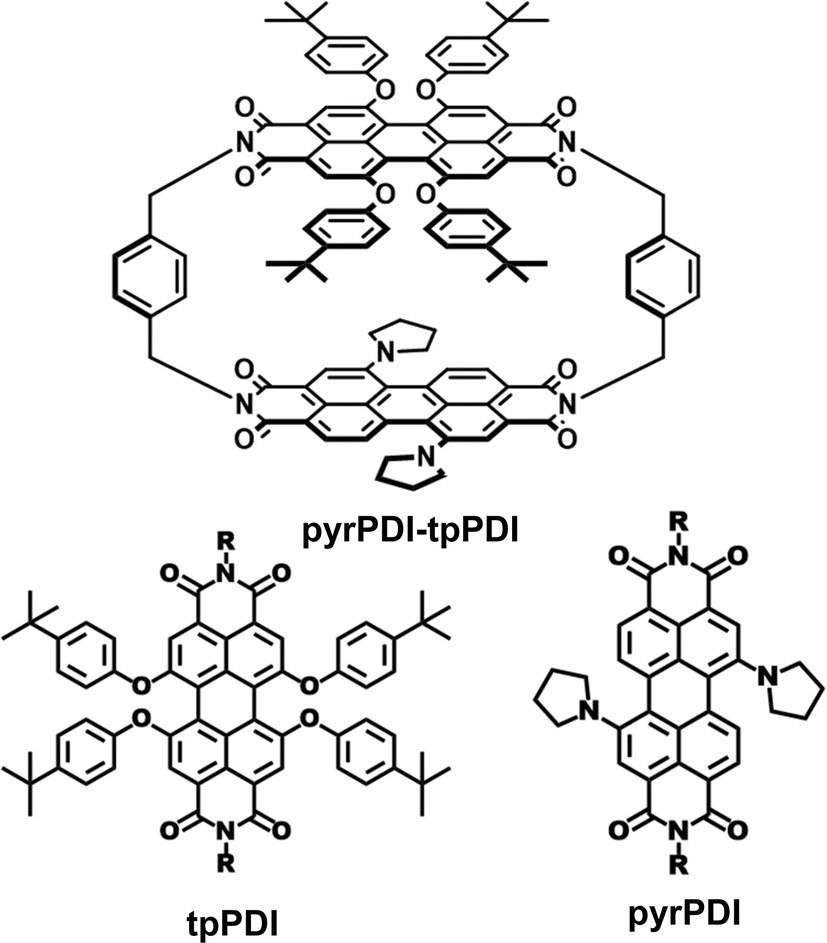 | ||
| Scheme 1 Structures of pyrPDI-tpPDI cyclophane and pyrPDI and tpPDI monomers. | ||
Results and discussion
X-ray structural analysis
Purple, plate-like crystals for pyrPDI-tpPDI were obtained and the crystal structure, as determined from X-ray diffraction of a single crystal, is shown in Fig. 1. PyrPDI-tpPDI crystallizes in a monoclinic P21/n space group with unit-cell dimensions of a = 22.4426 Å, b = 20.9039 Å, c = 30.0536 Å, and there are four pyrPDI-tpPDI cyclophane molecules in each unit cell. The cyclophane itself has a cavity that is 14.3 Å × 7.5 Å; this sizeable cavity allows for a toluene molecule to act as guest, inserting into the cavity via π–π stacking interactions. In addition to the single toluene found within the cavity of the cyclophane, there are two additional toluene solvents molecular outside of the cyclophane. It is well known that functionalizing the core of PDI induces a core twist to minimize steric hindrance;25 this twist can be seen in the cyclophane single crystal as pyrPDI and tpPDI are locked in this confirmation in the solid state. Given that the primary driving force for crystallization is π–π stacking between neighboring cyclophanes and CT interactions between the pyrPDI donor and tpPDI acceptor, an interesting consequence is the alternating pyrPDI-tpPDI, pyrPDI–pyrPDI, and tpPDI–tpPDI intermolecular stacking pattern.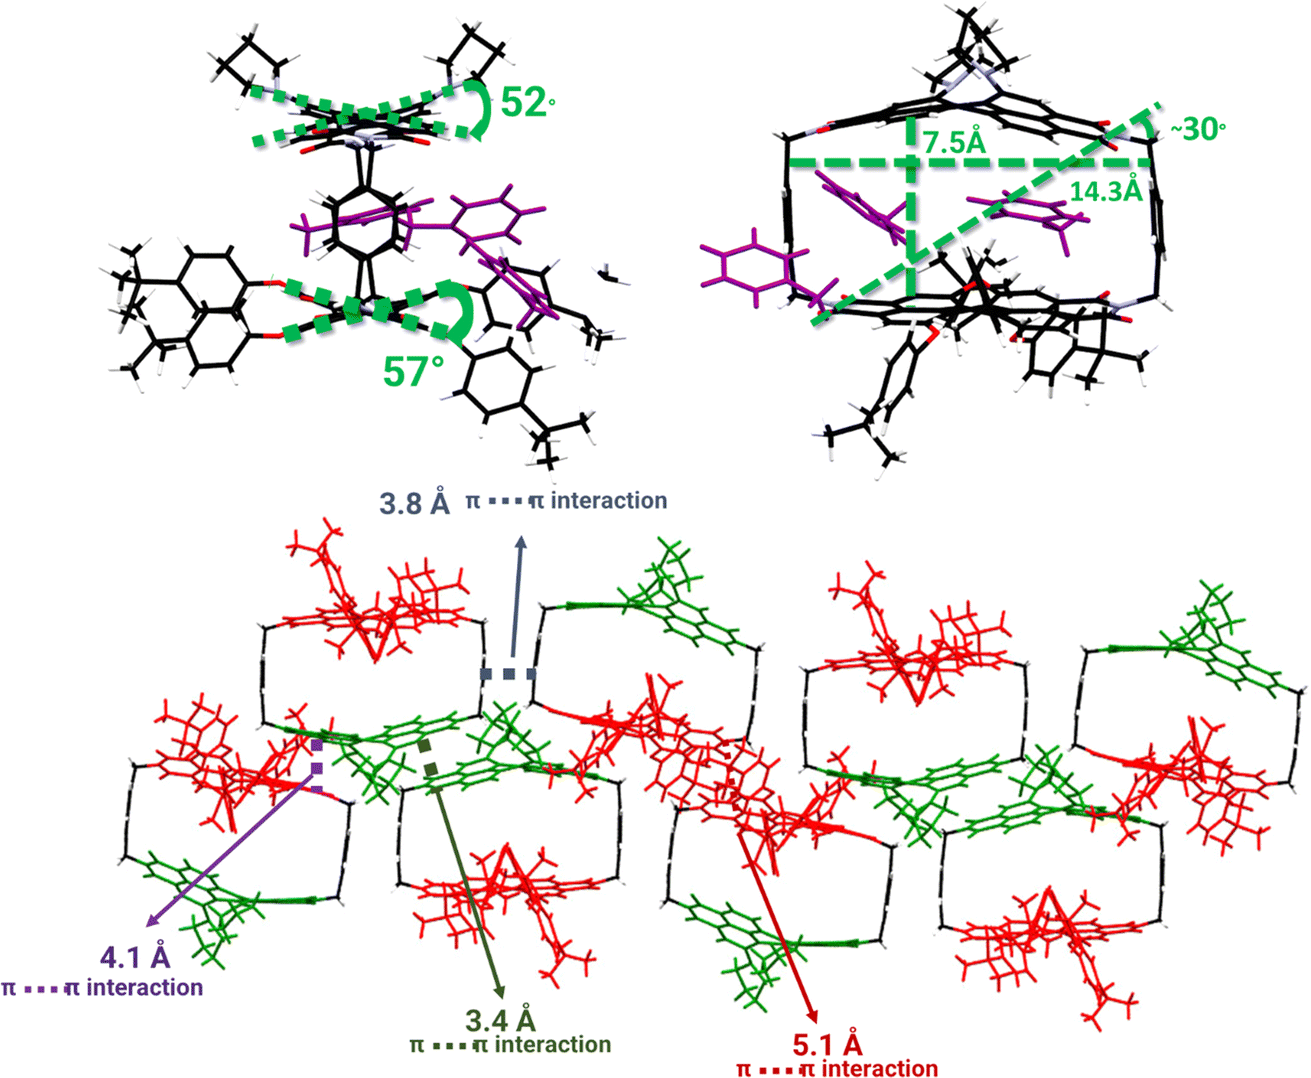 | ||
| Fig. 1 Solid-state structure of pyrPDI-tpPDI obtained from X-ray crystallography on single crystals of pyrPDI-tpPDI. (a) Stick representations of different side views showing the distances defining the box-like geometry of the cyclophane and the torsional angels of the PDI units. (b) Stick representation of the extended intermolecular packing structure showing the π–π stacking distances between different units of the cyclophane. Toluene solvent molecules removed for clarity. | ||
Energetics in solution and solid phases
The steady-state absorption spectra of pyrPDI-tpPDI in CH2Cl2 and toluene are effectively the sum of those of the two monomeric components, indicating a weak electronic interaction between the units commensurate with the large interchromophore distance. In toluene, tpPDI and pyrPDI absorb at 578 nm and 691 nm, respectively. When excited at 650 nm, pyrPDI-tpPDI exhibits broad emission with a maximum at 723 nm and a broad featureless shoulder at 792 nm (Fig. 2a). The fluorescence quantum yield is ϕF = 0.24, compared to 0.35 for monomeric pyrPDI.19 These are slightly red shifted relative to the monomer components, indicating some excitonic coupling between the two PDIs. The crossing point of the normalized absorption and emission spectra give the S1 energy of pyrPDI-tpPDI in toluene as ES = 1.76 eV. In CH2Cl2, the tpPDI and pyrPDI absorb at 585 nm and 708 nm, respectively (Fig. S1a†). The intensity and ratio of the pyrPDI features are different between toluene and the more polar CH2Cl2, indicating that the solvent is influencing the intramolecular charge transfer (CT) character of pyrPDI and the through-space electronic coupling of the pyrPDI and tpPDI units. The emission data are similarly red-shifted, with a maximum at 745 nm, giving ES = 1.71 eV in CH2Cl2.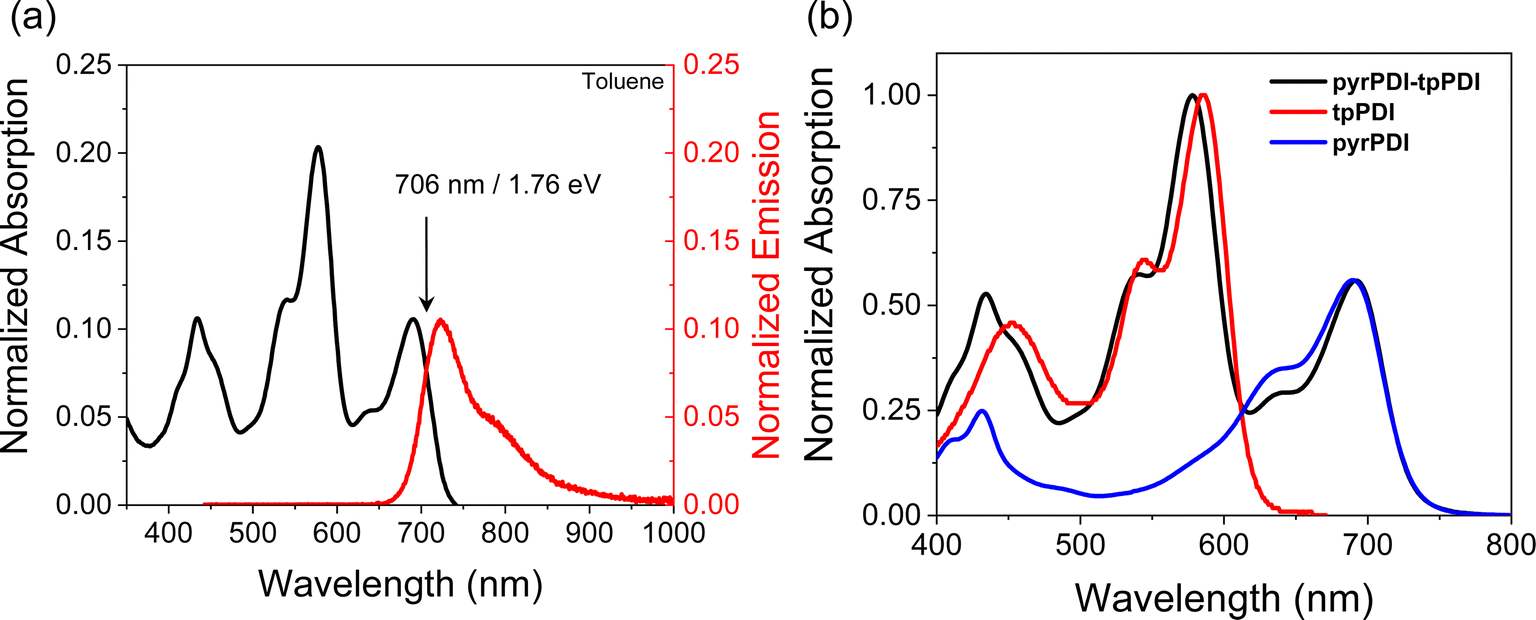 | ||
| Fig. 2 (a) Absorption and emission spectra of pyrPDI-tpPDI in toluene. (b) Absorption of pyrPDI, tpPDI, and pyrPDI-tpPDI in toluene normalized to their corresponding peak maxima. | ||
The one-electron oxidation potential of pyrPDI is EOX = 0.55 V vs. SCE,19 while the one-electron reduction potential of tpPDI is ERED = −0.75 V vs. SCE.26 Correcting for the coulombic attraction of the charges at the distance shown in the crystal structure in Fig. 1, the ion pair energy is approximately 1.09 eV in CH2Cl2, suggesting that electron transfer is thermodynamically favorable with a free energy change ΔGCS = −0.62 eV. In toluene, however, the ion pair energy predicted by the Weller treatment27 is significantly higher, at ΔGIP = 1.76 eV, which is isoenergetic to the S1 state. Thus, ΔGCS ≅ 0 in toluene, and it is unclear if the CS rate will be sufficient to compete with the 4.4 ns excited-state lifetime of pyrPDI.19 Since the dielectric environment in the crystal is most likely similar to toluene, a detailed understanding of the intrinsic charge transfer properties of pyrPDI-tpPDI under these conditions is essential.
In the single crystal, all the features of the steady-state absorption spectrum are red-shifted compared to solution. This red-shifting is expected as there are greater intermolecular interactions in the ordered single crystal causing the S0–S1 gap to decrease. This suggests that the driving force for charge separation may be slightly positive in the crystal unless the ions are similarly stabilized. We also observe a strong polarization dependence from the steady-state absorption, with the crystal being strongly absorptive with the polarization oriented ∼0° to the crystal long axis and nearly transmissive at ∼90° (Fig. 3). This polarization dependence gives us insight into how the pyrPDI-tpPDI molecules are oriented and how this orientation is preserved macroscopically. When the polarization vector of the light is aligned with the individual, parallel transition dipole moments of pyrPDI and tpPDI the crystal is strongly absorptive, and when the polarization is perpendicular to these transition dipole moments, the crystal is nearly transmissive. The strong linear dichroism of pyrPDI-tpPDI is indicative of the high degree of chromophore ordering within the crystal. Moreover, except for redshifting, the solid-state absorption is nearly identical to the solution-phase absorption spectrum, which indicates that the inter-chromophore coupling occurring within the crystal, i.e., the pyrPDI–pyrPDI, tpPDI–tpPDI, and pyrPDI-tpPDI π–π interactions as highlighted in Fig. 1, are not strong enough to distort the individual spectral components. This is likely due to the steric hinderance imposed by the pyrrolidine and phenoxy substituents on the cores of the PDIs, which induces slip-stacking and prevents strong association and therefore electronic coupling.
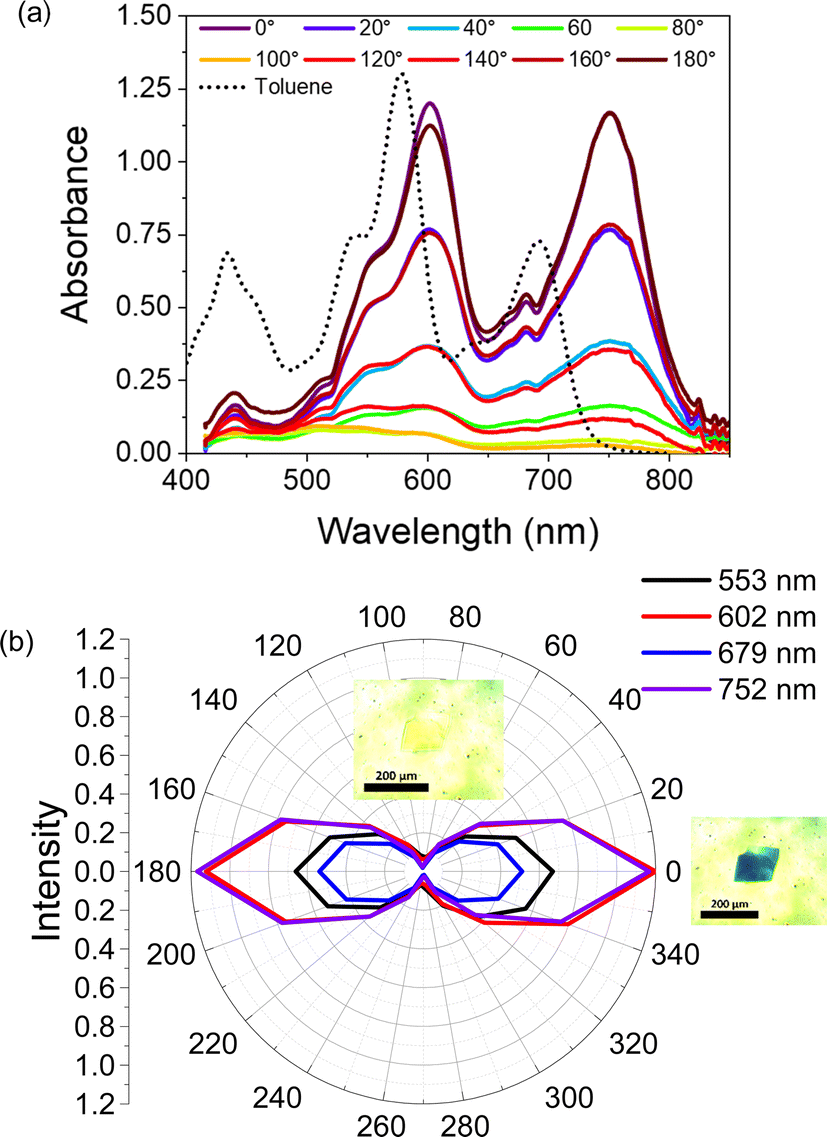 | ||
| Fig. 3 Absorption spectra of a pyrPDI-tpPDI single crystal. (a) Polarization resolved steady-state absorption spectrum of a pyrPDI-tpPDI single crystal. (b) Radial absorption plot of four wavelengths with micrographs at 0 and 90° polarization. | ||
Intramolecular charge transfer in solution
The intramolecular electron transfer dynamics in solution were interrogated with transient absorption spectroscopy. In polar CH2Cl2, where charge transfer is thermodynamically expected, excitation of pyrPDI-tpPDI at 700 nm results in a positive absorptive feature at 967 nm as well as a weak, featureless positive shelf from 1000 to 1600 nm. These features correspond to the pyrPDI excited-state absorption (ESA). At the same time, a bleach forms at 727 nm, consistent with the pyrPDI ground-state bleach/stimulated emission (GSB/SE). A large peak at 794 nm then begins to rise, the GSB at 585 nm deepens, and the GSB at 727 nm decays. These features are all consistent with the formation of the tpPDI anion28 and the decay of the pyrPDI singlet excited state,19 indicating that charge separation occurs. These features then decay to baseline over the next few hundred picoseconds. Using target analysis with an A → B → ground state model, the evolution-associated spectra (EAS) and their corresponding lifetimes can be extracted (Fig. 4). Species A is assigned to the pyrPDI singlet excited state and species B to the charge-separated state. Fitting of data taken in triplicate gives charge separation and recombination lifetimes of 61.8 ± 0.2 ps and 149 ± 2 ps, respectively.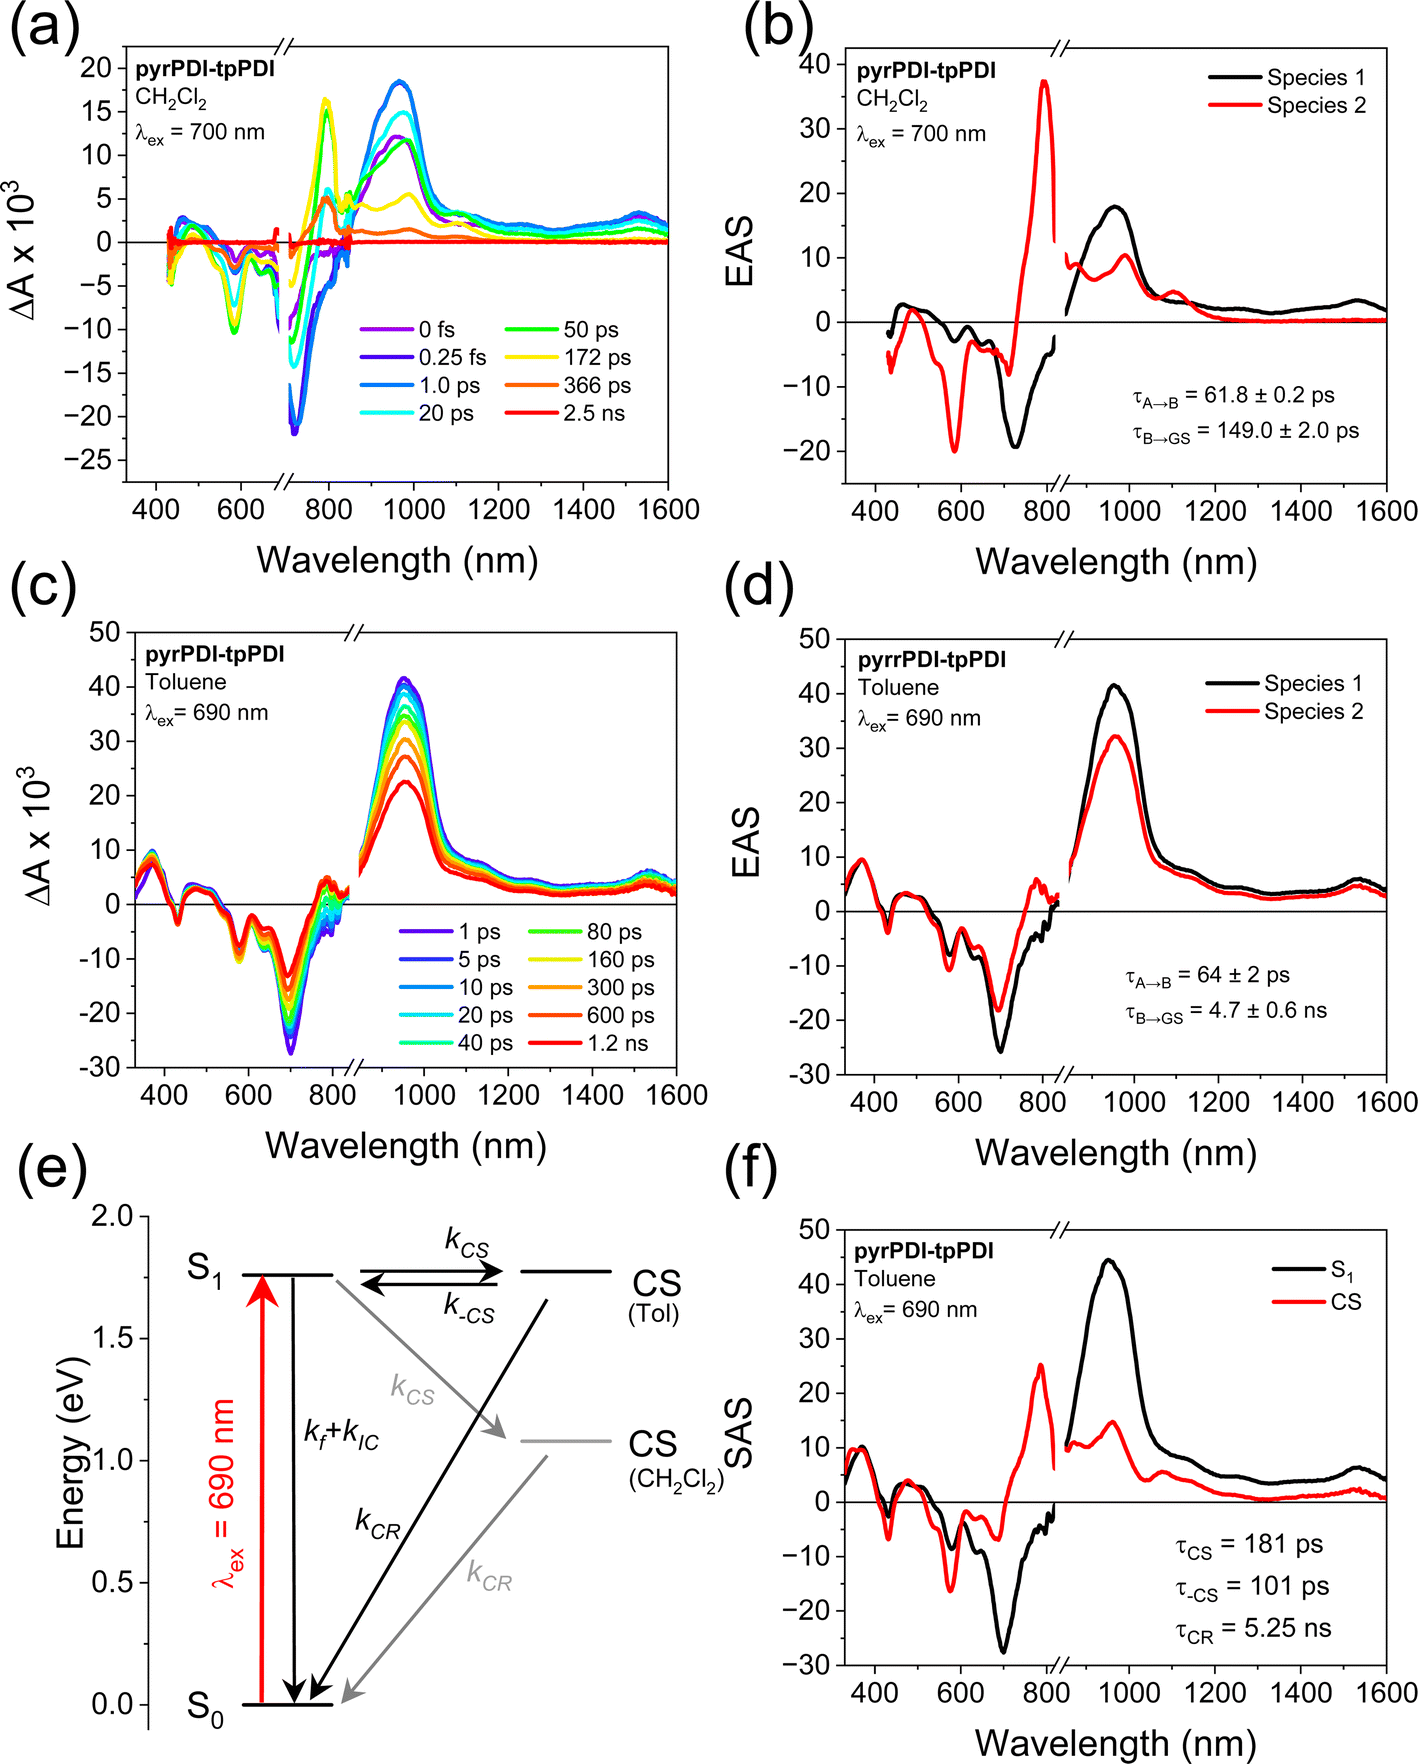 | ||
| Fig. 4 FsTA data at 298 K for pyrPDI-tpPDI in (a) CH2Cl2 with λex = 700 nm and (c) toluene with λex = 690 nm. (b and d) Evolution-associated spectra (EAS) using a sequential A → B → ground state kinetic model for the data in (a) and (c), respectively. (e) Energy level diagram showing the energies of the charge-separated states in both solvents with rate constants for fluorescence (f) and internal conversion (IC), charge separation (CS), recombination to S1 (–CS), and charge recombination (CR) to the ground state. (f) Species-associated spectra of pyrPDI-tpPDI in toluene extracted using an equilibrium model: A ↔ B → ground state. The triplet state is neglected due to low yield. | ||
Based on the overlap between the emission of tpPDI and the absorption of pyrPDI, excitation at higher energies is expected to result in ultrafast energy transfer to pyrPDI. To establish the kinetics of this process with very high time resolution, we used broadband transient absorption spectroscopy with a pump pulse centered at 585 nm and a ∼25 fs instrument response. As shown in Fig. S6,† following excitation in CH2Cl2 the 1*tpPDI ESA appears and is quickly replaced with that of 1*pyrPDI with a time constant of τEnT = 67 ± 27 fs. From there, electron transfer proceeds as with the 700 nm excitation. Thus, regardless of excitation wavelength, charge transfer proceeds from the 1*pyrPDI state.
As indicated from the electrochemistry and steady-state spectroscopy data, the possibility of intramolecular electron transfer in low polarity environments is much less clear. In toluene, excitation of pyrPDI-tpPDI at 690 nm shows a positive absorptive feature at 967 nm as well as a weak featureless positive shelf from 1000 to 1600 nm, and a negative signal at 727 nm. These are again attributed to spectral features of 1*pyrPDI. Over the following ∼1 ns, however, a small peak then begins to grow in at 794 nm, and the GSB at 585 nm intensifies, while the 727 nm GSB decays only slightly. Global analysis confirms that in toluene, the pyrPDI-tpPDI spectrum undergoes a minor evolution during the course of experiment, with the EAS that slightly changes shape before decaying, with lifetimes of τ = 64 ± 2 ps and τ = 4.8 ± 0.6 ns, respectively; the longer time constant is taken from nanosecond TA measurement (Fig. S8†). Low-yielding charge transfer would result in an EAS for the charge-separated state with the same spectrum as that seen in CH2Cl2 but with low amplitude, however the EAS for state B is mostly reminiscent of that of 1*pyrPDI with only a small contribution from the ion pair state. Following charge recombination, a very small triplet signature is observed in the nanosecond TA data; the yield is very low and so this state is not included in the kinetic model, but the triplet spectrum is used in interpreting the single crystal TAM data below.
The role of intramolecular charge transfer in toluene can be resolved by accounting for the presence of an equilibrium between the CS state and the excited state on account of their nearly equal energies.29 Using the rates determined from the evolution-associated analysis discussed above, the fluorescence quantum yield of pyrPDI-tpPDI, and the excited-state dynamics of the pyrPDI monomer in toluene, we can extract the species-associated spectra and the time constants associated with the true charge transfer dynamics; see ESI† for details. The forward charge transfer process occurs in τCS = 181 ps, while reverse charge recombination back to the S1 state has a time constant of τ–CS = 101 ps. This implies an equilibrium constant K = 0.6, meaning that the equilibrium is biased towards the excited state. The corresponding free energy difference between the CS and S1 states is +15 meV, with CS being slightly endoergic, in good agreement with the energies predicted above. Charge recombination occurs in τCR = 5.25 ns, and the population of the CS state never exceeds 33% (Fig. S4†). The true rate of charge separation is thus about three times slower in toluene than in CH2Cl2, which is in keeping with the slightly positive free energy change discussed above.
The presence of this equilibrium is further supported by the time-resolved emission data (Fig. S10†). Following excitation at 650 nm in toluene, pyrPDI-tpPDI emits with the spectrum observed in Fig. 2a, which then decays with a single-exponential component with a rate constant of k = (4.9 ± 0.4 ns)−1 and no apparent spectral changes. Emission with the same lifetime as the long-lived state observed by TA spectroscopy and the same spectrum as the pyrPDI monomer (Fig. S9†) is consistent with emission solely from the S1 state that is in equilibrium with the CT state. This also confirms that delayed emission is the major source of the 24% fluorescence quantum yield in toluene.
Intermolecular charge transfer in crystals
We used transient absorption microscopy to explore possible intermolecular charge transfer pathways introduced by the different chromophore associations present in the solid-state structure. A 520 nm pump was used to excite at a wavelength where the single crystal absorption is nearly independent of the pump polarization and to minimize scatter in the probe region. Since energy transfer is so rapid, the ensuing dynamics all proceed from 1*pyrPDI as in solution. Upon excitation, we observe a large bleach spanning 550–800 nm that is consistent with the steady-state absorption of the crystal (Fig. 3a) and a positive feature at 807 nm ascribed to the excited-state absorption of 1*pyrPDI, which is likely vibrationally excited due to its population by rapid energy transfer from 1*tpPDI (Fig. 5a). We then see the 1*pyrPDI singlet excited-state absorption decay and be replaced by a small positive feature at 787 nm. We assign this to the tpPDI˙− radical anion ESA, indicating that charge separation is occurring within a few ps. This feature is accompanied by an ESA band at 635 nm originating from the radical cation of pyrPDI˙+;19 the higher vibronic band of the cation is likely obscured by the tpPDI bleach. These spectral signatures do not change beyond the formation of the ion pair and persist beyond the 7 ns experimental window (Fig. 5b). From comparison to the reported Tn ← T1 ESA features of both 3*pyrPDI and 3*tpPDI,30,31 and the spectrum in Fig. S5c,† no significant triplet population is formed in the pyrPDI-tpPDI single crystal. Global analysis shows that following rapid relaxation of the vibrationally hot 1*pyrPDI in τrlx = 1.2 ± 0.4 ps, charge separation to pyrPDI˙+-tpPDI˙− occurs in τ = 21.0 ± 0.3 ps, Nanosecond TAM data (Fig. 5c) show that this spectrum decays slowly, persisting beyond 2 μs. This increase in the lifetime of the CS in the single crystals is attributed to charge migration within the extended PDI network in the crystal.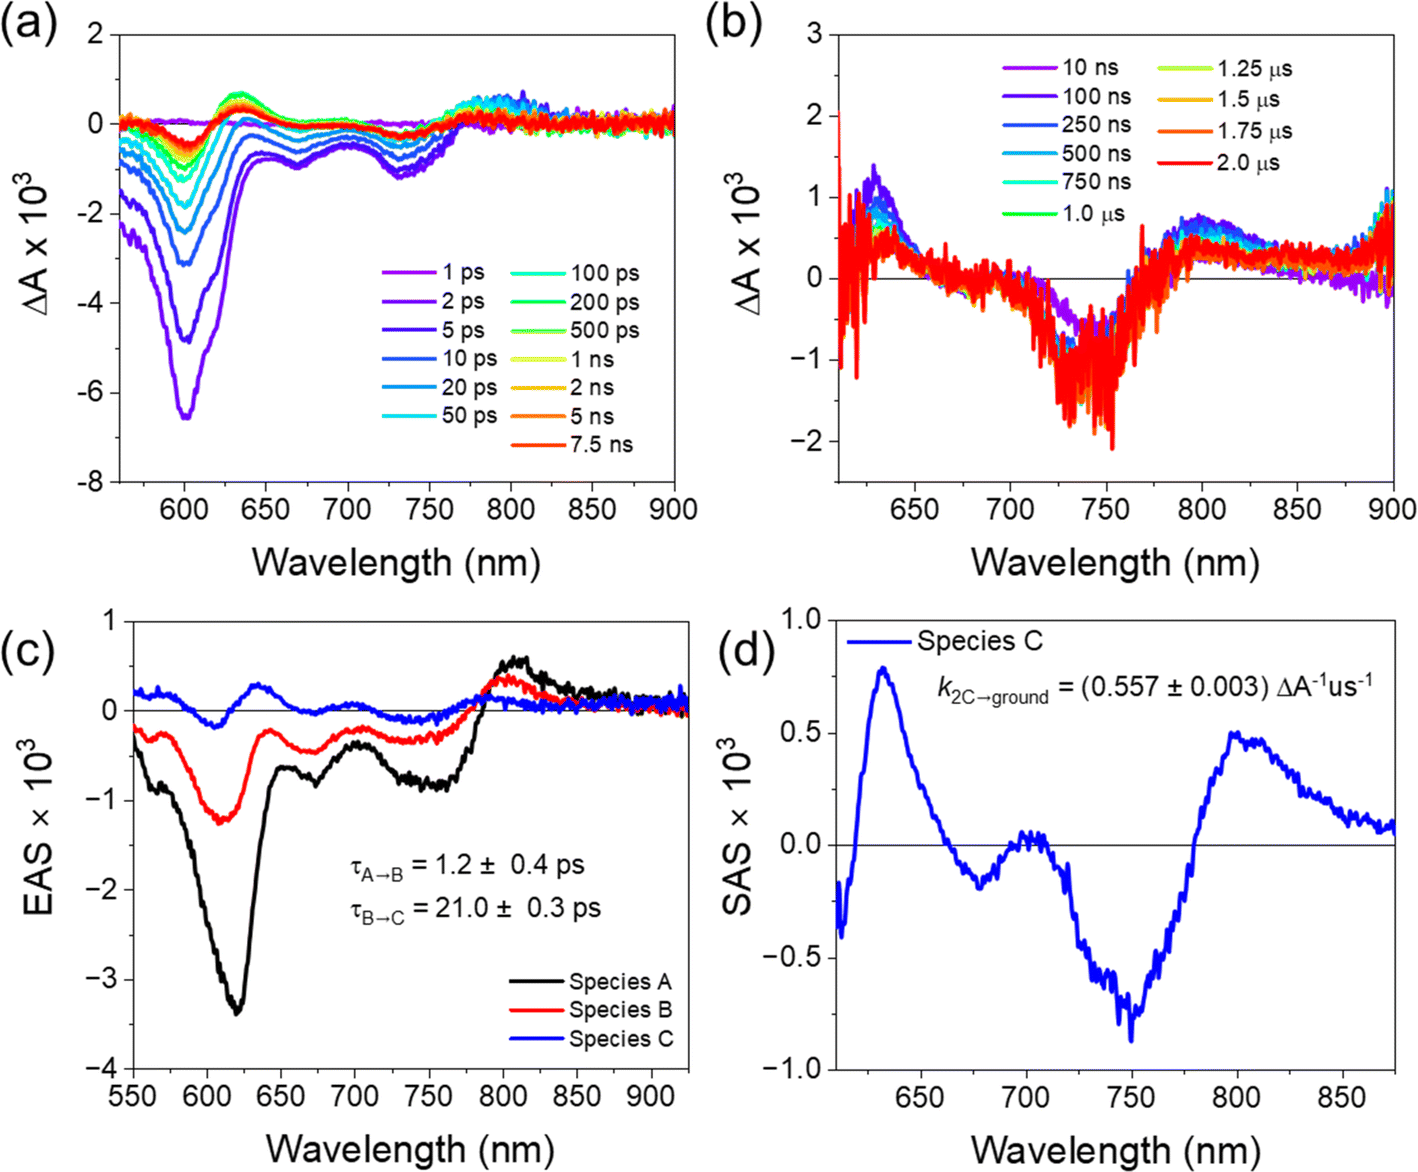 | ||
| Fig. 5 FsTAM spectra of (a) pyrPDI-tpPDI single crystal at 298 K, λex = 520 nm. (b) NsTAM spectra of pyrPDI-tpPDI single at 298 K, λex = 520 nm. (c) Evolution-associated spectra obtained from global fits to selected fsTAM wavelengths to a sequential A → B → C state kinetic model. Species A represents the vibrationally hot pyrPDI S1 state, B is the relaxed pyrPDI S1 separated state, and C is the pyrPDI˙+-tpPDI˙− state. (d) Species-associated spectra obtained from global fits to selected nsTAM wavelengths to a 2C → ground state kinetic model. | ||
A consequence of the intermolecular π–π stacking interactions within the single crystal is that there can be three CS events in addition to the synthetically installed intramolecular CS event. Symmetry-breaking charge separation can potentially occur between the intermolecular pairs of tpPDIs and pyrPDIs, as has been previously reported both in synthetic dimers and in monomers in the solid state,10 and CS can potentially occur between the intramolecular pyrPDI-tpPDI pair. These intermolecular π–π stacking interactions are much shorter (4.1 Å, 3.4 Å, and 5.1 Å) than the intramolecular distance (7.5 Å), therefore upon photoexcitation there is potential competition between four different charge separation pathways. The broadband TA results discussed above suggest that ultrafast energy transfer from tpPDI to pyrPDI will outcompete SB-CS between the tpPDI pairs.32 Also, the presence of the ∼750 nm bleach in the TAM data confirms that this state must involve pyrPDI. Similarly, the presence of the tpPDI˙− ESA rules out the possibility that this signal arises from SB-CS between pyrPDIs.
Two other pathways remain that can produce pyrPDI˙+-tpPDI˙− in competition: intra- and intermolecular charge transfer. The kinetic analysis of the toluene solution data, where the non-polar environment is most similar to that of the single crystal, showed a CS time of τ = 181 ps. However, the observed singlet excited-state lifetime in the single crystal is τ = 21 ps. If only intra- and intermolecular charge transfer processes are considered, then the true intermolecular charge transfer time is kinter = kobs − kintra = (21 ps)−1 − (181 ps)−1 = (24 ps)−1. Thus, intermolecular charge transfer dominates by a ratio of about 7.5:1, in keeping with the much closer donor/acceptor spacing in the crystal compared to that of the isolated cyclophane. Moreover, in addition to this the faster intermolecular CS rate, the pyrPDI-tpPDI single crystals also exhibit a very long-lived charge-separated state relative to what is observed in solution. This long-lived charge-separated state can be attributed to the intermolecular π–π stacking interactions seen in the single crystal structure. As discussed above in the single-crystal absorption spectrum, the electronic coupling afforded by the intermolecular π–π stacking interactions is relatively weak as a consequence of slip-stacking induced by the bulky phenoxy and pyrrolidine core substituents. This weak electronic coupling prevents the intermolecular π–π stacking interactions from being too strong and allows the initially separated charges to remain distant for a longer time. This in turn affords the opportunity for electron hopping from one cyclophane unit to the next. Moreover, hopping is not only restricted to the faster intermolecular CS excitons but can also occur after the slower intramolecular CS event, further extending the CS state lifetime. The charge transfer kinetics of pyrPDI-tpPDI are summarized in Fig. 6.
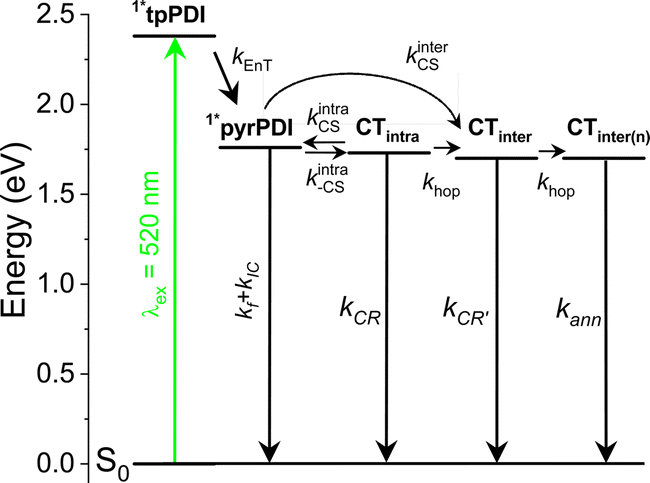 | ||
| Fig. 6 Jablonski diagram of pyrPDI-tpPDI single crystal at room temperature and the rate constants for energy transfer (EnT), intermolecular charge transfer (CS, inter), intramolecular charge transfer (CS, intra), charge hopping (hop), and CT annihilation (ann). | ||
Conclusions
Transient absorption measurements on pyrPDI-tpPDI in CH2Cl2 and toluene solution reveal a solvent-dependent electron transfer from the pyrPDI donor to the tpPDI acceptor, with charge separation occurring in 99% yield in polar CH2Cl2, and a reversible charge separation due to a pseudo-equilibrium between the S1 and CS states in nonpolar toluene. Single crystals of pyrPDI-tpPDI were analyzed by using X-ray diffraction and transient absorption microscopy. The crystal structure contains several types of intermolecular donor–acceptor interactions (pyrPDI–pyrPDI, tpPDI–tpPDI, and pyrPDI-tpPDI) in addition to the pre-installed intramolecular interaction. Following photoexcitation of the pyrPDI-tpPDI single crystal, the transient absorption data show 7.5 times increase in charge separation rate, which results from the intermolecular pyrPDI-tpPDI interactions. Moreover, the charge-separated state lives for more than 2 μs in these crystals as a consequence of the intermolecular π-stacks, which facilitate long distance electron migration resulting in a long charge recombination lifetime. These results demonstrate the utility of pre-organizing donor–acceptor structural motifs to elicit specific crystal morphologies that can lead to enhanced photogenerated charge carrier lifetimes for solar energy conversion.Data availability
Crystallographic data for 1 has been deposited at CCDC under 2342829 and can be obtained from http://www.ccdc.cam.ac.uk. All the experimental data are provided in the ESI.†Author contributions
M. L. W. grew the crystals, obtained the transient absorption microscopy data, and wrote the initial draft of the manuscript. A. F. C. synthesized the molecules. K. R. P. obtained the transient emission data. R. M. Y. edited the manuscript and analyzed the data. M. R. W. conceived the project, analyzed the data, and edited the manuscript.Conflicts of interest
There are no conflicts to declare.Acknowledgements
We would like to thank Aritra Mandal for his help with acquiring the broadband transient absorption data and Itai Schlesinger for his help in acquiring the fsTAM data. This work was supported by the US Department of Energy, Office of Science, Office of Basic Energy Sciences, under award no. DE-FG02-99ER14999 (M. R. W.). This work made use of the IMSERC MS and NMR facility at Northwestern University, which has received support from the Soft and Hybrid Nanotechnology Experimental (SHyNE) Resource (NSF ECCS-2025633), the State of Illinois, the International Institute for Nanotechnology (IIN) and Northwestern University.Notes and references
- Y. Huang, Z. Wang, Z. Chen and Q. Zhang, Angew. Chem., Int. Ed., 2019, 58, 9696–9711 CrossRef CAS PubMed.
- A. A. Dar and S. Rashid, CrystEngComm, 2021, 23, 8007–8026 RSC.
- Z. Wang and Q. Zhang, Asian J. Org. Chem., 2020, 9, 1252–1261 CrossRef CAS.
- H.-Y. Liu, Y.-C. Li and X.-D. Wang, CrystEngComm, 2023, 25, 3126–3141 RSC.
- S. Aitipamula, P. S. Chow and R. B. H. Tan, CrystEngComm, 2014, 16, 3451–3465 RSC.
- D. H. Arias, J. L. Ryerson, J. D. Cook, N. H. Damrauer and J. C. Johnson, Chem. Sci., 2016, 7, 1185–1191 RSC.
- Y. Geng, H.-B. Li, S.-X. Wu and Z.-M. Su, J. Mater. Chem., 2012, 22, 20840–20851 RSC.
- C. Kitamura, Chem. Rec., 2012, 12, 506–514 CrossRef CAS PubMed.
- G. B. Piland and C. J. Bardeen, J. Phys. Chem. Lett., 2015, 6, 1841–1846 CrossRef CAS PubMed.
- C. E. Ramirez, S. Chen, N. E. Powers-Riggs, I. Schlesinger, R. M. Young and M. R. Wasielewski, J. Am. Chem. Soc., 2020, 142, 18243–18250 CrossRef CAS PubMed.
- M. L. Williams, P. J. Brown, J. R. Palmer, R. M. Young and M. R. Wasielewski, J. Phys. Chem. C, 2024, 128, 1603–1611 CrossRef CAS.
- M. L. Williams, I. Schlesinger, R. M. Jacobberger and M. R. Wasielewski, J. Am. Chem. Soc., 2022, 144, 18607–18618 CrossRef CAS PubMed.
- M. Jiang, C. Zhen, S. Li, X. Zhang and W. Hu, Front. Chem., 2021, 9, 764628 CrossRef CAS PubMed.
- L. Sun, Y. Wang, F. Yang, X. Zhang and W. Hu, Adv. Mater., 2019, 31, 1902328 CrossRef PubMed.
- J. R. Palmer, M. L. Williams, R. M. Young, K. R. Peinkofer, B. T. Phelan, M. D. Krzyaniak and M. R. Wasielewski, J. Am. Chem. Soc., 2024, 146, 1089–1099 CrossRef CAS PubMed.
- K. Reichenbächer, H. I. Süss and J. Hulliger, Chem. Soc. Rev., 2005, 34, 22–30 RSC.
- J. M. Fisher, M. L. Williams, J. R. Palmer, N. E. Powers-Riggs, R. M. Young and M. R. Wasielewski, J. Am. Chem. Soc., 2024, 146, 9911–9919 CrossRef CAS PubMed.
- Y. Zhao and M. R. Wasielewski, Tetrahedron Lett., 1999, 40, 7047–7050 CrossRef CAS.
- A. S. Lukas, Y. Zhao, S. E. Miller and M. R. Wasielewski, J. Phys. Chem. B, 2002, 106, 1299–1306 CrossRef CAS.
- J. M. Giaimo, A. V. Gusev and M. R. Wasielewski, J. Am. Chem. Soc., 2002, 124, 8530–8531 CrossRef CAS PubMed.
- B. Rybtchinski, L. E. Sinks and M. R. Wasielewski, J. Am. Chem. Soc., 2004, 126, 12268–12269 CrossRef CAS PubMed.
- F. Würthner, C. R. Saha-Möller, B. Fimmel, S. Ogi, P. Leowanawat and D. Schmidt, Chem. Rev., 2016, 116, 962–1052 CrossRef PubMed.
- W. Kim, A. Nowak-Król, Y. Hong, F. Schlosser, F. Würthner and D. Kim, J. Phys. Chem. Lett., 2019, 10, 1919–1927 CrossRef CAS PubMed.
- M. Hecht and F. Würthner, Acc. Chem. Res., 2021, 54, 642–653 CrossRef CAS PubMed.
- A. Nowak-Król and F. Würthner, Org. Chem. Front., 2019, 6, 1272–1318 RSC.
- P. Spenst, R. M. Young, M. R. Wasielewski and F. Würthner, Chem. Sci., 2016, 7, 5428–5434 RSC.
- A. Weller, Z. Phys. Chem., 1982, 133, 93–99 CrossRef CAS.
- Y. Wu, R. M. Young, M. Frasconi, S. T. Schneebeli, P. Spenst, D. M. Gardner, K. E. Brown, F. Würthner, J. F. Stoddart and M. R. Wasielewski, J. Am. Chem. Soc., 2015, 137, 13236–13239 CrossRef CAS PubMed.
- A. F. Coleman, M. Chen, J. Zhou, J. Shin, Y. Wu, R. M. Young and M. R. Wasielewski, J. Phys. Chem. C, 2020, 124, 10408 CrossRef CAS.
- K. Nagarajan, A. R. Mallia, V. S. Reddy and M. Hariharan, J. Phys. Chem. C, 2016, 120, 8443–8450 CrossRef CAS.
- T. A. Barendt, W. K. Myers, S. P. Cornes, M. A. Lebedeva, K. Porfyrakis, I. Marques, V. Félix and P. D. Beer, J. Am. Chem. Soc., 2020, 142, 349–364 CrossRef CAS PubMed.
- C. Lin, T. Kim, J. D. Schultz, R. M. Young and M. R. Wasielewski, Nat. Chem., 2022, 14, 786–793 CrossRef CAS PubMed.
Footnotes |
| † Electronic supplementary information (ESI) available: Describes the synthesis and characterization information, crystallographic data, additional steady-state and transient absorption and time-resolved fluorescence data and kinetic analysis. CCDC 2342829. For ESI and crystallographic data in CIF or other electronic format see DOI: https://doi.org/10.1039/d4sc03359k |
| ‡ M. L. W. and A. F. C. contributed equally to this work. |
| This journal is © The Royal Society of Chemistry 2024 |