
 Open Access Article
 This Open Access Article is licensed under a Creative Commons Attribution-Non Commercial 3.0 Unported Licence
Resonance plasmonic coupling: selective enhancement of band edge emission over trap state emission of CdSe quantum dots†
Livin
Paul
a,
Elizabeth Mariam
Thomas
a,
Akshaya
Chemmangat
a,
Stephen K.
Gray
*b and
K. George
Thomas
 *a
*a
aSchool of Chemistry, Indian Institute of Science Education and Research Thiruvananthapuram (IISER TVM), Vithura, Thiruvananthapuram, 695551, India. E-mail: kgt@iisertvm.ac.in
bCenter for Nanoscale Materials, Argonne National Laboratory, Lemont, Illinois 60439, USA. E-mail: gray@anl.gov
First published on 11th November 2024
Abstract
The photoluminescence properties of quantum dots (QDs) are often enhanced by eliminating surface trap states through chemical methods. Alternatively, a physical approach is presented here for improving photoluminescence purity in QDs by employing frequency-specific plasmon resonance coupling. Emitter-bound plasmonic hybrids are designed by electrostatically binding negatively charged QDs in water to positively charged gold nanoparticles having a thin polymer coating. Herein, two types of QDs are used: (i) bare CdSe, which exhibits both band edge and trap state emission, and (ii) CdSe overcoated with a ZnS shell (CdSe/ZnS) devoid of trap state emission. Tuning the extinction spectrum of the plasmonic system to match the band edge emission of CdSe enables the selective enhancement of band edge emission over trap state emission. Excellent match in the extinction spectrum of the gold nanoparticle with both, experimentally calculated photoluminescence enhancement factor and theoretically calculated radiative rate enhancement signifies the role of frequency-specific plasmon resonance coupling. Plasmon-coupled photoluminescence of CdSe/ZnS is further investigated by varying the number density of emitter on the surface of plasmonic nanoparticle. An enhancement in the photoluminescence is observed at a lower emitter density of CdSe/ZnS and the photoluminescence enhancement factor closely follows the plasmon resonance. However, photoluminescence quenching occurs with an increase in CdSe/ZnS due to plasmon-assisted nonradiative energy transfer between nearby QDs, as indicated by a red shift in the PL maximum. These studies establish that resonance plasmonic coupling is a convenient physical strategy for tuning the intrinsic photoluminescence properties of QDs for various optoelectronic applications.
1. Introduction
Applications of binary semiconductor quantum dots (QDs) in optoelectronics are limited by their low quantum efficiency and high intermittency in photoluminescence (PL) due to the presence of mid-gap states that trap the photoexcited charge carriers.1–5 As a result, undesirable trap state mediated PL is observed at longer wavelengths alongside the narrow band edge PL.6,7 The competitive pathways of charge carrier relaxation to trap states in QDs are often tackled by adopting various chemical methods, i.e., passivating their surface with small ligands8–11 or overcoating with large band gap semiconductors.12–15 The above-mentioned methods focus on eliminating the trap states in QDs by modifying their surface properties. However, altering the PL landscape of QDs by physical methods, such as by changing the photonic environment, is relatively less explored.16,17 Indeed, the spontaneous PL of an emitter is not an inherent property; it originates due to the interaction between the emitter and its photonic or local electromagnetic environment.18–20 Specifically, the decay rate of a dipole emitter depends on the number of available electromagnetic modes in space in which it emits. It depends on the local density of optical states (LDOS), essentially the number of electromagnetic modes available for the emitter per unit volume and per unit frequency at a given point in space.21 LDOS can be further enhanced in a frequency-specific manner using on-resonance cavities of photonic crystals or plasmonic metal nanoparticles, thereby increasing the decay rate at the resonant frequency.20–23Plasmons are collective oscillations of conduction electrons upon photoexcitation in metal nanoparticles.24 Emitter-bound plasmonic nanostructures offer outstanding possibilities by confining light to very small dimensions, thereby modulating the emission dynamics of molecules or semiconductor QDs.25–36 Recent experimental and theoretical studies have shown localized surface plasmon-assisted enhancement in numerous processes: (i) spontaneous emission,37–41 (ii) Förster resonance energy transfer in donor–acceptor systems,42–46 (iii) stability and brightness of light emitting devices,47 and (iv) up-conversion luminescence of nanoparticles.48 In addition, single-particle level investigations have also been reported for designing emitter-bound plasmonic nanostructures with enhanced emission,49,50 and suppressed blinking.51–53 A preferential plasmon-mediated enhancement of band edge emission of QDs, without chemical modifications, is more advantageous for real-world applications. Herein, we present an approach for the selective enhancement of band edge emission of CdSe QDs over the less favored trap state emission by resonance plasmonic coupling, thus offering a better color purity. The PL enhancement factor of CdSe QDs in the presence of a plasmonic field in the spectral window of 475–780 nm is determined, and the results are compared with the theoretically calculated radiative rate enhancement. The observed trend of wavelength-specific enhancement in the spontaneous PL of QDs assisted by plasmons is further validated with CdSe QDs overcoated with a ZnS shell (henceforth denoted as CdSe/ZnS) devoid of trap state emission. PL enhancement observed at a lower number density of CdSe/ZnS QDs in the presence of plasmonic field undergoes a transition to quenching regime as the number of emitters increases.
2. Experimental methods
2.1 Materials
All the chemicals are used as obtained and the details are presented in ESI.† All the photophysical studies are carried out in double-distilled water.2.2 Synthesis of QDs
Two types of CdSe-based QDs are used in this study for plasmon resonance coupling: (i) CdSe QDs capped with mercaptosuccinic acid (MSA) in water, which possesses distinct trap state emission along with the band edge emission, and (ii) CdSe QDs overcoated with ZnS shell (CdSe/ZnS) wherein surface defects of CdSe QDs are passivated by overcoating with a large band gap semiconductor, ZnS. | ||
| Fig. 1 (A and B) PL spectra of (A) MSA capped CdSe QDs and (B) CdSe/ZnS QDs. (C) Extinction spectrum of PAH-coated gold nanoparticles (AuNPs). Note: the spectral overlap of the three systems is shown by blue and green lines. (D and E) TEM images of AuNPs at different magnifications. The inset of (E) shows the magnified image wherein the PAH coating is visible. (F and G) TEM images of (F) MSA-capped CdSe QDs, and (G) CdSe/ZnS QDs. The magnified image of bare CdSe QDs is shown as an inset of (F). (H and I) The size histograms of (H) AuNPs and (I) PAH shell thickness around the Au nanoparticle obtained from corresponding TEM images. Note: four measurements of PAH thickness are taken from each AuNPs. (J) Zeta potential (ζ) distribution and (K) extinction spectra of Au nanoparticles before (blue trace) and after PAH coating (red trace). | ||
2.3 Synthesis of plasmonic nanoparticles
2.4 Synthesis of silica nanoparticles
Silica nanoparticles (SiO2 NPs) are synthesized using a modified Stöber condensation reaction.41 Tetraethyl orthosilicate (TEOS) is used as the precursor for the synthesis. In a typical synthesis, TEOS (600 μL) is added dropwise to the mixture (1![[thin space (1/6-em)]](https://www.rsc.org/images/entities/char_2009.gif) :9) of water and isopropanol (54 mL; contains 1 mL of 30% NH4OH), under vigorous stirring for 2 h. The reaction mixture is then centrifuged using 6500 rpm for 20 min. The residue is purified by repeated washing with water. The purified SiO2 NPs are stored in 5 mL of water for further studies.
:9) of water and isopropanol (54 mL; contains 1 mL of 30% NH4OH), under vigorous stirring for 2 h. The reaction mixture is then centrifuged using 6500 rpm for 20 min. The residue is purified by repeated washing with water. The purified SiO2 NPs are stored in 5 mL of water for further studies.
The SiO2 NPs possess a negative surface charge. Coating with PAH transforms the surface charge to positive which facilitates the binding of negatively charged CdSe QDs on its surface. The PAH coating is achieved by following the procedure as follows. SiO2 NPs (3 mL) from the stock are slowly added to an aqueous solution (45 mL) of PAH (2 mg mL−1) containing NaCl (2 mM) with vigorous stirring. After 3 h, the reaction mixture is centrifuged at 6000 rpm for 30 min, and the residue is suspended in water for further studies. Details of the characterization are presented in ESI, Sections 5 and 6.†
2.5 QD-bound plasmonic nanohybrids
QD-bound plasmonic systems, referred henceforth as hybrid systems, are prepared in 3 mL of water in a quartz cuvette having path length of 1 cm by adding negatively charged QDs to plasmonic nanoparticles which are positively charged (PAH-coated Au nanoparticles).2.6 Photophysical studies
Absorption spectra are recorded on Shimadzu UV-3600 UV-vis-NIR spectrophotometer and PL spectra on Horiba Jobin Yvon-Fluorolog 3 spectrofluorimeter. The hybrid systems consisting of CdSe QDs and CdSe/ZnS QDs are excited at 400 and 375 nm, respectively. The emitted light is collected at 90° from the excitation source. Details of primary and secondary inner filter effect corrections are provided in the Results and discussion section.3. Results and discussion
To demonstrate the plasmon-assisted wavelength-specific enhancement in PL, CdSe QDs and CdSe/ZnS QDs are chosen as emitters and gold nanoparticles as the plasmonic platform (Fig. 1A–C). The morphological characterization of Au nanoparticles and QDs are presented in Fig. 1D, E and 1F, G, respectively. The size of QDs is obtained using the empirical relation by Mulvaney and co-workers56 and found to be 2.22 and 2.72 nm for CdSe and CdSe/ZnS QDs, respectively. The band edge emission of CdSe QDs in the spectral window of 475–550 nm stems from the direct exciton recombination, whereas the trap state emission above 550 nm possesses high intensity due to dominating mid-gap states (Fig. 1A).6,58,59 The quantum yield of CdSe QDs in water is estimated using absolute and relative methods, in the spectral window of 475–780 nm, are found to be the same (ϕPL = 0.09 ± 0.001). Details are presented in ESI, Section 2.†The rationale behind choosing CdSe QDs with low PL quantum yield is to explore the extent of radiative rate enhancement in the presence of the plasmonic field.60 The plasmon-enhanced emission of an emitter has contributions from both the excitation and emission rate enhancement.61–63 Some of the factors that contribute to plasmon-enhanced emission are (i) the spectral overlap between the absorption/emission of the emitter with the plasmon resonance,64,65 (ii) the spatial distance of the emitter from the plasmonic surface,66,67 (iii) the orientation of the emitter's transition dipole on the metal nanoparticle,51,68 and (iv) the size of the plasmonic nanomaterial.69,70 Earlier we have demonstrated that the emitter–emitter interaction in the plasmonic field reduces PL enhancement through various nonradiative channels.41 Drawing lessons from these studies, the number of emitters on a plasmonic surface has been lowered to 2–3 (vide infra).
One of the objectives of the investigation is to develop methodologies for the preferential enhancement of the band edge emission of CdSe QDs compared to its trap state emission. The excitation rate enhancement increases the emission of the emitter in the entire emission wavelengths, which results in the enhancement of both band edge and trap state emission of CdSe QDs. Hence, for the selective enhancement in the band edge emission, it is necessary to focus on the emission rate enhancement. This is achieved through an effective spectral overlap between the extinction spectrum of the plasmonic material and the desired emission window of the emitter. Au nanoparticles with a diameter of ∼31 nm, resonating at 527 nm, are utilized here as the plasmonic platform (Fig. 1C–E). This permits an on-resonance coupling of plasmon band with the band edge emission of CdSe QDs, whereas the trap state emission remains in an off-resonance condition (Fig. 1A, C and Fig. 2B, C). An electrostatic approach is adopted here to bind the emitters on the plasmonic platform. As synthesized QDs possess a negative surface charge. To facilitate the electrostatic binding of negatively charged QDs on plasmonic platform, citrate-capped Au nanoparticles are overcoated with poly(allylamine hydrochloride) (PAH), a positively charged polymer. Henceforth, the PAH-coated Au nanoparticles are referred to as AuNPs. We have earlier observed the maximum PL enhancement for CdSe QDs when placed at a distance of ∼1.35 nm away from the AuNPs and the enhancement factor decreased with an increase in distance between them.41 Here, PAH shell is used as an effective spacer preventing direct interaction between the AuNPs and the QDs and keeping an optimum distance. TEM micrograph in higher magnification is presented in the inset of Fig. 1E and S2,† confirms the presence of a thin layer of PAH (∼1.3 nm) around the Au nanoparticle and the over-coating is further established using the zeta potential (ζ) studies (Fig. 1J). Upon overcoating with the polymer, ζ values of Au nanoparticles varied from −18 mV to +28 mV. It can be seen from Fig. 1K that the extinction spectral characteristics of Au nanoparticles remained unaffected upon overcoating with PAH, eliminating the possibility of aggregation.
 | ||
| Fig. 2 (A) Schematic representation of various steps involved in the design of QD-bound plasmonic nanohybrids. Note: the purple, grey, and green colors represent Au nanoparticles, PAH, and QDs, respectively. (B) Absorption (blue trace) and PL (red trace) spectra of CdSe QDs, and (C) extinction spectrum of AuNPs. Note: PL spectrum is collected by exciting the sample at 400 nm. The blue strip in the stacked plot of (B) and (C) represents the overlap between the PL spectrum of CdSe QDs and the extinction spectrum of AuNPs. (D) Extinction spectrum of AuNPs before (black trace) and after (red trace) the addition of CdSe QDs. Note that the molar extinction coefficient of AuNPs is three orders of magnitude higher than CdSe QDs (ESI†), and hence, the spectral changes on addition of QDs are negligible. (E) Zeta potential (ζ) distribution of CdSe QDs (black trace), AuNPs (red trace), and QDs bound on AuNPs (blue trace). | ||
3.1 Characterization of QDs bound AuNP nanohybrids
The hybrid systems are obtained by adding CdSe QDs (452 pM) to a solution of AuNPs (207 pM) in water, and a schematic representation is shown in Fig. 2A. MSA capped CdSe QDs possess a negative surface charge (zeta potential, ζ = −30.9 mV). The binding of QDs is established by the reduction of ζ value of AuNPs from +28 mV to +24 mV (Fig. 2E). The high ζ value of CdSe-bound plasmonic nanohybrid (+24 mV) corroborates that all the added CdSe QDs are bound on the AuNPs and also confirms colloidal stability. In addition, the extinction spectrum of the hybrid system was monitored continuously for 8 h at intervals of 30 min, and the spectral profile remain unchanged over time. The optical density at the extinction maximum (527 nm) remains more or less unaltered (see ESI, Section 7†), which reaffirms the colloidal stability of the hybrid system. Here we assume that the electrostatically bound CdSe QDs on the surface of AuNPs are positioned in an equally spaced manner due to the repulsive interactions between them. This assumption is based on the famous Thomson problem71 which describes a spatial configuration in which N like-charged species on a sphere arrange themselves to minimize the total electrostatic energy. Based on the molar equivalents of the components used, it is estimated that two to three CdSe QDs are bound on the surface of AuNPs, assuming a uniform distribution. The extinction spectrum of the hybrid system overlaps well with that of the AuNPs, ruling out the possibility of aggregation during the electrostatic binding (Fig. 2D).The TEM images of QD bound on AuNPs are presented in Fig. 3A. The bound QD on the surface of AuNPs is marked by the red circle wherein the distinct CdSe lattice planes corresponding to the (111) plane with a d-spacing of 0.35 nm is visible (inset of Fig. 3A). The hybrid system is also characterized using high-angle annular dark-field imaging (HAADF) with the scanning transmission electron microscopy (STEM) mode. This technique provides an annular dark field image of the material, which is highly sensitive to the variation in the atomic number (Z) of elements. Here, the elements with a high Z value scatter more electrons at a higher angle and produce a brighter region in the HAADF-STEM image. Au has a higher atomic number than Cd and Se; hence, the former shows brighter images.
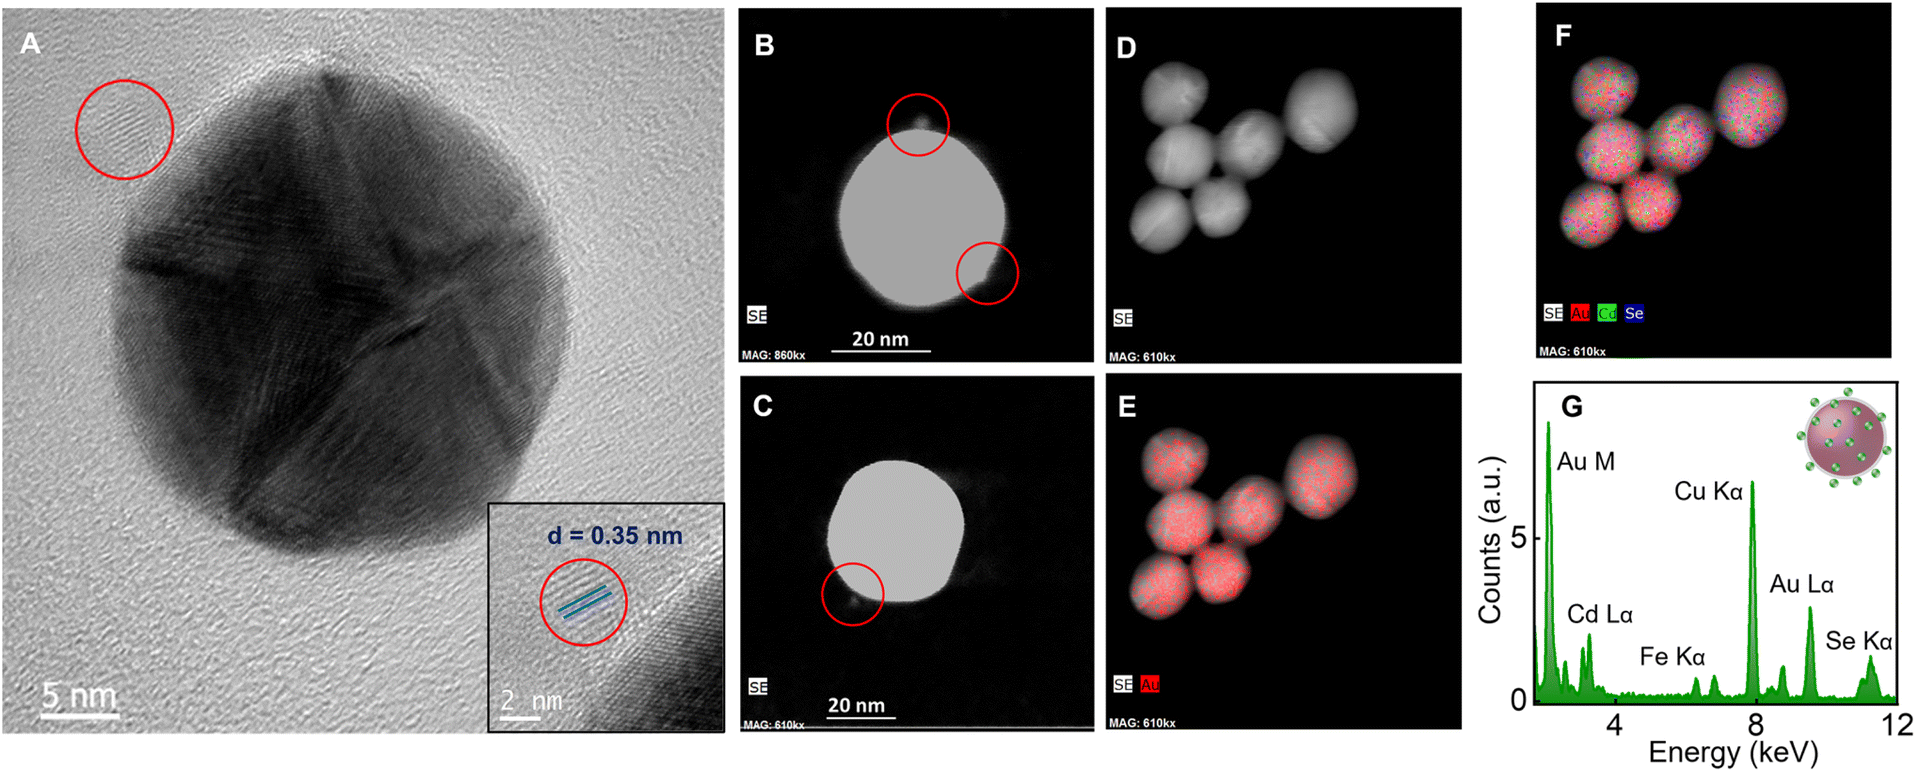 | ||
| Fig. 3 (A) TEM image of CdSe QDs (452 pM) bound on the surface of AuNPs (207 pM). Based on the molar equivalents, 2–3 CdSe QDs are bound on the surface of AuNPs. The inset of (A) shows the magnified section of the image presenting the CdSe (111) planes with a d-spacing of 0.35 nm. (B and C) HAADF-STEM image of CdSe QDs (452 pM) bound on the surface of AuNPs (207 pM). Note: the bound QDs are marked by red circles in (A)–(C). (D) HAADF-STEM image of CdSe QDs (45 nM) bound on the surface of AuNPs (207 pM) and the corresponding STEM-EDX map of (E) Au and (F) Cd, Se, and Au elements. Note: Au, Cd, and Se elements are represented by red, green, and blue colors, respectively. (G) TEM-EDX spectrum corresponding to CdSe QDs bound on AuNPs obtained from (D). | ||
It is evident from Fig. 3B and C that the large-sized Au nanoparticles appear as the bright spot while the smaller-sized bound QDs appear as satellites (marked in red circles) with low intensity. STEM-EDX mapping of the hybrid system, after binding QDs on AuNPs, is carried out to confirm the electrostatic binding of QDs on the surface of AuNPs. A high concentration of CdSe QDs (∼100 times excess) is used in Fig. 3D–F for mapping studies to make Cd and Se color coding more visible. Upon mapping the hybrid systems, Cd and Se elements corresponding to CdSe QDs on the surface of AuNPs are identified. The analysis of the TEM-EDX spectrum (Fig. 3G) of the CdSe-bound plasmonic nanohybrids shows peaks corresponding to elements, Au (M – 2.12 keV and Lα – 9.71 keV), Cd (Lα – 3.13 keV) and Se (Kα – 11.2 keV), confirming the presence of CdSe QDs on the surface of AuNPs.
3.2 Photoluminescence of CdSe QDs bound on AuNPs
The effect of the plasmonic field on the PL properties of the CdSe QDs is probed in the presence of AuNPs using steady-state and time-resolved measurements. The CdSe QDs in the absence and presence of AuNPs are excited at 400 nm, wherein both the components possess absorption (Fig. 2B and C). From the top panel of Fig. 4A, it is evident that the band edge and trap state emission maxima of CdSe QDs (green and red-shaded regions, respectively) possess the same PL intensity. The concentrations of AuNPs and CdSe QDs used herein are 0.2 nM and 0.45 nM, respectively; however, the molar extinction coefficients (ε) of AuNPs (ε527nm = 3.92 × 10⁹ M−1 cm−1)72 is three orders of magnitude higher than that of CdSe QDs (ε481nm = 1.81 × 10⁶ M−1 cm−1).73 Details are presented in ESI, Section 8.† The large difference in their ε results in a reduction in the intensity of the excitation beam due to the absorption of incident light by Au nanoparticles (primary inner filter effect; IFE1). Similarly, the reduction in the intensity of emitted light due to reabsorption by Au nanoparticles also occurs, referred as secondary inner filter effect (IFE2). AuNPs scavenge more light from the band edge emission due to the selective spectral overlap between the emission spectrum of the QDs with the extinction spectrum of the AuNPs. Hence, to quantify the emission of QDs in the presence of the plasmonic field, it is essential to correct the PL spectrum for primary and secondary inner filter effects.41,74–77 The spectral profile of the IFE correction factor is shown in Fig. S6B,† and the details are provided in ESI, Section 8.†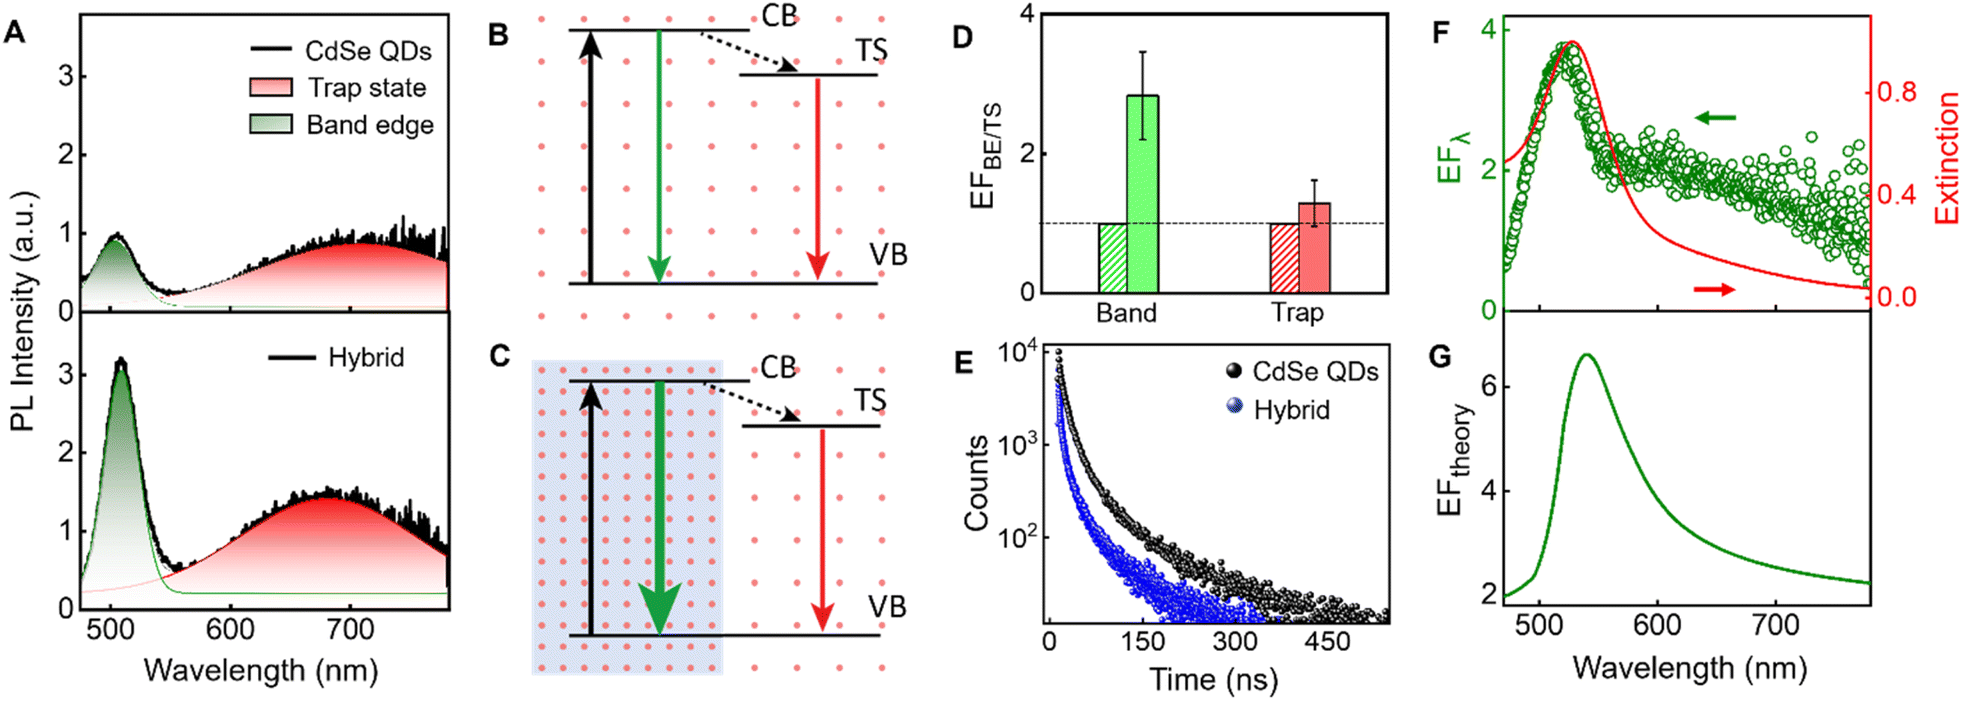 | ||
| Fig. 4 Photophysics of CdSe QDs, which possess band edge and trap state emission, in the presence of the plasmonic field. (A) The PL spectrum of CdSe QDs (452 pM) is at the top. The corresponding PL spectrum in the presence of AuNPs (207 pM), after inner filter and surface effect corrections in the bottom. PL intensity scales (y-axis) are kept the same for comparison. Note: samples are excited at 400 nm, and inner filter and surface effect corrections are made. Green and red shaded regions represent the deconvoluted band edge and trap state emission, respectively. (B and C) Schematic representation of the available density of optical states (DOS) of CdSe QDs in the absence (B) and presence (C) of the plasmonic field. The three-state model of QDs with valence band, conduction band, and trap state energy levels are represented by VB, CB, and TS, respectively and various nonradiative channels are not indicated. The arrows denote the excitation (solid black), nonradiative relaxation to trap state (dotted black), and band edge emission and trap state emission (green and red, respectively). The red dot and blue shaded region represent the DOS and the plasmon resonance region, respectively. By placing an emitter near plasmonic nanoparticles, inhomogeneity in the photonic environment is achieved, which alters the available DOS. (D) Bar diagram showing the enhancement factor (EF) for band edge (green) and trap state (red) emission comparing with the initial intensity of band edge (green strips) and trap state (red strips) emission of QDs, respectively. Note: EFBE/TS is the ratio of area under the curve between the band edge (or trap state) emission in the presence and absence of plasmonic nanoparticles. (E) PL decay profiles of CdSe QDs in the absence (τavg = 35.5 ns; black spheres) and presence of AuNPs (τavg = 20.7 ns; blue spheres). (F) Experimental PL enhancement factor (EFλ) of CdSe QDs bound on AuNPs in the spectral window of 475–780 nm (green circles), plotted together with the extinction spectrum of AuNPs (red trace) and compared with the (G) theoretically calculated radiative rate enhancement factor (EFtheory) of CdSe QDs bound on AuNPs. | ||
Furthermore, the PL intensity of CdSe QDs when bound on AuNPs, is influenced by surface effects (SE) due to the changes in the dielectric environment. To quantify the change in PL, due to the binding of QDs on the surface of AuNPs, a control experiment is carried out using PAH-coated silica nanoparticles (SiO2 NPs) wherein plasmonic effects are absent. The PL spectrum of CdSe QDs shows an average of 2.3-fold enhancement in PL intensity, irrespective of wavelength, upon binding on the SiO2 NPs (ESI; Section 9†). The SE correction factor is dependent on the nature of the emitter and hence, different in each system. To consider the inner filter effects and surface effects in action, the PL intensity of the hybrid system is corrected in the entire wavelength range using eqn (1),
| Icor = (I × IFE)/SE, | (1) |
The PL spectrum of the QDs in the presence of AuNPs after IFE and SE corrections are presented in the lower panel of Fig. 4A. It is obvious from Fig. 4A that on selective coupling with the plasmonic field of AuNPs, the band edge emission of CdSe QDs shows a higher enhancement than the trap state emission. These results are in agreement with the earlier reports on plasmon-emitter interactions which resulted in the modulation of the fluorescence spectral profile of the organic emitters.16,22,78 Here, we demonstrate strategies to modify the PL landscape of QDs through selective plasmonic resonance coupling. Specifically, the plasmonic field enhances the band edge emission of QDs through on-resonance coupling more effectively than the trap-state emission which is in off-resonance. In this experimental condition, a noticeable shift in the PL maximum (λmax) is not observed in hybrid system with AuNPs having CdSe QDs in the ratio of 1:3 when compared with bare CdSe QDs, thus ruling out the possibility of the energy transfer between the adjacent QDs.79–81 However, the situation is different when the number of QDs on the surface of AuNPs increases (vide infra).
3.3 Selective plasmon coupled PL enhancement
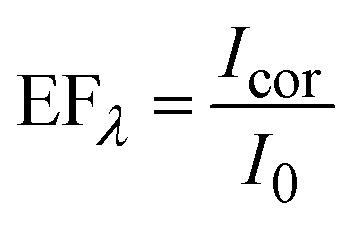
The PL enhancement factor (EF) of CdSe QDs in the presence of the plasmonic field is estimated by adopting two methods (Fig. 4). In the first case, EF is estimated by taking the intensity at each wavelength (EFλ), in the entire spectral window of 475–780 nm and the spectrum is plotted (Fig. 4F). In the area-based method, the PL spectrum in the absence and presence of AuNPs is deconvoluted into two separate bands corresponding to band edge and trap state emission, and the area under individual bands is estimated (Fig. 4A). The EF of band edge (EFBE) and trap state (EFTS) emission are obtained separately by comparing the area of the band edge (as well as trap state) in the presence and absence of plasmonic field (Fig. 4D). Under the influence of the plasmonic field, we observe a significant enhancement in the band edge emission (2.8 times) compared to the trap state emission (1.3 times). Analysing these results, it is evident that the selective enhancement of band edge emission over trap state emission is due to the resonance plasmonic coupling. Indeed, plasmonic nanoparticles can act as an optical nanoantenna to concentrate light into a nanoscale volume around the nanostructures, leading to an enhanced local electromagnetic field.82–84 The plasmon-enhanced local electric field around the metal nanostructure will increase the excitation rate of the emitter since the excitation rate (γexc) ∝ |μ·E|2, where μ and E represent the transition dipole moment, and the local electric field, respectively.61 This excitation enhancement is responsible for the small increase in the trap state emission due to the overlap between the absorption spectrum of the emitter and the extinction spectrum of the AuNPs at the excitation wavelength (Fig. 2B and C). However, the significant enhancement in the band edge emission is attributed to radiative rate enhancement along with the small excitation enhancement. Fig. 4B represents the schematic illustration of the band edge and trap state emission of QDs in a homogeneous photonic environment. The arrows in Fig. 4B and C correspond to excitation (black), and PL from the band and trap states (green and red, respectively). In the presence of the plasmonic nanoparticle, due to the resonance condition, an inhomogeneity in the photonic environment is created (Fig. 4C). This increased LDOS, available to QDs in a frequency-specific manner, is responsible for the selective enhancement of PL in the band edge. The enhanced emission from the band edge over the trap state is represented by a thick green-colored arrow in Fig. 4C. Factors other than the LDOS can influence PL, such as quenching due to nonradiative energy transfer from the emitter into the nanoparticle.18,85–87 However, we observe an effective enhancement in band edge emission over the trap state emission, overriding the contributions of various processes that result in PL quenching.The enhancement factor at a specific wavelength (EFλ) is obtained by estimating the ratio of the PL intensity in the presence (Icor) and absence (I0) of the plasmonic field (eqn (2)), in the entire spectral range, at an interval of 0.5 nm and constructing the spectrum (Fig. 4F).
 | (2) |
Interestingly, the wavelength-by-wavelength plot of EFλ displayed a distinct peak at the band edge emission region compared to the trap state emission region (Fig. 4F). The EFλ profile, represented by the green open circles in Fig. 4F, displayed a peak maximum at 527 nm. Notably, the EFλ spectrum closely matches with the extinction spectral profile of the AuNPs employed in this investigation, which shows a peak at 527 nm (red spectrum in Fig. 4F), rather than the band edge emission maximum of CdSe QDs at 506 nm (Fig. 1A and C). This result again implies that selective PL enhancement is due to the resonance plasmonic coupling. To verify the consistency of the observations, an additional set of experiment is conducted and similar results are observed, confirming wavelength-specific enhancement in the PL spectrum of CdSe QDs by plasmonic coupling. The details are provided in the ESI, Section 10 and 11.† The overall enhancement factor, EFλ, has contributions from the excitation and emission rate enhancement. Their individual contributions are calculated and presented in ESI, Section 12.†
To obtain a theoretical insight into the results, we calculated the radiative rate enhancement of a point dipole placed at the approximate center of the QDs from Au nanoparticle. The trend in the experimentally calculated EFλ spectrum also parallels to the classical electrodynamics calculation of the radiative rate enhancement shown in Fig. 4G. Thus, the theoretical studies also confirm the selective enhancement of band edge emission rather than the trap state emission. Upon plasmonic coupling, the radiative rate of the QDs enhances mainly in the on-resonance band edge emission rather than the off-resonance trap state emission. Details of theoretical calculations are similar to those reported earlier by our group.41 This trend is attributed to the frequency-specific enhancement in LDOS of the emitter coupled to plasmon resonance, resulting in an enhanced radiative rate at the resonance frequency and hence altering the spontaneous emission of the emitter. However, we find that the simplest approaches for accounting for both radiative and nonradiative contributions85 are not appropriate for the present case, possibly owing to the simplicity of the assumed classical point dipole approximations for the emitter and surface charge effects that alter the nature of the plasmon/emitter interactions.
The PL lifetime of CdSe QDs in the absence and presence of AuNPs are measured at 506 nm (excited at 375 nm), using time-correlated single photon counting (TCSPC) to investigate the modification in spontaneous emission rate. The PL decay curve of the CdSe QDs is fitted using the triexponential function, having the lifetime components of 4.58, 20.01, and 98.75 ns (ESI, Section 13†), with an intensity averaged lifetime (τavg) of 35.5 ns. The τavg of QDs remains unaffected (31.0 ns) when bound to PAH-coated SiO2 NPs, the blank substrate devoid of the plasmonic field. However, τavg reduces to 20.7 ns when the CdSe QDs are bound on the AuNPs (Fig. 4E) along with the reduction of all PL decay components (1.15, 8.39, and 42.16 ns). The influence of plasmonic field on various recombination channels is presented in Table S1.† The decrease in the PL lifetime further indicates a strong LDOS dependency on the excited state, thus playing a dominant role in radiative rate enhancement over various nonradiative channels.
3.4 Plasmon coupled PL enhancement vs. energy transfer
Further, we have investigated plasmon coupled PL of CdSe QDs which are devoid of trap state emission by varying its number density. CdSe is overcoated with a wide band gap semiconductor, ZnS, that eliminates the possibility of dangling bonds and other surface defects. CdSe/ZnS QDs possess a PL maximum at 541 nm with ϕPL of 0.11 ± 0.02 which overlaps well with the extinction spectrum of the AuNPs (Fig. 1B and C). Compared to CdSe QDs, the PL spectral maximum of CdSe/ZnS QDs is slightly red-shifted from the extinction spectrum of AuNPs.Using the electrostatic binding method described in the previous section, the hybrid systems are prepared by adding negatively charged CdSe/ZnS QDs to positively charged AuNPs (340 pM) by varying the number density of QDs. Two concentrations of QDs (3.72 nM and 38.0 nM) are employed for the studies and their binding causes a decrease in the ζ potential of AuNPs (+44 mV). Nevertheless, the ζ potential remained sufficiently high: +40 mV and +32 mV upon the addition of 3.72 nM and 38.0 nM of CdSe/ZnS QDs, respectively (Fig. S12B and 13B, ESI†). These results validate the effective binding of added CdSe QDs on the surface of AuNPs. Based on molar equivalents, we estimated the number density of QDs on AuNPs as ∼10 and ∼100 on the addition of 3.72 nM, and 38 nM of CdSe/ZnS QDs, respectively.
The extinction spectral profile of the AuNPs is retained after the addition of QDs in both cases, ruling out the possibility of aggregation during the electrostatic binding (Fig. 5C and D). These results confirm the colloidal stability of the hybrid system even at a high concentration of QDs. The PL spectrum of CdSe/ZnS QDs in the absence and presence of AuNPs is collected by exciting the sample at 375 nm, wherein both the components possess absorption. After correcting for IFE and SE, the area- and intensity-based enhancement factors for hybrid systems containing ∼10 and ∼100 CdSe/ZnS QDs are calculated. Notably the PL intensity of hybrid system is dependent on the number density of CdSe/ZnS QDs and a schematic representation is presented in Fig. 5A and B. These aspects are discussed below.
 | ||
| Fig. 5 Photophysics of CdSe/ZnS QDs bound on AuNPs at lower and higher number density. (A and B) Schematic representation of QDs (green color) bound on the surface of PAH (grey color) coated gold nanoparticle (purple color) keeping the ratio between the two components, AuNPs:CdSe/ZnS QDs, as (A) ∼1:10 and (B) ∼1:100. Note: the interaction between nearby QDs in system with higher number density is shown by the red-colored arrow. (C and D) Extinction spectra of AuNPs in black trace and hybrid, AuNPs:CdSe/ZnS QDs in red trace: (C) ∼1:10 and (D) ∼1:100. (E and F) PL spectra of CdSe/ZnS QDs in blue trace and hybrid, AuNPs:CdSe/ZnS QDs in red trace: (E) ∼1:10 and (F) ∼1:100. (G) Experimental PL enhancement factor (EFλ) of the hybrid, (AuNPs:CdSe/ZnS QDs, ∼1:10) in the spectral window of 450–675 nm in red spheres, plotted together with the extinction spectrum of AuNPs in black trace. (H) Bar diagram showing the enhancement factor (EFBE) of the hybrids, AuNPs:CdSe/ZnS QDs, ∼1:10 (red) and ∼1:100 (green) compared with CdSe/ZnS QDs (blue). Note: samples are excited at 375 nm. | ||
An enhancement in the PL intensity of the emitters is observed when a lower number density (∼10 CdSe/ZnS QDs per AuNPs) is used (Fig. 5E). By calculating the EFBE, we observe a 4.3-fold enhancement, shown in Fig. 5H. Interestingly, alongside the enhancement in PL intensity, the EFλ spectral profile across the entire spectral window closely follows the extinction spectrum of the plasmonic nanoparticle (Fig. 5G). This unique spectral profile matching is a hallmark of plasmon-assisted PL enhancement.
Further on increasing the number of CdSe/ZnS QDs on the surface of AuNPs from ∼10 to ∼100, PL quenching is observed instead of an enhancement, after performing IFE and SE corrections (Fig. 5F). The EFBE of the hybrid system is estimated to be 0.47 for the high number density of emitters, indicative of PL quenching presented in Fig. 5H. Interestingly, along with the reduction in the PL intensity of the hybrid system, a red shift in the PL maximum from 541 nm to 550 nm is observed compared to QDs in the absence of AuNPs (Fig. 5F). This red shift in PL maximum is indicative of the nonradiative energy transfer between nearby QDs in the presence of the plasmonic field (Fig. S14†).79,81,88 A size distribution exists within QDs, causing smaller QDs to nonradiatively transfer energy to larger ones when they are in close proximity. It is established that Förster resonant energy transfer efficiency between emitters can be enhanced by the plasmonic field.45,46,81 Unlike in the case of Fig. 5G, the experimentally calculated EFλ profile deviates from the extinction spectrum of the plasmonic nanoparticle when the number density of QDs is high, as shown in Fig. S15.† The red shift in EFλ, along with quenching in the blue region and enhancement in the red region, reaffirms the occurrence of nonradiative energy transfer between the QDs in the presence of the plasmonic field. Thus, the observed quenching in the PL is attributed to plasmon-assisted nonradiative energy transfer. In summary, the higher number density of emitters on the surface of plasmonic material critically influences the frequency-specific PL enhancement of these emitters. In such cases, plasmon-assisted energy transfer between emitters competes with metal-enhanced fluorescence, thereby altering the PL landscape more significantly than the latter.
4. Conclusions
A physical approach for the preferential enhancement of band edge emission of CdSe QDs over its trap state emission is demonstrated using frequency-specific plasmonic resonance coupling. The emitter-bound plasmonic hybrids are designed via electrostatic interaction between positively charged polymer-coated Au nanoparticles and negatively charged CdSe QDs. The formation of the hybrid system is confirmed using TEM and zeta potential studies. Selective photoluminescence enhancement is achieved by matching the plasmon resonance of Au nanoparticle with the band edge emission of QDs. The spectral overlap between the two components enhances the density of optical states at the resonance wavelengths, resulting in an increased emission rate. The photoluminescence enhancement factor of CdSe QDs, calculated at each emission wavelength (EFλ), matches well with both the extinction spectrum of the plasmonic material and the theoretically calculated radiative rate enhancement. Frequency-specific enhancement of photoluminescence in the presence of plasmonic material is further validated using CdSe/ZnS QDs, which are devoid of trap state emission, by varying the emitter density. A significant photoluminescence enhancement is observed at lower emitter density of QDs on the surface of the plasmonic material, while an increase in the number density results in photoluminescence quenching accompanied by a red shift in the emission maximum. These effects are attributed to plasmon-assisted energy transfer between nearby QDs in the hybrid system. Thus, depending on the number density of emitters on Au nanoparticles, plasmon-assisted enhancement and energy transfer compete. Therefore, it is crucial to optimize the number of emitters on plasmonic nanoparticles while designing hybrid systems with enhanced photoluminescence intensity having applications in diverse arenas of optoelectronics.Data availability
All data supporting of the above-mentioned manuscript have been included as part of the ESI.†Author contributions
The experiments are designed by K. G. T. and L. P. and carried out by L. P. together with E. M. T. and A. C. and form part of the doctoral thesis of L. P. The theoretical studies are designed and carried out by S. K. G. All authors contributed to the analysis and writing of the manuscript.Conflicts of interest
There are no conflicts to declare.Acknowledgements
Authors (K. G. T., L. P., E. M. T. and A. C.) thank the DST Nanomission project (DST/NM/TUE/EE-01/2019) of the Department of Science and Technology (DST), Government of India for financial support. K. G. T. acknowledges the J. C. Bose National Fellowship of DST, Government of India. L. P. and E. M. T. acknowledge the fellowship from the IISER TVM, Council of Scientific and Industrial Research, Government of India, respectively. A. C. acknowledges the fellowship from Innovation in Science Pursuit for Inspired Research (INSPIRE), Department of Science & Technology, Government of India. We thank John A. Parker for valuable advice on electrodynamics calculations. Use of the Center for Nanoscale Materials, an Office of Science user facility, was supported by the U.S. Department of Energy, Office of Science, Office of Basic Energy Sciences, under Contract No. DE-AC02-06CH11357.References
- C. Giansante and I. Infante, J. Phys. Chem. Lett., 2017, 8, 5209–5215 CrossRef CAS PubMed
.
- C. L. Hartley, M. L. Kessler and J. L. Dempsey, J. Am. Chem. Soc., 2021, 143, 1251–1266 CrossRef CAS
- D. A. Wheeler and J. Z. Zhang, Adv. Mater., 2013, 25, 2878–2896 CrossRef CAS PubMed
- M. Jones, S. S. Lo and G. D. Scholes, J. Phys. Chem. C, 2009, 113, 18632–18642 CrossRef CAS
- A. Thomas, K. Sandeep, S. M. Somasundaran and K. G. Thomas, ACS Energy Lett., 2018, 3, 2368–2375 CrossRef CAS
- D. R. Baker and P. V. Kamat, Langmuir, 2010, 26, 11272–11276 CrossRef CAS PubMed
- A. Veamatahau, B. Jiang, T. Seifert, S. Makuta, K. Latham, M. Kanehara, T. Teranishi and Y. Tachibana, Phys. Chem. Chem. Phys., 2015, 17, 2850–2858 RSC
- N. Kirkwood, J. O. V. Monchen, R. W. Crisp, G. Grimaldi, H. A. C. Bergstein, I. du Fossé, W. van der Stam, I. Infante and A. J. Houtepen, J. Am. Chem. Soc., 2018, 140, 15712–15723 CrossRef CAS
- X. Zhang, M. H. Hudson and F. N. Castellano, J. Phys. Chem. C, 2021, 125, 18362–18371 CrossRef CAS
- C. Yuan, M. He, X. Liao, M. Liu, Q. Zhang, Q. Wan, Z. Qu, L. Kong and L. Li, Chem. Sci., 2023, 14, 13119–13125 RSC
- T. V. Duncan, M. A. Méndez Polanco, Y. Kim and S.-J. Park, J. Phys. Chem. C, 2009, 113, 7561–7566 CrossRef CAS
- B. O. Dabbousi, J. Rodriguez-Viejo, F. V. Mikulec, J. R. Heine, H. Mattoussi, R. Ober, K. F. Jensen and M. G. Bawendi, J. Phys. Chem. B, 1997, 101, 9463–9475 CrossRef CAS
- P. K. Singha, T. Kistwal and A. Datta, J. Phys. Chem. Lett., 2023, 14, 4289–4296 CrossRef CAS PubMed
- A. B. Greytak, P. M. Allen, W. Liu, J. Zhao, E. R. Young, Z. Popović, B. J. Walker, D. G. Nocera and M. G. Bawendi, Chem. Sci., 2012, 3, 2028–2034 RSC
- W. Yang, Y. Yang, A. L. Kaledin, S. He, T. Jin, J. R. McBride and T. Lian, Chem. Sci., 2020, 11, 5779–5789 RSC
- M. Ringler, A. Schwemer, M. Wunderlich, A. Nichtl, K. Kürzinger, T. A. Klar and J. Feldmann, Phys. Rev. Lett., 2008, 100, 203002 CrossRef CAS
- A. Cocina, R. Brechbühler, S. J. W. Vonk, J. Cui, A. A. Rossinelli, H. Rojo, F. T. Rabouw and D. J. Norris, J. Phys. Chem. Lett., 2022, 13, 4145–4151 CrossRef CAS PubMed
- M. Pelton, Nat. Photon., 2015, 9, 427–435 CrossRef CAS
- S.-J. Park, S. Link, W. L. Miller, A. Gesquiere and P. F. Barbara, Chem. Phys., 2007, 341, 169–174 CrossRef CAS
- J. T. Hugall, A. Singh and N. F. van Hulst, ACS Photonics, 2018, 5, 43–53 CrossRef CAS
- S. Mignuzzi, S. Vezzoli, S. A. R. Horsley, W. L. Barnes, S. A. Maier and R. Sapienza, Nano Lett., 2019, 19, 1613–1617 CrossRef CAS
- L. Zhao, T. Ming, H. Chen, Y. Liang and J. Wang, Nanoscale, 2011, 3, 3849–3859 RSC
- E. M. Purcell, Phys. Rev., 1946, 69, 674 CrossRef
- S. Link and M. A. El-Sayed, J. Phys. Chem. B, 1999, 103, 4212–4217 CrossRef CAS
- K. G. Thomas and P. V. Kamat, J. Am. Chem. Soc., 2000, 122, 2655–2656 CrossRef CAS
- D. Nepal, L. F. Drummy, S. Biswas, K. Park and R. A. Vaia, ACS Nano, 2013, 7, 9064–9074 CrossRef CAS PubMed
- P. Reineck, D. Gómez, S. H. Ng, M. Karg, T. Bell, P. Mulvaney and U. Bach, ACS Nano, 2013, 7, 6636–6648 CrossRef CAS
- T. Wu, M. Gurioli and P. Lalanne, ACS Photonics, 2021, 8, 1522–1538 CrossRef CAS
- M. Achermann, J. Phys. Chem. Lett., 2010, 1, 2837–2843 CrossRef CAS
- K. H. Drexhage, J. Lumin., 1970, 1–2, 693–701 CrossRef
- J. Zhang, X. Cheng, H. Zhang, J. Zheng and J. Wang, ACS Nano, 2023, 17, 10546–10559 CrossRef CAS
- A. I. Dragan and C. D. Geddes, Phys. Chem. Chem. Phys., 2011, 13, 3831–3838 RSC
- J.-E. Park, J. Kim and J.-M. Nam, Chem. Sci., 2017, 8, 4696–4704 RSC
- W. Peng, J.-W. Zhou, M.-L. Li, L. Sun, Y.-J. Zhang and J.-F. Li, Chem. Sci., 2024, 15, 2697–2711 RSC
- S. Prakash, T. Behera, A. Chowdhury and A. Datta, ACS Appl. Nano Mater., 2023, 6, 17539–17547 CrossRef CAS
- R. Collison, J. B. Pérez-Sánchez, M. Du, J. Trevino, J. Yuen-Zhou, S. O'Brien and V. M. Menon, ACS Photonics, 2021, 8, 2211–2219 CrossRef CAS
- S. Khatua, P. M. R. Paulo, H. Yuan, A. Gupta, P. Zijlstra and M. Orrit, ACS Nano, 2014, 8, 4440–4449 CrossRef CAS PubMed
- A. G. Brolo, S. C. Kwok, M. D. Cooper, M. G. Moffitt, C. W. Wang, R. Gordon, J. Riordon and K. L. Kavanagh, J. Phys. Chem. B, 2006, 110, 8307–8313 CrossRef CAS
- R. Dutta, K. Jain, M. Venkatapathi and J. K. Basu, Phys. Rev. B, 2019, 100, 155413 CrossRef CAS
- Z. Zeng, S. Mizukami, K. Fujita and K. Kikuchi, Chem. Sci., 2015, 6, 4934–4939 RSC
- E. M. Thomas, C. L. Cortes, L. Paul, S. K. Gray and K. G. Thomas, Phys. Chem. Chem. Phys., 2022, 24, 17250–17262 RSC
- J. de Torres, P. Ferrand, G. Colas des Francs and J. Wenger, ACS Nano, 2016, 10, 3968–3976 CrossRef CAS
- L.-Y. Hsu, W. Ding and G. C. Schatz, J. Phys. Chem. Lett., 2017, 8, 2357–2367 CrossRef CAS
- L. Karnam, L. Brambilla, M. Del Zoppo and C. Bertarelli, Phys. Chem. Chem. Phys., 2017, 19, 30734–30739 RSC
- N. Aissaoui, K. Moth-Poulsen, M. Käll, P. Johansson, L. M. Wilhelmsson and B. Albinsson, Nanoscale, 2017, 9, 673–683 RSC
- V. K. Komarala, A. L. Bradley, Y. P. Rakovich, S. J. Byrne, Y. K. Gun’ko and A. L. Rogach, Appl. Phys. Lett., 2008, 93, 123102 CrossRef
- M. A. Fusella, R. Saramak, R. Bushati, V. M. Menon, M. S. Weaver, N. J. Thompson and J. J. Brown, Nature, 2020, 585, 379–382 CrossRef CAS
- D. M. Wu, A. García-Etxarri, A. Salleo and J. A. Dionne, J. Phys. Chem. Lett., 2014, 5, 4020–4031 CrossRef CAS
- Y. Yang, A. Dev, I. Sychugov, C. Hägglund and S.-L. Zhang, J. Phys. Chem. Lett., 2023, 14, 2339–2346 CrossRef CAS PubMed
- W. Zhang, M. Caldarola, X. Lu, B. Pradhan and M. Orrit, Phys. Chem. Chem. Phys., 2018, 20, 20468–20475 RSC
- X. Ma, K. Fletcher, T. Kipp, M. P. Grzelczak, Z. Wang, A. Guerrero-Martínez, I. Pastoriza-Santos, A. Kornowski, L. M. Liz-Marzán and A. Mews, J. Phys. Chem. Lett., 2011, 2, 2466–2471 CrossRef CAS
- K. Ray, R. Badugu and J. R. Lakowicz, J. Am. Chem. Soc., 2006, 128, 8998–8999 CrossRef CAS
- C. T. Yuan, P. Yu, H. C. Ko, J. Huang and J. Tang, ACS Nano, 2009, 3, 3051–3056 CrossRef CAS PubMed
- Y. Wang, M. Yu, K. Yang, J. Lu and L. Chen, Luminescence, 2015, 30, 1375–1379 CrossRef CAS PubMed
- K. Boldt, N. Kirkwood, G. A. Beane and P. Mulvaney, Chem. Mater., 2013, 25, 4731–4738 CrossRef CAS
- J. Jasieniak, L. Smith, J. van Embden, P. Mulvaney and M. Califano, J. Phys. Chem. C, 2009, 113, 19468–19474 CrossRef CAS
- N. G. Bastús, J. Comenge and V. Puntes, Langmuir, 2011, 27, 11098–11105 CrossRef PubMed
- E. Cho, T. Kim, S.-m. Choi, H. Jang, K. Min and E. Jang, ACS Appl. Nano Mater., 2018, 1, 7106–7114 CrossRef CAS
- S. Banerjee, A. Gupta, R. Srivastava and A. Datta, Phys. Chem. Chem. Phys., 2018, 20, 4200–4207 RSC
- H. Yuan, S. Khatua, P. Zijlstra, M. Yorulmaz and M. Orrit, Angew. Chem., Int. Ed., 2013, 52, 1217–1221 CrossRef CAS
- H. Wei, X. Yan, Y. Niu, Q. Li, Z. Jia and H. Xu, Adv. Funct. Mater., 2021, 31, 2100889 CrossRef CAS
- Y. Chen, K. Munechika, I. J.-L. Plante, A. M. Munro, S. E. Skrabalak, Y. Xia and D. S. Ginger, Appl. Phys. Lett., 2008, 93, 053106 CrossRef
- S.-Y. Liu, L. Huang, J.-F. Li, C. Wang, Q. Li, H.-X. Xu, H.-L. Guo, Z.-M. Meng, Z. Shi and Z.-Y. Li, J. Phys. Chem. C, 2013, 117, 10636–10642 CrossRef CAS
- Y. Chen, K. Munechika and D. S. Ginger, Nano Lett., 2007, 7, 690–696 CrossRef CAS PubMed
- K. Munechika, Y. Chen, A. F. Tillack, A. P. Kulkarni, I. J.-L. Plante, A. M. Munro and D. S. Ginger, Nano Lett., 2010, 10, 2598–2603 CrossRef CAS
- K. Ray, R. Badugu and J. R. Lakowicz, Langmuir, 2006, 22, 8374–8378 CrossRef CAS PubMed
- N. S. Abadeer, M. R. Brennan, W. L. Wilson and C. J. Murphy, ACS Nano, 2014, 8, 8392–8406 CrossRef CAS
- A. Wang and S. Zou, J. Phys. Chem. C, 2022, 126, 9794–9802 CrossRef CAS
- D. Lee, J. Lee, J. Song, M. Jen and Y. Pang, Phys. Chem. Chem. Phys., 2019, 21, 11599–11607 RSC
- J. R. Lakowicz, Anal. Biochem., 2005, 337, 171–194 CrossRef CAS PubMed
- W. J. M. Ridgway and A. F. Cheviakov, Comput. Phys. Commun., 2018, 233, 84–109 CrossRef CAS
- J. R. G. Navarro and M. H. V. Werts, Analyst, 2013, 138, 583–592 RSC
- J. Li, J. Chen, Y. Shen and X. Peng, Nano Res., 2018, 11, 3991–4004 CrossRef CAS
- S. Kumar Panigrahi and A. Kumar Mishra, J. Photochem. Photobiol., C, 2019, 41, 100318 CrossRef CAS
- M. Kubista, R. Sjöback, S. Eriksson and B. Albinsson, Analyst, 1994, 119, 417–419 RSC
- B. C. MacDonald, S. J. Lvin and H. Patterson, Anal. Chim. Acta, 1997, 338, 155–162 CrossRef CAS
- Q. Gu and J. E. Kenny, Anal. Chem., 2009, 81, 420–426 CrossRef CAS
- M. Sanz-Paz, F. Zhu, N. Bruder, K. Kołątaj, A. I. Fernández-Domínguez and G. P. Acuna, Nano Lett., 2023, 23, 6202–6208 CrossRef CAS
- C. R. Kagan, C. B. Murray and M. G. Bawendi, Phys. Rev. B: Condens. Matter Mater. Phys., 1996, 54, 8633–8643 CrossRef CAS
- M. S. Kodaimati, C. Wang, C. Chapman, G. C. Schatz and E. A. Weiss, ACS Nano, 2017, 11, 5041–5050 CrossRef CAS
- R. G. West and S. M. Sadeghi, J. Phys. Chem. C, 2012, 116, 20496–20503 CrossRef CAS
- E. Sakat, L. Wojszvzyk, J.-J. Greffet, J.-P. Hugonin and C. Sauvan, ACS Photonics, 2020, 7, 1523–1528 CrossRef CAS
- T. Ming, H. Chen, R. Jiang, Q. Li and J. Wang, J. Phys. Chem. Lett., 2012, 3, 191–202 CrossRef CAS
-
G. C. Schatz, M. A. Young and R. P. Van Duyne, in Surface-Enhanced Raman Scattering: Physics and Applications, ed. K. Kneipp, M. Moskovits and H. Kneipp, Springer Berlin Heidelberg, Berlin, Heidelberg, 2006, pp. 19–45 Search PubMed
- Y. Zhou, G. Chen and S. Zou, J. Phys. Chem. C, 2021, 125, 2531–2536 CrossRef CAS
- S. Dey, Y. Zhou, X. Tian, J. A. Jenkins, O. Chen, S. Zou and J. Zhao, Nanoscale, 2015, 7, 6851–6858 RSC
- P. Bharadwaj and L. Novotny, Opt. Express, 2007, 15, 14266–14274 CrossRef CAS
- M. Lunz, V. A. Gerard, Y. K. Gun’ko, V. Lesnyak, N. Gaponik, A. S. Susha, A. L. Rogach and A. L. Bradley, Nano Lett., 2011, 11, 3341–3345 CrossRef CAS PubMed
Footnote |
| † Electronic supplementary information (ESI) available. See DOI: https://doi.org/10.1039/d4sc04960h |
| This journal is © The Royal Society of Chemistry 2024 |