 Open Access Article
Methane C(sp3)–H bond activation by water microbubbles†
Juan
Li
a,
Jinheng
Xu
b,
Qingyuan
Song
a,
Xinxing
Zhang
 *c,
Yu
Xia
*ab and
Richard N.
Zare
 *b
*b
aHubei Key Laboratory of Environmental and Health Effects of Persistent Toxic Substances, School of Environment and Health, Jianghan University, Wuhan, 430056, P. R. China. E-mail: xiayu@jhun.edu.cn
bDepartment of Chemistry, Stanford University, Stanford, California 94305, USA. E-mail: zare@stanford.edu
cCollege of Chemistry, Key Laboratory of Advanced Energy Materials Chemistry (Ministry of Education), Renewable Energy Conversion and Storage Centre, Tianjin Key Laboratory of Biosensing and Molecular Recognition, Frontiers Science Centre for New Organic Matter, Nankai University, Tianjin, 300071, China. E-mail: zhangxx@nankai.edu.cn
First published on 1st October 2024
Abstract
Microbubble-induced oxidation offers an effective approach for activating the C(sp3)–H bond of methane under mild conditions, achieving a methane activation rate of up to 6.7% per hour under optimized parameters. In this study, microbubbles provided an extensive gas–liquid interface that promoted the formation of hydroxyl (OH˙) and hydrogen radicals (H˙), which facilitated the activation of methane, leading to the generation of methyl radicals (CH3˙). These species further participated in free-radical reactions at the interface, resulting in the production of ethane and formic acid. The microbubble system was optimized by adjusting gas–liquid interaction time, water temperature, and bubble size, with the optimal conditions (150 s of water–gas interaction, 15 °C, 50 μm bubble size) yielding a methane conversion rate of 171.5 ppm h−1, an ethane production rate of 23.5 ppm h−1, and a formic acid production rate of 2.3 nM h−1 during 8 h of continuous operation. The stability and efficiency of this process, confirmed through electron spin resonance, high-resolution mass spectrometry, and gas chromatography, suggest that microbubble-based methane activation offers a scalable and energy-efficient pathway for methane utilization.
Introduction
Natural gas, primarily composed of methane, is considered to be a potential alternative to crude oil, serving not only as an energy carrier but also as a crucial chemical feedstock.1,2 However, methane is a potent greenhouse gas with a global warming potential 25 times greater than carbon dioxide,3,4 making its direct conversion into high-value chemicals highly desirable for both effective fossil resource utilization and reduction of greenhouse gas emissions.2,5,6The activation of the C–H bond is the critical step in methane conversion. Due to the high bond dissociation energy, negligible electron affinity, and low polarizability of the methane C–H bond, its activation typically requires harsh conditions, such as high temperatures and pressures.7–10 These conditions increase reaction costs and exacerbate safety and environmental concerns.11,12 Therefore, achieving methane C–H bond activation under mild conditions remains a significant challenge.13,14
Recent studies by Song et al. demonstrated the conversion of methane to methanol using water microdroplets,15 where a strong electric field at the gas–liquid interface facilitates the generation of hydroxyl radicals, which participate in methane conversion. Extensive research16–23 has also shown that the interfacial effects of microdroplets not only reduce the reaction energy barriers and accelerate reaction processes, but also enhance charge transfer in gas–liquid reactions, with electric field strengths at the interface equaling or exceeding 107 V cm−1.16 Among the methods for creating extensive gas–liquid interfaces, microdroplets and microbubbles stand out, with microbubble systems possibly offering greater scalability potential.24
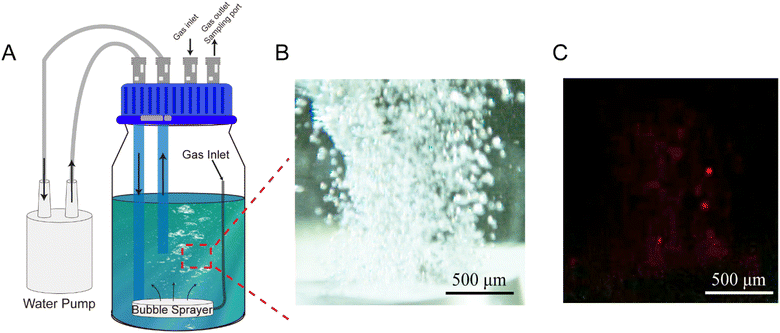
Inspired by the gas–liquid interfacial effects observed in water microdroplets, a microbubble system was developed to explore its oxidative capabilities and potential for methane C–H bond activation. The experimental setup, depicted in Fig. 1A and S1†, includes a circulating water pump, a sealed reaction vessel, and a microbubble generator (CARMIN, YLEC Consultants, Saint-Martin-d'Hères, France). Operating at a flow rate of 40 L h−1, the high-speed water flow through the microbubble generator reduces the internal pressure of the device, causing the gas in the reaction vessel to enter the microbubble generator and be released into the water as microbubbles. These microscale bubbles remain stable in the water for extended periods without rapid coalescence, transforming the deionized water from clear to milky white, as shown in Video S1.† To investigate the oxidative capabilities of the microbubbles, the oxidative fluorescent probe 10-acetyl-3,7-dihydroxyphenoxazine25 was added to the deionized water. It is known that this probe can be oxidized into resorufin, a highly fluorescent compound. Fig. 1B and C present bright-field and fluorescence images of microbubbles under a microscope, which show the same area and scale, confirming that the bubbles generated in the system have diameters smaller than 50 μm and possess oxidative capabilities. These results are consistent with the hypothesis that the extensive gas–liquid interface enhances the oxidative capacity of the system.
Results and discussion
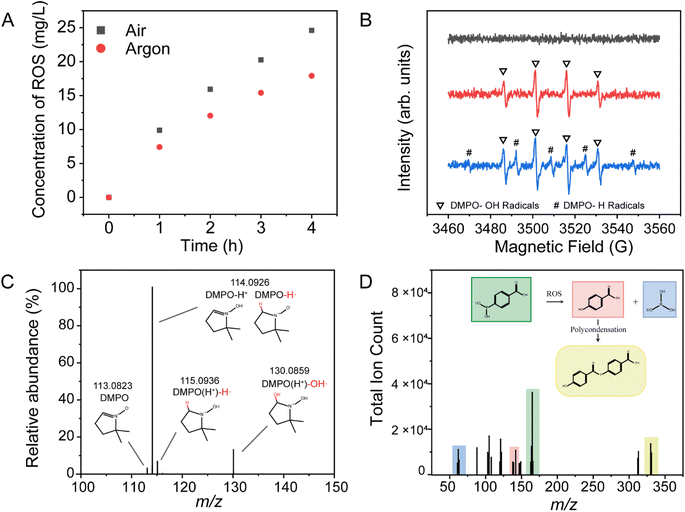
The gas atmosphere within the reaction system can be controlled through the gas inlets and outlets of the reaction vessel. Potassium titanium oxalate colorimetry was used to quantify the concentration of reactive oxygen species (ROS) in the deionized water. As shown in Fig. 2A, the ROS concentration increases with the extension of microbubble exposure time. The comparison between air and argon atmospheres indicates that gas–liquid interactions can influence the concentration of ROS in the system, and the gas composition is also a significant factor. Electron spin resonance (ESR) results (Fig. 2B) further confirm the generation of a sizeable amount of hydroxyl radicals following microbubble treatment, with observable hydrogen radical signals under argon, consistent with earlier observations in microdroplet systems. At the gas–liquid interface, water produces oxidative hydroxyl radicals and reductive hydrogen radicals, with the latter rapidly reacting with oxidizing species such as oxygen, explaining the absence of signal from hydrogen radicals in the air-microbubble system.Additionally, high-resolution mass spectrometry (HRMS) results further validate the generation of radicals in the microbubble system. As shown in Fig. 2C, after 1 hour of microbubble treatment, the reaction products in deionized water, captured by the radical scavenger DMPO, were analyzed by HRMS. Distinct peaks were observed at m/z 113, m/z 114, and m/z 130, corresponding to DMPO, DMPO with hydrogen radicals (DMPO-H˙), and DMPO with hydroxyl radicals (DMPO-OH˙), respectively. When 4-carboxyphenylboronic acid was added to the deionized water before microbubble treatment, HRMS analysis (Fig. 2D) clearly identified oxidation products such as 4-carboxyphenol. These findings collectively demonstrate that microbubbles possess oxidative properties like those of microdroplets.
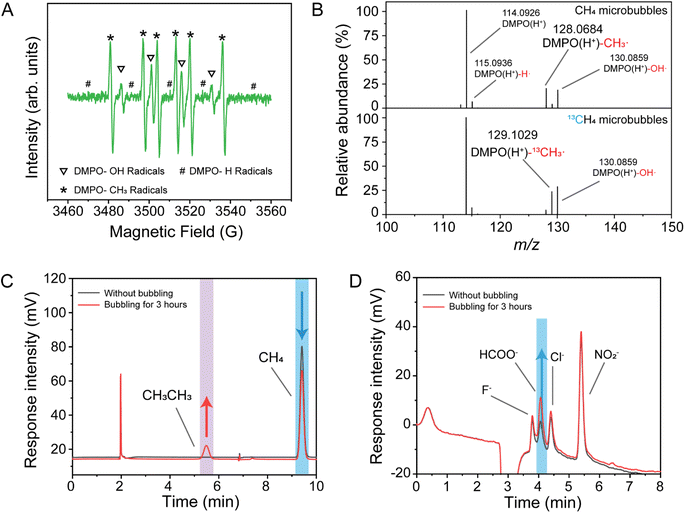
The system's atmosphere was replaced with methane. After 1 h of microbubble treatment, the electron paramagnetic resonance (ESR) results (Fig. 3A) revealed strong signals from methyl radicals, along with hydroxyl and hydrogen radicals, providing direct evidence of methane C–H bond activation. As shown in Fig. 3B, the addition of a radical scavenger to the deionized water resulted in a clear DMPO-methyl radical signal (DMPO-CH3˙) at m/z 128. When CH4 was substituted with the isotope 13CH4, the corresponding DMPO-methyl radical signal (m/z 129, DMPO-13CH3˙) was also detected in the mass spectrometry results.
After 3 h of microbubble treatment, the gas composition in the system was analyzed using gas chromatography equipped with a flame ionization detector (FID). Commercial standards were used to calibrate the retention times of different gases, with methane and ethane exhibiting retention times of 9.41 min and 5.49 min, respectively. As shown in Fig. 3C, ethane was detected in the gas mixture after microbubble treatment, alongside a noticeable decrease in methane signal. This suggests that a portion of methane was activated by the microbubble process, generating methyl radicals, which subsequently dimerized to form ethane. The treated deionized water was analyzed for anions using ion chromatography, with commercial standards employed to calibrate the retention times of different anions. As shown in Fig. 3D, a large increase in concentration of the formate anion was observed, indicating that activated methane was further oxidized to formic acid. To further identify methane oxidation products, the solution after microbubble treatment was analyzed using HRMS. As shown in Fig. S2,† the unreacted deionized water showed minimal formate signal (m/z 45), whereas a clear formate signal was detected after CH4 microbubble treatment. When 13CH4 was used, the corresponding isotopic formate signal (H13COO−, m/z 46) was also observed. This confirms that methane was the sole carbon source in the system and that microbubbles effectively activated the methane C–H bond, leading to its conversion to formic acid.
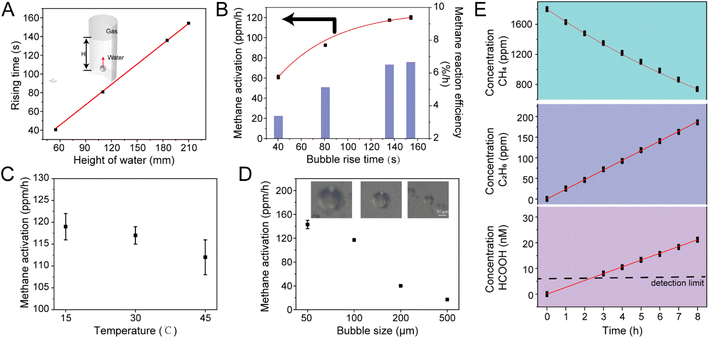
Based on the established capability of the microbubble system to activate methane, we further optimized the reaction conditions to enhance methane activation rates. Key parameters influencing the conversion process include gas–liquid interaction time, water temperature, and bubble size. A microbubble model was constructed using COMSOL software to calculate the ascent time of individual bubbles from different depths to the water surface. Given the micron scale of the bubbles, their terminal velocity was estimated using Stokes' law, which provided an estimate of the ascent time. As illustrated in Video S2† and Fig. 4A, the ascent time of bubbles with a 100 μm diameter was found to be proportional to water depth; the deeper the depth, the longer the gas–liquid interface interaction time.
To investigate the effect of water height, the water column was adjusted while maintaining consistent gas volume and concentration (450 mL, 1800 ppm CH4). Experiments were conducted using different size bottles of varying volumes (500 mL, 1000 mL, 2000 mL, and 3000 mL), corresponding to water depths of 55 mm, 110 mm, 185 mm, and 210 mm, respectively. The gas–liquid interaction times were 40.4 s, 80.5 s, 135.9 s, and 154.2 s, respectively. After 1 hour of microbubble treatment, the methane concentration in the gas phase was analyzed, with each experiment repeated three times. As shown in Fig. 4B, the methane activation rate increased progressively with longer gas–liquid interaction times, reaching a reaction rate of 120 ppm h−1, equivalent to 6.7% of the total methane per hour.
Additionally, changes in water temperature significantly affected methane conversion. As depicted in Fig. 4C, an increase in temperature resulted in a decrease in methane conversion rate, indicating that the overall reaction is exothermic.
Adjusting the microbubble generator allowed for precise control of bubble size, which was observed using a high-speed CCD camera (Video S3†). The average bubble size was controlled at 50, 100, 200, and 500 μm, and the methane concentration was analyzed after 1 hour of bubbling treatment. As shown in Fig. 4D, smaller bubbles exhibited higher reactivity. This can be attributed to the larger specific surface area and greater gas–liquid interaction range of smaller bubbles, which enhances reaction activity—an effect analogous to the properties observed in microdroplets.
Under the optimal reaction conditions (150 s of water–gas interaction, 15 °C water temperature, and 50 μm average bubble size), the stability of the microbubble reaction system was verified. The reaction was sustained for 8 h, with 2 mL of gas and 1 mL of liquid sampled every hour for quantitative analysis of methane, ethane, and formic acid using gas chromatography and ion chromatography. As depicted in Fig. 4E, the activation and conversion of methane remained continuous and stable throughout the 8 hour reaction period. The concentrations of methane, ethane, and formic acid all displayed linear trends, with ethane yielding 23.5 ppm h−1, formic acid yielding 2.3 nM h−1, and methane exhibiting an activation rate of 171.5 ppm h−1 (approximately 6.2% of the total methane per hour). Notably, the amount of methane reacted was closely related to the gas flow rate spontaneously drawn into the microbubble generator.
Based on the results, the chemical reactions in the methane-microbubble system can be considered to involve multiple steps, like those in microdroplet systems. As depicted in Fig. 5A, the gas–liquid interface in the microbubble system remains the primary site for chemical reactions, where H+ and OH− ions undergo electron transfer due to partial solvation effects and the electric field at the interface, generating H and OH radicals. The OH radicals can dimerize to form hydrogen peroxide or react with methane to break the C(sp3)–H bond, producing methyl radicals. It might also be possible that H atoms also participate to form methyl radicals. Methyl radicals can dimerize to form ethane or combine with hydroxyl radicals to produce methanol. The gas–liquid interface not only reduces the reaction energy barriers but also accelerates the reaction process. At this interface, methyl radicals can undergo further oxidation to generate formaldehyde and formic acid through similar radical oxidation processes. Standard thermodynamic data (Table S1†) indicate that the formation of methyl radicals from methane in bulk water is an endothermic process and is thus thermodynamically unfavorable (ΔH1 = 358.1 kJ mol−1). However, when assuming that the enthalpy at the gas–liquid interface is the average of the gas and bulk phases (Fig. 5B), the reaction energy for the formation of methyl radicals from methane in the presence of H+ and OH− ions becomes negative (ΔH2 = −442.7 kJ mol−1), suggesting that the reaction is spontaneous at the gas–liquid interface.
Conclusions
This study systematically demonstrates that microbubbles possess spontaneous oxidative capabilities like those of microdroplets, enabling the generation of hydroxyl radicals. Based on these findings, we propose that this approach represents a novel method for the rapid activation of methane under mild conditions. The ESR and mass spectrometry results confirm that the hydroxyl radicals spontaneously produced at the microbubble interface activate the methane C–H bond, leading to the formation of methyl radicals. Additionally, we demonstrated that methane can be continuously and stably reacted over an 8 h period. Like microdroplets, microbubbles provide a rich gas–liquid interface, offering a crucial reaction site for methane activation, while the enclosed reaction environment ensures more efficient utilization of the reactants. These findings enhance the understanding of gas–liquid interfaces, expand the methods for constructing gas–liquid interface reaction systems, and indicate that microbubble systems offer scalability for such reactions.Data availability
Experimental description on microbubble generation, free radical testing (electron spin resonance spectroscopy), gas chromatography analysis, mass spectrometry analysis, 13CH4 isotope experiments, and ion chromatography analysis are available in the ESI.†Author contributions
R. N. Z. and Y. X. did the experimental design and data analysis. J. L., Q. S. and J. X. did the experiments, data compilation and analysis. R. N. Z., Y. X., J. X. and X. Z. did the drawings, manuscript writing, and revision.Conflicts of interest
The authors declare no conflict of interest.Acknowledgements
This work was supported by the National Natural Science Foundation of China (22306073), the US Air Force Office of Scientific Research through the Multidisciplinary University Research Initiative (MURI) program (AFOSR FA9550-21-1-0170), and the National Key R&D Program of China (2023YFE0124200).Notes and references
- D. Saha, H. A. Grappe, A. Chakraborty and G. Orkoulas, Chem. Rev., 2016, 116(19), 11436–11499 CrossRef CAS PubMed.
- N. J. Gunsalus, A. Koppaka, S. H. Park, S. M. Bischof, B. G. Hashiguchi and R. A. Periana, Chem. Rev., 2017, 117(13), 8521–8573 CrossRef CAS PubMed.
- H. Tian, C. Lu, P. Ciais, A. M. Michalak, J. G. Canadell, E. Saikawa, D. N. Huntzinger, K. R. Gurney, S. Sitch, B. Zhang, J. Yang, P. Bousquet, L. Bruhwiler, G. Chen, E. Dlugokencky, P. Friedlingstein, J. Melillo, S. Pan, B. Poulter, R. Prinn, M. Saunois, C. R. Schwalm and S. C. Wofsy, Nature, 2016, 531(7593), 225–228 CrossRef CAS PubMed.
- WMO, The global climate 2011–2020:a decade of accelerating climate change, 2023, p. 1338 Search PubMed.
- Y. Jiang, S. Li, S. Wang, Y. Zhang, C. Long, J. Xie, X. Fan, W. Zhao, P. Xu, Y. Fan, C. Cui and Z. Tang, J. Am. Chem. Soc., 2023, 145(4), 2698–2707 CrossRef CAS PubMed.
- A. Caballero and P. J. Pérez, Chem. Soc. Rev., 2013, 42(23), 8809–8820 RSC.
- Y. Tang, Y. Li and F. Tao, Chem. Soc. Rev., 2022, 51(1), 376–423 RSC.
- P. Wang, R. Shi, J. Zhao and T. Zhang, Advanced Science, 2024, 11(8), 2305471 CrossRef CAS PubMed.
- J. Kim, M. S. Abbott, D. B. Go and J. C. Hicks, ACS Energy Lett., 2016, 1(1), 94–99 CrossRef CAS.
- J. W. M. H. Geerts, J. H. B. J. Hoebink and K. van der Wiele, Catal. Today, 1990, 6(4), 613–620 CrossRef CAS.
- E. Huang and P. Liu, J. Phys. Chem. Lett., 2023, 14(29), 6556–6563 CrossRef CAS PubMed.
- R. K. Srivastava, P. K. Sarangi, L. Bhatia, A. K. Singh and K. P. Shadangi, Biomass Convers. Biorefin., 2022, 12(5), 1851–1875 CrossRef CAS.
- H. Schwarz, Angew. Chem., Int. Ed., 2011, 50(43), 10096–10115 CrossRef CAS PubMed.
- A. E. Shilov and G. B. Shul'pin, Chem. Rev., 1997, 97(8), 2879–2932 CrossRef CAS PubMed.
- X. Song, C. Basheer and R. N. Zare, J. Am. Chem. Soc., 2023, 145(50), 27198–27204 CrossRef CAS PubMed.
- H. Xiong, J. K. Lee, R. N. Zare and W. Min, J. Phys. Chem. Lett., 2020, 11(17), 7423–7428 CrossRef CAS PubMed.
- M. A. Mehrgardi, M. Mofidfar and R. N. Zare, J. Am. Chem. Soc., 2022, 144(17), 7606–7609 CrossRef CAS PubMed.
- S. Jin, R. Wang, H. Chen, X. Yuan and X. Zhang, J. Phys. Chem. A, 2023, 127(12), 2805–2809 CrossRef CAS PubMed.
- A. J. Colussi, J. Am. Chem. Soc., 2023, 145(30), 16315–16317 CrossRef CAS PubMed.
- D. Xing, Y. Meng, X. Yuan, S. Jin, X. Song, R. N. Zare and X. Zhang, Angew. Chem., Int. Ed., 2022, 61(33), e202207587 CrossRef CAS PubMed.
- J. P. Heindel, H. Hao, R. A. LaCour and T. Head-Gordon, J. Phys. Chem. Lett., 2022, 13(43), 10035–10041 CrossRef CAS PubMed.
- K. Li, Y. Guo, S. A. Nizkorodov, Y. Rudich, M. Angelaki, X. Wang, T. An, S. Perrier and C. George, Proc. Natl. Acad. Sci. U. S. A., 2023, 120(15), e2220228120 CrossRef CAS PubMed.
- J. K. Lee, K. L. Walker, H. S. Han, J. Kang, F. B. Prinz, R. M. Waymouth, H. G. Nam and R. N. Zare, Proc. Natl. Acad. Sci. U. S. A., 2019, 116(39), 19294–19298 CrossRef CAS PubMed.
- Y. He, T. Zhang, L. Lv, W. Tang, Y. Wang, J. Zhou and S. Tang, Environ. Chem. Lett., 2023, 21(6), 3245–3271 CrossRef CAS.
- B. Chen, Y. Xia, R. He, H. Sang, W. Zhang, J. Li, L. Chen, P. Wang, S. Guo, Y. Yin, L. Hu, M. Song, Y. Liang, Y. Wang, G. Jiang and R. N. Zare, Proc. Natl. Acad. Sci. U. S. A., 2022, 119(32), e2209056119 CrossRef CAS PubMed.
Footnote |
| † Electronic supplementary information (ESI) available. See DOI: https://doi.org/10.1039/d4sc05773b |
| This journal is © The Royal Society of Chemistry 2024 |


