DOI:
10.1039/D3SD00146F
(Paper)
Sens. Diagn., 2024,
3, 87-94
Turn-off fluorescence of imidazole-based sensor probe for mercury ions†
Received
11th June 2023
, Accepted 16th October 2023
First published on 17th October 2023
Abstract
A new highly selective and sensitive fluorescent probe, 5 (2-(4-(1,3-dithian-2-yl)phenyl)-4,5-diphenyl-1H-imidazole), was developed for Hg2+ ion with colorimetric and fluorimetric behavior in organic semi-aqueous solutions. A significant color change from strong cyan blue to weak blue can be observed with probe 5 in association with Hg2+-promoted deprotection of thioacetals. Fluorescent probe 5 can detect quite low levels (5.3 nM) of Hg2+ ions. However, we carried out an NMR titration experiment and DFT analysis to characterize the sensor probe 5 with Hg2+ ion based on the intramolecular charge transfer mechanism. Furthermore, sensor probe 5 responded quickly across a wide pH range. Most importantly, it could be utilized for excellent selective detection and bio-imaging of Hg2+ ion in the E. coli cells, as well as Whatman filter paper-based test strips.
1. Introduction
Recognition of mercury, a highly toxic heavy metal pollutant widely distributed in agriculture and industrial water and soil, is essential. Heavy metal ions have received significant attention in supramolecular chemistry due to their notable importance in biological, organic, and ecological assays.1 At low concentrations, mercury vapor can cause a variety of diseases in the digestive system, as well as Minamata disease, kidney damage, and serious mental and neurological complications, due to their ease of passage through biological membranes.2 Mercury ion is conventionally used in a wide range of industries, such as coal and gold mining, oil refining, and caustic soda manufacturing.3 Therefore, it is very important to detect mercury ion levels in both biological and environmental models.4 Chemical analyses have been used for the determination of toxic heavy metals, for example, atomic absorption spectrometry,5 mass spectrometry,6 liquid chromatography,7 ion chromatography,8 gas chromatography,9 HPLC (high-performance liquid chromatography), and X-ray fluorescence spectrometry,10 as well as fluorescent probe technique. Among these detection methods, the fluorescent probe emission technique is widely accepted due to its on-site high-sensitivity detection with fast response, low cost, and analysis of real samples. Moreover, the multistep syntheses often require the protection of functional groups, which then have to be deprotected for selective detection on a particular site.11 A typical change accompanying the functional groups results in a distinct change in the electrical and photophysical state of the molecule. Amongst the various aldehyde protective groups, multistep synthesis in cyclic or acyclic thioacetals is frequently engaged, as they are stable in all conditions containing acidic and alkaline media. Furthermore, signaling mechanisms that commonly arise in fluorescent probes are intramolecular charge transfer (ICT),12–17 photo-induced electron transfer (PET),18 fluorescence resonance energy transfer (FRET),19 which are ascribed in the direction of energy/electron transfer using protection/ deprotection approach. Many fluorometric sensor moieties are available for the detection of mercury but with limitations, for example, pyridine and pyrene molecules are very difficult to synthesize and are less sensitive and less specific.20–23 The turn-off fluorescent chemosensors have been used for mercury-ion sensing in aqueous solutions through intramolecular charge transfer emissions.24 Pyrene carboxaldehyde-based turn-on chemodosimeter has been reported for the detection of Hg2+ by DarShak R. Trivedi et al. They have also discussed toxic forms of organic mercury and As3+.25,26 2-Aminopyridine derivative-based turn-off fluorescence sensing with selective determination of Hg2+ and Fe3+ was reported by Subrata Ghosh et al.27 The development of simple fluorometric biosensors and impedimetric chemosensors for the determination of Hg2+ ions was reported by D. Tang et al.28–31 A novel coumarin-based absorbance and fluorescence detection of mercury and cyanide ions in aqueous solution were reported by Jalal Isaad et al. and Liqun Chi et al.32,33 Amphiphilic tripodal sensor-based turn-on fluorescent determination of Hg2+ was developed in an aqueous solution with relevant analytical application34 and a ruthenium(II) polypyridine-based fluorescent sensor was developed as a luminescent probe for the detection of mercury ions.35 Highly selective and fast visual response of the detection of mercury ions and its application in buffer-free real water samples36 are well-documented. Application on bioimaging and paper strips with a phenothiazine probe for the detection of mercury ions37 and lysosome-targetable fluorescent sensor with highly selective Hg2+ in environmental water samples and bioimaging38 have been reported. The cyclization between phenol and acetylene to form benzofuranyl mercury chloride was discussed by Dong-Gyu Cho et al.39 Keun-Hyeung Lee et al. reported enhanced fluorescence of a sensor based on an amino acid for Pb2+ and Hg2+ detection in an aqueous medium.40,41 Tridentate lysine-based sensors for the detection of Hg2+ in aqueous solution were reported by Li-Jun Ma et al.42 Shih-Sheng Sun et al. designed styryl dithiaazacrown containing platinum(II) terpyridine for selective colorimetric detection of Hg2+.43 Removal of Hg2+ ions by environmental samples and the use of44–46 various voltammetric techniques for the detection of mercury ions has been discussed by Richard G. Compton et al.47 The application of gold and silver nanoparticles attached to organic fluorophore has been discussed by Kien Wen Sun et al. and Bipul Sarkar and Palash Mondal.48,49
Herein, we designed an electron-rich protecting group, 1,3 propane dithiol, which might be scavenged by Hg2+ species to release the electron-lacking diphenyl imidazole benzaldehyde core. Therefore, thioacetal of probe 5 is converted to aldehyde compound 3. Compound 3 shows a blue shift in UV-visible absorbance and fluorescence following intramolecular charge transfer (ICT) from the electron-donating diphenyl imidazole moiety to the electron-attracting aldehydic group with less intensity than probe 5. As a result, in the context of a strategy of protection and removal of protection in the probe, the arrangement of electrons in the aldehydic functional group could utilize ICT to produce a large wavelength with high emission intensity, whereas the intensity of emission of probe 5 decreased upon adding Hg2+ to the aqueous medium. It was found that the fluorescence intensity of the probes increased linearly with the Hg2+ concentration over a wide range of concentrations. Thus, the intensity of emission was restored by adding CN− ions to replace Hg2+. These changes indicate the capability of sensor 5 and its 5 + Hg2+ group for measurable detection of Hg2+, as well as the recovery of fluorescence by CN− as an “on–off–on” type probe.
2. Results and discussion
2.1 Preparation of compound 3
Here, 0.643 grams of terepthaldehyde and 2.95 grams of ammonium acetate were dissolved in 30 mL of ethanol. A small amount of benzil (1 g) was added to the reaction mixture after it had been slightly warmed. The reaction mixture was heated for about 6 hours. The dark orange crude product was obtained by evaporating the solvent under vacuum. In the final step, hexane/ethyl acetate (95/5, v/v) was used as an eluent for silica gel chromatography to produce 1.31 g of the crude product (yield: 84%).
2.2 Synthesis of sensor compound 5
Sensor 5 was readily synthesized from aldehyde by coupling between diphenylimidazo benzaldehyde 5 (0.5 g) and 1,3-propanedithiol (0.185 mL) catalyzed by p-toluenesulfonic acid using ethanol as solvent under reflux condition for 12 h. The reaction mixture was heated until the starting materials had dissolved. Further purification was achieved using column chromatography hexane/ethyl acetate (90/10, v/v) and 0.43 g of compound 5 (yield: 75%) was obtained. The structure was determined using NMR spectroscopic and HRMS techniques (ESI† Fig. S1–S3) (Scheme 1).
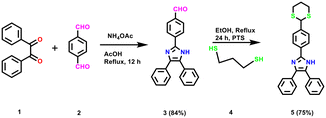 |
| | Scheme 1 A synthetic route for the synthesis of 2-(4-(1,3-dithian-2-yl)phenyl)-4,5-diphenyl-1H-imidazole. | |
2.3 The absorption selectivity and titration studies of the probe
Probe 5 was evaluated for colorimetric and fluorescence emission responses to a variety of metal ions in a CH3CN/H2O mixture (8![[thin space (1/6-em)]](https://www.rsc.org/images/entities/char_2009.gif) :
:![[thin space (1/6-em)]](https://www.rsc.org/images/entities/char_2009.gif) 2, v/v) as the medium. Sensor compound 5 had maximum absorption around 260–360 nm related to π–π* transitions, making the compound solution colorless. The changes in the absorption maximum with the introduction of various metal ions, including Cr3+, Li+, Cd2+, Hg2+, Na+, Ni2+, Pb2+, Al3+, Co2+, Ag+, Zn2+, Sr2+, Ba2+, Mg2+, Bi3+, Th4+ and Fe3+ are described (Fig. 1). Upon the addition of 100 μL of Hg2+ ion, the absorption spectrum of compound 5 exhibited a marked red shift when compared to probe 3. This red shift was attributed to ICT. In addition, the red shift in absorption indicates that, indeed, the aldehyde group acts as an electron-withdrawing group in the ICT process. To assess probe 5 as a colorimetric sensor for Hg2+, titrations were performed with successive additions of Hg2+ (0 to 1.6 equiv.) to a solution of probe 5. With the addition of increasing amounts of Hg2+ the absorbance at 315 nm decreased gradually while a new absorption band at 233 nm (blue shift) developed, which induced a color change from colorless to light yellow, due to the internal charge transfer (ICT) between sulfur group attached probe 5 towards Hg2+ ion. The isosbestic absorption point was observed at 220 nm upon the addition of Hg2+, which indicated a large wavelength shift in the isosbestic point with clear reproduction of compound 3.
2, v/v) as the medium. Sensor compound 5 had maximum absorption around 260–360 nm related to π–π* transitions, making the compound solution colorless. The changes in the absorption maximum with the introduction of various metal ions, including Cr3+, Li+, Cd2+, Hg2+, Na+, Ni2+, Pb2+, Al3+, Co2+, Ag+, Zn2+, Sr2+, Ba2+, Mg2+, Bi3+, Th4+ and Fe3+ are described (Fig. 1). Upon the addition of 100 μL of Hg2+ ion, the absorption spectrum of compound 5 exhibited a marked red shift when compared to probe 3. This red shift was attributed to ICT. In addition, the red shift in absorption indicates that, indeed, the aldehyde group acts as an electron-withdrawing group in the ICT process. To assess probe 5 as a colorimetric sensor for Hg2+, titrations were performed with successive additions of Hg2+ (0 to 1.6 equiv.) to a solution of probe 5. With the addition of increasing amounts of Hg2+ the absorbance at 315 nm decreased gradually while a new absorption band at 233 nm (blue shift) developed, which induced a color change from colorless to light yellow, due to the internal charge transfer (ICT) between sulfur group attached probe 5 towards Hg2+ ion. The isosbestic absorption point was observed at 220 nm upon the addition of Hg2+, which indicated a large wavelength shift in the isosbestic point with clear reproduction of compound 3.
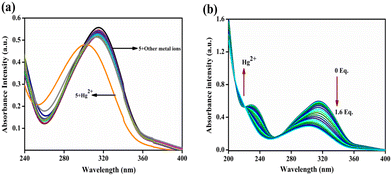 |
| | Fig. 1 (a) The UV-visible absorption spectra of sensor 5 (2 μM) upon addition of different metal cations to CH3CN/H2O (8![[thin space (1/6-em)]](https://www.rsc.org/images/entities/char_2009.gif) : :![[thin space (1/6-em)]](https://www.rsc.org/images/entities/char_2009.gif) 2, v/v) solution. (b) Titration of sensor 5 (2 μM) with increasing concentration of Hg2+ ion (1 mM). 2, v/v) solution. (b) Titration of sensor 5 (2 μM) with increasing concentration of Hg2+ ion (1 mM). | |
2.4 The fluorescence selectivity and titration studies of probe 5
The emission properties of probe 5 in the presence of different metal ions were studied in a CH3CN/H2O (8![[thin space (1/6-em)]](https://www.rsc.org/images/entities/char_2009.gif) :
:![[thin space (1/6-em)]](https://www.rsc.org/images/entities/char_2009.gif) 2, v/v) system. Probe 5 displayed high emission intensity with a longer wavelength at 340–475 nm. Except Hg2+, other competing metal ions, such as Cr3+, Li+, Cd2+, Hg2+, Na+, Ni2+, Pb2+, Al3+, Co2+, Ag+, Zn2+, Sr2+, Ba2+, Mg2+, Bi3+, Th4+ and Fe3+ did not show any spectral changes. The introduction of Hg2+ ion resulted in quenching of an intense emission peak at 385 nm as shown in Fig. 2a. The emission titration of compound 5 with 0 to 1.6 equivalent of Hg2+ ion step-by-step showed quenching of the fluorescence emission at 385 nm with a linear relationship between the concentration of Hg2+ and a decrease in the intensity of fluorescence. Due to the electron-rich nature, the thioacetal group could be easily eliminated by Hg2+ to release the electron-seeking aldehydic group resulting in a strong push–pull electron system. Furthermore, the detection limit of probe 5 toward Hg2+ was measured by plotting emission intensity against the concentration of Hg2+ ion. This plot showed good linearity (ESI† Fig. S4), and a detection limit of 5.3 nM was found, which is reasonably low for the limit of detection of Hg2+ in comparison with earlier reports on sensor performance (ESI† Table S1).
2, v/v) system. Probe 5 displayed high emission intensity with a longer wavelength at 340–475 nm. Except Hg2+, other competing metal ions, such as Cr3+, Li+, Cd2+, Hg2+, Na+, Ni2+, Pb2+, Al3+, Co2+, Ag+, Zn2+, Sr2+, Ba2+, Mg2+, Bi3+, Th4+ and Fe3+ did not show any spectral changes. The introduction of Hg2+ ion resulted in quenching of an intense emission peak at 385 nm as shown in Fig. 2a. The emission titration of compound 5 with 0 to 1.6 equivalent of Hg2+ ion step-by-step showed quenching of the fluorescence emission at 385 nm with a linear relationship between the concentration of Hg2+ and a decrease in the intensity of fluorescence. Due to the electron-rich nature, the thioacetal group could be easily eliminated by Hg2+ to release the electron-seeking aldehydic group resulting in a strong push–pull electron system. Furthermore, the detection limit of probe 5 toward Hg2+ was measured by plotting emission intensity against the concentration of Hg2+ ion. This plot showed good linearity (ESI† Fig. S4), and a detection limit of 5.3 nM was found, which is reasonably low for the limit of detection of Hg2+ in comparison with earlier reports on sensor performance (ESI† Table S1).
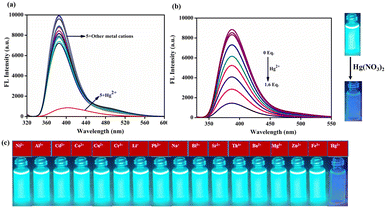 |
| | Fig. 2 (a) Sensor 5 (2 μM) fluorescence spectra with different metal ions in CH3CN/H2O (8![[thin space (1/6-em)]](https://www.rsc.org/images/entities/char_2009.gif) : :![[thin space (1/6-em)]](https://www.rsc.org/images/entities/char_2009.gif) 2, v/v) solution. (b) Compound 5 (2 μM) was treated with different equivalents of Hg2+ ion (1 mM, 0 to 1.6 equivalents). 2, v/v) solution. (b) Compound 5 (2 μM) was treated with different equivalents of Hg2+ ion (1 mM, 0 to 1.6 equivalents). | |
2.5 Interference study
The emission experiment was conducted to study interference by different metal ions by adding two equivalents of Hg2+ ions and also two equivalents of other metal ions (Cr3+, Li+, Cd2+, Hg2+, Na+, Ni2+, Pb2+, Al3+, Co2+, Ag+, Zn2+, Sr2+, Ba2+, Mg2+, Bi3+, Th4+, and Fe3+) to sensor 5 solutions. In the presence of Hg2+, the emission intensity did not change significantly when other metals were added. Hence, it has good selectivity for Hg2+ ions as compared to other metal ions (Fig. 3).
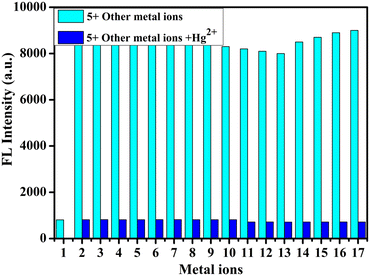 |
| | Fig. 3 Emission intensity of compound 5 in the presence of Hg2+ (2 equivalents cyan bars) and competitive metal ions (2 equivalents blue bars) which are shown in 1: Hg2+, 2: Cr3+, 3: Cd2+, 4: Li+, 5: Ni2+, 6: Sr2+, 7: Na+, 8: Pb2+, 9: Al3+, 10: Co2+, 11: Ag+, 12: Zn2+, 13: Ba2+, 14: Mg2+, 15: Fe3+, 16: Th4+ and 17: Bi3+. | |
2.6 pH study
We measured the emission response of probe 5 at different pH values to study the pH effect on the emission response with and without Hg2+. The results of the experiment suggest that the emission of compound 5 was not affected in the pH range of 6–12. The fluorescence intensity of probe 5 was high and constant within a pH range of 6–12, indicating that it was not affected by pH. However, 5 with Hg2+ showed decreased fluorescence intensity at pH levels 2 to 6. Fluorescence intensity also decreased within five seconds after the addition of Hg2+ ions. These results imply that there is an instant protection/deprotection occurring with the aldehyde and thiol groups. These tentative data prove that probe 5 can be used in biological systems and that the fluorescence intensity of 5 with Hg2+ remains constant in the physiological pH range (Fig. 4).
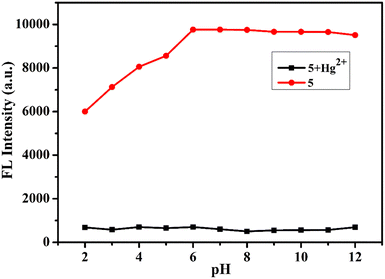 |
| | Fig. 4 Compound 5 and 5 + Hg2+ emission intensities at different pH levels. | |
2.7 Response time study
We studied the reaction response time between probe 5 and the Hg2+ ion using time-dependent fluorescence spectra. The fluorescence emission intensity of sensor 5 at 385 nm immediately decreased in the presence of Hg2+ ion within 15 s and remained unchanged for more than 100 s. Sensor 5 detected Hg2+ ions quickly (Fig. 5).
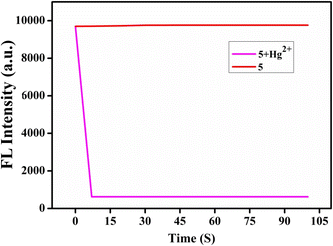 |
| | Fig. 5 Sensor 5 with Hg2+ ion response time. | |
2.8 Plausible sensing mechanism
The 1H NMR spectroscopic titration of probe 5 with Hg2+ ion in DMSO-d6 solvent further explored the interaction between probe 5 and Hg2+ ion. With the addition of Hg2+ to probe 5, the CH proton at 5.45 ppm disappeared completely. This was followed by the formation of a new proton signal at 10.01 ppm due to the formyl group. Furthermore, the 1H NMR spectra of probe 5 upon reaction with Hg2+ were quite similar to that of compound 3 indicating that the 1,3 propane dithiane unit in probe 5 was successfully deprotected, and the aldehyde group was formed in the presence of Hg2+ as described in ESI† Fig. S5. The sensing mechanism of probe 5 for Hg2+ was also investigated by FT-IR spectra, which is depicted in ESI† Fig. S7. On the introduction of Hg2+, the new bands appeared at 1656 and 2926 cm−1 related to the C(H)![[double bond, length as m-dash]](https://www.rsc.org/images/entities/char_e001.gif) O and C(
O and C(![[double bond, length as m-dash]](https://www.rsc.org/images/entities/char_e001.gif) O)–H groups, respectively. In line with probe 3, this result was also obtained. Moreover, the analysis of the HRMS spectrum of the probe clearly illustrates that the molecular ion peak was found at m/z 414.1380 but was changed to m/z 324.2122 when Hg2+ ions were introduced (ESI† Fig. S8). This is the same as compound 3 (ESI† Fig. S10), which confirms the deprotection of thiols in the presence of Hg2+ ions, which frees up an aldehyde group (Scheme 2).
O)–H groups, respectively. In line with probe 3, this result was also obtained. Moreover, the analysis of the HRMS spectrum of the probe clearly illustrates that the molecular ion peak was found at m/z 414.1380 but was changed to m/z 324.2122 when Hg2+ ions were introduced (ESI† Fig. S8). This is the same as compound 3 (ESI† Fig. S10), which confirms the deprotection of thiols in the presence of Hg2+ ions, which frees up an aldehyde group (Scheme 2).
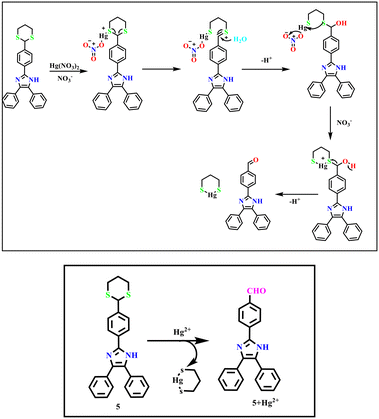 |
| | Scheme 2 Proposed mechanism for detecting Hg2+ by5. | |
2.9 DFT computational calculation studies
To further investigate the proposed mechanism of probe 5 joining the Hg2+ ion, Gaussian 09 software was used to perform DFT calculations using the B3LYP/6-311g (d, p) method.53,54 The optimized structure of compound 5 and 5 + Hg2+ are given in Fig. 6 and the corresponding details of bond lengths and bond angles are listed in ESI† Tables S2–S4. As displayed in Fig. 7, the HOMO of compound 5 was only spread over the benzene and imidazole ring, while the LUMO ranged across the entire molecule, except the 1,3 dithiane portions and the biphenyl unit. After binding of the Hg2+ ion, the electron density in the HOMO was distributed over the benzaldehyde part, while the entire molecule behaves as LUMO. According to the DFT calculations, the energy gap between HOMO and LUMO of 5 was 3.96 eV and that of 5 + Hg2+ was 3.40 eV. As a result of the conversion to the aldehyde unit, the band gap decreased by 0.56 eV. According to this observation, the energy gap decreased, and the wavelength presented a hypochromic shift, which is in agreement with the experimental results.
 |
| | Fig. 6 Optimised structure of probe 5 and optimised structure of 5 + Hg2+. | |
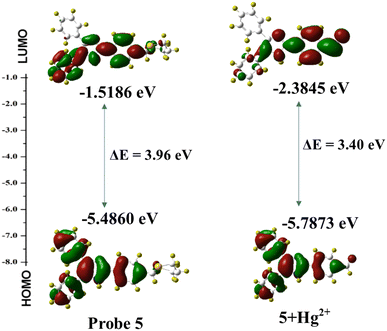 |
| | Fig. 7 HOMO and LUMO energy difference between 5 and 5 + Hg2+. | |
2.10 Application in cell-imaging
In this study, we evaluated the ability of sensor probe 5 to detect Hg2+ ions in E. coli cells using a fluorescence microscope. Fig. 8a shows a bright field image of E. coli cells soaked in probe 5 for 30 minutes in an aqueous medium. In Fig. 8b, the E. coli cells soaked in probe 5 showed blue color fluorescence after 30 minutes of incubation. In contrast, a bright field image of E. coli cells incubated with probe 5, and then in 5 μM of Hg2+, followed by being kept for 10 minutes at incubation is given in Fig. 8c. Fig. 8d shows that blue color fluorescence was quenched significantly after the addition of incubated E. coli cells to probe 5 for 10 minutes and incubated with 5 μM of Hg2+ ion solution. As a result of these changes, sensor 5 can detect Hg2+ ions in E. coli cells.
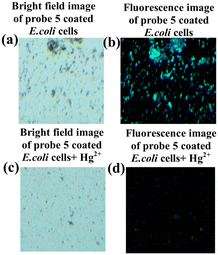 |
| | Fig. 8 Probe 5 and 5 + Hg2+ images taken in the visible region. (a) and (b) Images showing bright field and fluorescence of E. coli cells loaded with probe 5 (2 μM). Figure (c) and (d) a bright field and fluorescence image of E. coli cells further exposed to Hg2+ ion (5 μL) for 10 minutes with probe 5 (2 μM). | |
2.11 Real sample analysis
Sensor 5 was used to detect Hg2+ ions in samples of various sources of water, including distilled water, as well as water from a lake and a pond in VIT, Vellore, India. We spiked these water samples with a known amount of Hg2+ nitrate. These water samples were used for the analysis quantitatively. The emission intensity variations were measured by sensor 5 upon the introduction of various spiked amounts of Hg2+ ions. We have summarized the results of recovery, relative standard deviation (R.S.D) values (Table 1), and atomic absorption spectroscopy (AAS) using adsorption of mercury ions; a linear plot has been illustrated in ESI† Fig. S6. The emission intensities suggested that sensor 5 has a very good percentage of recovery for Hg2+ (95.40–102.4%). The introduction of the Hg2+ ion to sensor 5 in the solution form clearly showed the change in color from cyan blue to blue in the UV light. These results confirm that sensor 5 is applied to sensing the amount of Hg2+ ion spiked water samples with almost complete recovery, so that we can use this sensor for practical applications.
Table 1 The detection of Hg2+ ions in water samples collected from the VIT region (Vellore, TN, India) using sensor 5
| Sample |
Hg2+ added (μM) |
Hg2+ found (μM) |
Recovery (%) |
R.S.Da (n = 3) % |
R.S.D. relative standard deviation; conditions: 20.00 μM of probe 5 in a mixed solution of acetonitrile/ real water (8![[thin space (1/6-em)]](https://www.rsc.org/images/entities/char_2009.gif) : :![[thin space (1/6-em)]](https://www.rsc.org/images/entities/char_2009.gif) 2). 2).
|
| Pond water |
25 |
23.85 |
102.4% |
0.0255 |
| 50 |
50.22 |
101.2% |
0.0243 |
| 75 |
75.90 |
99.5% |
0.0270 |
| Lake water |
25 |
24.89 |
99.6% |
0.0261 |
| 50 |
49.99 |
100% |
0.0219 |
| 75 |
75.80 |
101.1% |
0.0210 |
| Distilled water |
25 |
25.59 |
95.40% |
0.0204 |
| 50 |
50.61 |
100.4% |
0.0218 |
| 75 |
74.59 |
101.20% |
0.0220 |
2.12 Cytotoxicity study
The MTT assay of probe 5 to HeLa cells was measured by a standard, 3-[4,5-dimethylthiazol-2-yl] 2,5-diphenyltetrazolium bromide (MTT), which is a yellow colored water-soluble salt. A mitochondrial enzyme in living cells, succinate-dehydrogenase, cleaves the tetrazolium ring, converting MTT to insoluble purple formazan. Therefore, the amount of formazan produced is directly proportional to the number of viable cells. After 48 h of incubation, 15 μL of MTT (5 mg mL−1) in phosphate-buffered saline (PBS) was added to each well and incubated at 37 °C for 4 h. The medium with MTT was then flicked off and the formazan crystals formed were solubilized in 100 μL of DMSO. Absorbance was then measured at 570 nm using a microplate. The obtained results indicated that the receptors are non-toxic to the cells under experimental conditions (ESI† Fig. S9). The bright field and fluorescence images were taken through fluorescence microscopy with excitation at 365 to 450 (±10) nm. HeLa cells were incubated with probe 5 for 10 min at room temperature; they displayed yellowish-green fluorescence in the intracellular region. Upon further incubation of cells with Hg2+ for another 10 min, they exhibited decreasing intracellular fluorescence, indicating that the intracellular uptake of Hg2+ resulted in the proposed desulfurization mechanism and was confirmed by the detection of Hg2+ in the intracellular region (Fig. 9). This study result provides important aspects for the development of a new probe for Hg2+ detection in living cells by fluorescence imaging.
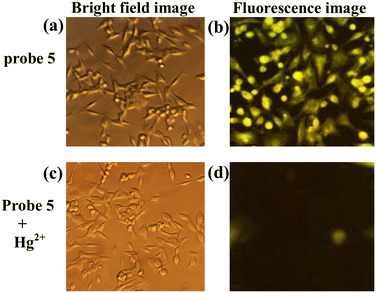 |
| | Fig. 9 Cell imaging with probe 5 and probe 5+Hg2+ in HeLa cells. (a) and (b) Bright field and fluorescence image of HeLa cells loaded with probe 5 (20 μM) for 10 minutes. (c) and (d) Bright field and fluorescence image of cells incubated with probe 5 (20 μM) further exposed to Hg2+ (10 μM) for 10 minutes. | |
2.13 Cell imaging assay
The probe sensing system was used for in vitro imaging of mercury in live HeLa cells. HeLa cells were obtained from NCCS, Pune. The cells were cultured in Dulbecco's modified Eagle medium (DMEM) with 100 U mL−1 penicillin, 10% fetal bovine serum (FBS), and 100 mg mL−1 streptomycin under 5% CO2 at 37 °C. After 24 h of incubation in DMEM, 20 μL of the probe (10 μM) was incubated with 980 μL of a cell solution in DMEM for 10 min at 37 °C, and the cells were washed thrice with PBS buffer solution (10 mM, pH 7.4). The fluorescence imaging of cells was performed on a confocal microscope. Afterward, 1.0 mL of different concentrations of Hg2+ solutions (5 and 10 μM) in PBS buffer (10 mM, pH 7.4) was added to the above cells for incubation for another 10 min. The cells were then washed thrice with PBS buffer solution (10 mM, pH 7.4), and fluorescence imaging of the cells was carried out. The excitation and emission wavelengths were kept at 365 nm and 450 (±10) nm, respectively.
3. Conclusion
The overall objective of this work was to design and synthesize a new probe for the detection of Hg2+ in CH3CN![[thin space (1/6-em)]](https://www.rsc.org/images/entities/char_2009.gif) :
:![[thin space (1/6-em)]](https://www.rsc.org/images/entities/char_2009.gif) H2O (8
H2O (8![[thin space (1/6-em)]](https://www.rsc.org/images/entities/char_2009.gif) :
:![[thin space (1/6-em)]](https://www.rsc.org/images/entities/char_2009.gif) 2, v/v) solution using 2-(4-(1,3-dithian-2-yl) phenyl)-4,5-diphenyl-1H-imidazole as an indicator. In the presence of other metal ions, sensor 5 showed a unique colorimetric and fluorescence turn-off response, showing that it has higher selectivity than other metal ions. Fluorescence color can be observed under UV light at 365 nm with significant changes. A detection limit of 5.3 nM was calculated for compound 5. According to WHO guidelines, the LOD was well below the maximum acceptable limit in drinking water. By using 1H NMR titration and DFT studies, the sensing mechanism of the reaction was verified. Additionally, probe 5 detected Hg2+ ions in both living cells and environmental water samples. Further, test strips were made based on compound 5, which also showed superior selectivity for Hg2+ in organic semi-aqueous solutions. Test paper strips could serve as a feasible and convenient method of detecting Hg2+ in test kits.
2, v/v) solution using 2-(4-(1,3-dithian-2-yl) phenyl)-4,5-diphenyl-1H-imidazole as an indicator. In the presence of other metal ions, sensor 5 showed a unique colorimetric and fluorescence turn-off response, showing that it has higher selectivity than other metal ions. Fluorescence color can be observed under UV light at 365 nm with significant changes. A detection limit of 5.3 nM was calculated for compound 5. According to WHO guidelines, the LOD was well below the maximum acceptable limit in drinking water. By using 1H NMR titration and DFT studies, the sensing mechanism of the reaction was verified. Additionally, probe 5 detected Hg2+ ions in both living cells and environmental water samples. Further, test strips were made based on compound 5, which also showed superior selectivity for Hg2+ in organic semi-aqueous solutions. Test paper strips could serve as a feasible and convenient method of detecting Hg2+ in test kits.
4. Experimental section
4.1 Reagents
Benzil, terepthaldehyde, and nitrate salts of Cr3+, Li+, Cd2+, Hg2+, Na+, Ni2+, Pb2+, Al3+, Co2+, Ag+, Zn2+, Sr2+, Ba2+, Mg2+, Bi3+, Th4+, and Fe3+ were purchased from Fine Chemical Houses, Sigma Aldrich, and TCI. Other materials, such as NH4OAc, 1,3-propane dithiol, and solvents, such as C2H5OH, CH3CN, n-hexane, and ethyl acetate, were obtained from local chemical supplier, Avra Synthesis Pvt. Ltd and were used as such without further purifications. Double distilled water was used during the spectroscopic experiments.
4.2 General methods
We recorded the melting point values of synthesized compounds with the help of the digital melting point apparatus Deep Vision. We collected the NMR (1H NMR: 400 MHz and 13C NMR: 100 MHz) spectra on a Bruker NMR instrument in DMSO-d6. Jasco-4100 IR spectrophotometer was employed to record the FT-IR spectra. With the use of a WEXWOX fluorescence microscope 3000 with ultraviolet excitation, fluorescent bioimaging experiments were conducted. Waters-Xevo G2-XS-Q ToF was employed to record the HRMS spectrum. A Shimadzu UV-1700 spectrophotometer was used to record UV-vis absorption and the Hitachi F-2500 instrument was deployed to record emission spectra.
4.3 Spectroscopic procedure
The stock solution of free sensor 5 (1 mM) was prepared in CH3CN solvent and the solution of nitrate salts of Cr3+, Li+, Cd2+, Hg2+, Na+, Ni2+, Pb2+, Al3+, Co2+, Ag+, Zn2+, Sr2+, Ba2+, Mg2+, Bi3+, Th4+, and Fe3+ were prepared in double distilled water. The excitation wavelength was 320 nm and the excitation slit widths were 5 nm.
4.4 Limit of detection
The limit of detection (LOD)50 was found using the following expression based on the literature:
Therein, σ = standard deviation of the sensor for blank measurements (n = 10), s = slope value obtained from the linear plot (fluorescence intensity of 5versus the amount of Hg2+).
4.5 Quantum yield
The emission quantum yield of sensor 5 with and without the introduction of Hg2+ ion was calculated by comparison with quinine sulfate51 as the standard reference in sulfuric acid as per the following equation:
| ϕu = ϕsXASXFUXn2/AUXFSXn02 |
Where ϕu and ϕs are quantum yields for the sample and reference, FU and FS are the integrated areas under the corrected fluorescence spectra for the sample and reference; AU and AS are the absorbance for the sample and reference, n and n0 are the refractive indexes of the solvents used for samples and reference. The quantum yield of probe 5 was 1.01. After the addition of the Hg2+ ion, the quantum yield decreased to 0.293.
4.6 Synthesis of 4-(4,5-diphenyl-1H-imidazol-2-yl) benzaldehyde (3)
Benzaldehyde (3) was prepared by a previously reported procedure.521H NMR [400 MHz, DMSO-d6]: 7.25 (d, 2H, J = 5.2 Hz, ArCH), 7.33 (s, 2H, ArCH), 7.41 (d, 2H, J = 5.6 Hz, ArCH), 7.47 (s, 2H, ArCH), 7.53 (d, 2H, J = 9.6 Hz, ArCH), 8.01 (d, 2H, J = 8 Hz, ArCH), 8.30 (d, 2H, J = 8.8 Hz, ArCH), 10.03 (s, 1H, CHO), 13.02 (s, 1H, NH); 13C NMR[100 MHz, DMSO-d6]: 125.8 (2 × ArCH), 127.2 (2 × ArCH), 127.5 (2 × ArCH), 128.7 (2 × ArCH), 129.0 (4 × ArCH), 129.1 (2 × ArC), 130.0 (2 × ArCH), 130.5 (ArC), 135.8 (2 × ArC), 135.9 (ArC), 144.6 (ArC), 192.9 (ArCHO). GCMS for C22H16N2O calculated m/z: [M]+ 324.3830; found: 324.4087 (ESI† Fig. S3).
4.7 Synthesis of 2-(4-(1,3-dithian-2-yl)phenyl)-4,5-diphenyl-1H-imidazole (5)
A mixture of diphenylimidazobenzaldehyde 3 (0.5 g, 1.0 equiv.) and 1,3-propane dithiol 4 (0.121 mL, 1.2 equivalent) were refluxed at 90 °C in ethanol solvent for 12 h. After cooling, the solvent was removed from the vacuum. The resultant residue was purified by column chromatography using hexane/ethyl acetate (90![[thin space (1/6-em)]](https://www.rsc.org/images/entities/char_2009.gif) :
:![[thin space (1/6-em)]](https://www.rsc.org/images/entities/char_2009.gif) 10, v/v) to afford compound 5 as a white solid (0.58 g). Yield: 65%; melting point: 238–240 °C. FT-IR (cm−1): 3061.03, 2904.80, 1695.43, 1604.77, 1487.12, 1442.75, 1413.82, 1323.17, 1274.95, 1207.44, 1170.79, 1126.43, 1068.56, 970.19, 912.33, 850.61, 831.32, 765.74, 734.88, 694.37, 673.16, 603.72, 513.07, and 422.41. 1H NMR [400 MHz, DMSO-d6]: 1.704 (m, 2H, J = 2.8 Hz, CH2), 2.138 (m, 2H, J = 2 Hz, CH2), 2.894 (m, 2H, J = 3.6 Hz, CH2), 5.457 (s, 1H, J = 6.4 Hz, CH), 7.274 (t, 2H, J = 8 Hz, CH), 7.331 (t, 1H, J = 14.8 Hz, CH), 7.403 (t, 2H, J = 12.4 Hz, CH), 7.472 (m, 7H, J = 12.8 Hz, CH), 8.059 (d, 2H, J = 8.4 Hz, CH), 12.719 (s, 1H, NH); 13C NMR [100 MHz, DMSO-d6]: 25.24 (CH2), 31.49 (2 × CH2), 50.23 (CH), 125.95 (2 × ArCH), 127.02 (2 × ArCH), 127.54 (2 × Ar–CH), 128.29 (ArCH), 128.42 (ArCH), 128.66 (2 × ArCH), 128.90 (2 × ArCH), 129.13 (2 × Ar–CH), 130.73 (2 × Ar–CH), 135.56 (ArC), 137.70 (2 × ArC), 139.84 (C), 145.51 (ArC). HRMS (ESI/TOF-Q) for C25H22N2S2 calculated [M+] m/z was 414.1224, found: 414.1280.
10, v/v) to afford compound 5 as a white solid (0.58 g). Yield: 65%; melting point: 238–240 °C. FT-IR (cm−1): 3061.03, 2904.80, 1695.43, 1604.77, 1487.12, 1442.75, 1413.82, 1323.17, 1274.95, 1207.44, 1170.79, 1126.43, 1068.56, 970.19, 912.33, 850.61, 831.32, 765.74, 734.88, 694.37, 673.16, 603.72, 513.07, and 422.41. 1H NMR [400 MHz, DMSO-d6]: 1.704 (m, 2H, J = 2.8 Hz, CH2), 2.138 (m, 2H, J = 2 Hz, CH2), 2.894 (m, 2H, J = 3.6 Hz, CH2), 5.457 (s, 1H, J = 6.4 Hz, CH), 7.274 (t, 2H, J = 8 Hz, CH), 7.331 (t, 1H, J = 14.8 Hz, CH), 7.403 (t, 2H, J = 12.4 Hz, CH), 7.472 (m, 7H, J = 12.8 Hz, CH), 8.059 (d, 2H, J = 8.4 Hz, CH), 12.719 (s, 1H, NH); 13C NMR [100 MHz, DMSO-d6]: 25.24 (CH2), 31.49 (2 × CH2), 50.23 (CH), 125.95 (2 × ArCH), 127.02 (2 × ArCH), 127.54 (2 × Ar–CH), 128.29 (ArCH), 128.42 (ArCH), 128.66 (2 × ArCH), 128.90 (2 × ArCH), 129.13 (2 × Ar–CH), 130.73 (2 × Ar–CH), 135.56 (ArC), 137.70 (2 × ArC), 139.84 (C), 145.51 (ArC). HRMS (ESI/TOF-Q) for C25H22N2S2 calculated [M+] m/z was 414.1224, found: 414.1280.
Conflicts of interest
The authors report no declarations of interest.
Acknowledgements
Uma Krishnan is deeply grateful for the financial support she has received from VIT in the form of a Research Associateship. It is important to acknowledge the contribution of VIT-SIF and IIT Madras to the characterization studies. For language polishing, the authors thank Dr. R. Srinivasan, VIT-SSL.
Notes and references
- W. Lin, L. Yuan, W. Tan, J. Feng and L. Long, Chem. – Eur. J., 2009, 15, 1030–1035 CrossRef CAS PubMed.
- Y. Guo, J. An, H. Tang, M. Peng and F. Suzenet, Mater. Res. Bull., 2015, 63, 155–163 CrossRef CAS.
- E. Bozkurt and H. I. Gul, Sens. Actuators, B, 2018, 255, 814–825 CrossRef CAS.
- K. M. Vengaian, C. D. Britto, K. Sekar, G. Sivaraman and S. Singaravadivel, Sens. Actuators, B, 2016, 235, 232–240 CrossRef CAS.
- Z. Wang, Y. Zhang, J. Yin, Y. Yang, H. Luo, J. Song, X. Xu and S. Wang, ACS Sustainable Chem. Eng., 2020, 8, 12348–12359 CrossRef CAS.
- A. Chatterjee, M. Banerjee, D. G. Khandare, R. U. Gawas, S. C. Mascarenhas, A. Ganguly, R. Gupta and H. Joshi, Anal. Chem., 2017, 89, 12698–12704 CrossRef CAS.
- X. Xu, Y.-F. Li, J. Zhao, Y. Li, J. Lin, B. Li, Y. Gao and C. Chen, Analyst, 2015, 140, 7841–7853 RSC.
- A. Singh, S. Kaur, N. Singh and N. Kaur, Org. Biomol. Chem., 2014, 12, 2302–2309 RSC.
- J. Hu, J. Li, J. Qi and J. Chen, New J. Chem., 2015, 39, 843–848 RSC.
- S. K. Patil and D. Das, Spectrochim. Acta, Part A, 2019, 210, 44–51 CrossRef CAS PubMed.
- P. Cas, J. Shanmugapriya, S. Singaravadivel, G. Sivaraman and D. Chellappa, ACS Omega, 2018, 3, 12341–12348 CrossRef.
- U. Krishnan and S. K. Iyer, J. Photochem. Photobiol., A, 2022, 425, 113663 CrossRef CAS.
- C. Parthiban, R. Manivannan and K. P. Elango, Dalton Trans., 2015, 44, 3259–3264 RSC.
- S. Lei, X. Meng, L. Wang, J. Zhou, D. Qin and H. Duan, ChemistryOpen, 2021, 10, 1116–1122 CrossRef CAS PubMed.
- A. Picard-Lafond, D. Larivière and D. Boudreau, ACS Omega, 2019, 5, 701–711 CrossRef.
- J. Orrego-Hernández, J. Cobo and J. Portilla, ACS Omega, 2019, 4, 16689–16700 CrossRef.
- J. Pan, J. Ma, L. Liu, D. Li, Y. Huo and H. Liu, J. Photochem. Photobiol., A, 2021, 416, 113322 CrossRef CAS.
- Y. Li, W. Shi, J. Ma, X. Wang, X. Kong, Y. Zhang, L. Feng, Y. Hui and Z. Xie, J. Photochem. Photobiol., A, 2017, 338, 1–7 CrossRef CAS.
- Y. Yang, Y. Feng, Y.-Z. Wang, F.-Z. Qiu, X.-L. Tang, G.-L. Zhang and W.-S. Liu, Sens. Actuators, B, 2017, 253, 1055–1062 CrossRef CAS.
- Z. Ma, D. Zhang, J. Guo, M. Li, T. Wang, H. Yin, H. Wang and J. Liu, Inorg. Chem. Commun., 2021, 130, 108753 CrossRef CAS.
- E. M. Nolan, M. E. Racine and S. J. Lippard, Inorg. Chem., 2006, 45, 2742–2749 CrossRef CAS PubMed.
- A. Pariyar, S. Bose, S. S. Chhetri, A. N. Biswas and P. Bandyopadhyay, Dalton Trans., 2012, 41, 3826–3831 RSC.
- Y. Zhao, Z. Lin, C. He, H. Wu and C. Duan, Inorg. Chem., 2006, 45, 10013–10015 CrossRef CAS PubMed.
- S.-M. Cheung and W.-H. Chan, Tetrahedron, 2006, 62, 8379–8383 CrossRef CAS.
- V. Tekuri, S. K. Sahoo and D. R. Trivedi, Spectrochim. Acta, Part A, 2019, 218, 19–26 CrossRef CAS PubMed.
- T. G. Akshay Krishna, V. Tekuri, M. Mohan and D. R. Trivedi, Sens. Actuators, B, 2019, 284, 271–280 CrossRef CAS.
- R. R. Koner, S. Sinha, S. Kumar, C. K. Nandi and S. Ghosh, Tetrahedron Lett., 2012, 53, 2302–2307 CrossRef CAS.
- L. Lu, X. Han, J. Lin, Y. Zhang, M. Qiu, Y. Chen, M. Li and D. Tang, Analyst, 2021, 146, 2664–2669 RSC.
- M. Xu, Z. Gao, Q. Wei, G. Chen and D. Tang, Biosens. Bioelectron., 2016, 79, 411–415 CrossRef CAS PubMed.
- Z. Qiu, J. Shu, G. Jin, M. Xu, Q. Wei, G. Chen and D. Tang, Biosens. Bioelectron., 2016, 77, 681–686 CrossRef CAS.
- Z. Qiu, D. Tang, J. Shu, G. Chen and D. Tang, Biosens. Bioelectron., 2016, 75, 108–115 CrossRef CAS PubMed.
- L. Huang, W. Sheng, L. Wang, X. Meng, H. Duan and L. Chi, RSC Adv., 2021, 11, 23597–23606 RSC.
- J. Isaad and A. El Achari, J. Lumin., 2022, 243, 118668 CrossRef CAS.
- S. De and G. Das, Dyes Pigm., 2021, 195, 109659 CrossRef CAS.
- J. Xu, Y. Liu and M.-J. Li, Spectrochim. Acta, Part A, 2019, 219, 141–146 CrossRef CAS PubMed.
- X. Li, D. Xiu, J. Shi, J. Miao, Y. Yu, H. Song, J. Lin, Q. Feng and H. Yu, Spectrochim. Acta, Part A, 2022, 265, 120367 CrossRef CAS PubMed.
- J. Wang, Q. Niu, T. Hu, T. Li and T. Wei, J. Photochem. Photobiol., A, 2019, 384, 112036 CrossRef CAS.
- A. Sarkar, S. Chakraborty, S. Lohar, E. Ahmmed, N. C. Saha, S. K. Mandal, K. Dhara and P. Chattopadhyay, Chem. Res. Toxicol., 2019, 32, 1144–1150 Search PubMed.
- A. K. Atta, S.-B. Kim, J. Heo and D.-G. Cho, Org. Lett., 2013, 15, 1072–1075 CrossRef CAS PubMed.
- L. N. Neupane, J.-Y. Park, J. H. Park and K.-H. Lee, Org. Lett., 2013, 15, 254–257 CrossRef CAS PubMed.
- M.-H. Yang, P. Thirupathi and K.-H. Lee, Org. Lett., 2011, 13, 5028–5031 CrossRef CAS PubMed.
- L. Chen, L. Yang, H. Li, Y. Gao, D. Deng, Y. Wu and L.-j. Ma, Inorg. Chem., 2011, 50, 10028–10032 CrossRef CAS PubMed.
- S.-K. Chung, Y.-R. Tseng, C.-Y. Chen and S.-S. Sun, Inorg. Chem., 2011, 50, 2711–2713 CrossRef CAS PubMed.
- A. Panda, Y. Yang, S. Venkateswarlu, Y. Son, T.-H. Bae and M. Yoon, Microporous Mesoporous Mater., 2020, 306, 110399 CrossRef CAS.
- M. Shellaiah and K.-W. Sun, Chemosensors, 2021, 9, 101 CrossRef CAS.
- D. Dai, J. Yang, Y. Wang and Y. W. Yang, Adv. Funct. Mater., 2021, 31, 2006168 CrossRef CAS.
- A. L. Suherman, E. E. Tanner and R. G. Compton, TrAC, Trends Anal. Chem., 2017, 94, 161–172 CrossRef CAS.
- M. Shellaiah, T. Simon, P. Venkatesan, K. W. Sun, F.-H. Ko and S.-P. Wu, Appl. Surf. Sci., 2019, 465, 340–350 CrossRef CAS.
- B. Sarkar and P. Mondal, J. Water Environ. Nanotechnol., 2021, 6, 22–40 CAS.
- N. Kaur, G. Dhaka and J. Singh, New J. Chem., 2015, 39, 6125–6129 RSC.
- H. A. Benesi and J. Hildebrand, J. Am. Chem. Soc., 1949, 71, 2703–2707 CrossRef CAS.
- J. Hao, L. Ruhlmann, Y. Zhu, Q. Li and Y. Wei, Inorg. Chem., 2007, 46, 4960–4967 CrossRef CAS PubMed.
- C. Adamo and D. Jacquemin, Chem. Soc. Rev., 2013, 42, 845–856 RSC.
- P. Wen, Z. Gao, R. Zhang, A. Li, F. Zhang, J. Li, J. Xie, Y. Wu, M. Wu and K. Guo, J. Mater. Chem. C, 2017, 5, 6136–6143 RSC.
Footnote |
| † Electronic supplementary information (ESI) available: Copies of 1H/13C NMR spectra for the probe and its complex, results of NMR titration, and FT-IR spectra are included. See DOI: https://doi.org/10.1039/d3sd00146f |
|
| This journal is © The Royal Society of Chemistry 2024 |
Click here to see how this site uses Cookies. View our privacy policy here.  Open Access Article
 *a
*a

![[thin space (1/6-em)]](https://www.rsc.org/images/entities/char_2009.gif) :
:![[thin space (1/6-em)]](https://www.rsc.org/images/entities/char_2009.gif) 2, v/v) as the medium. Sensor compound 5 had maximum absorption around 260–360 nm related to π–π* transitions, making the compound solution colorless. The changes in the absorption maximum with the introduction of various metal ions, including Cr3+, Li+, Cd2+, Hg2+, Na+, Ni2+, Pb2+, Al3+, Co2+, Ag+, Zn2+, Sr2+, Ba2+, Mg2+, Bi3+, Th4+ and Fe3+ are described (Fig. 1). Upon the addition of 100 μL of Hg2+ ion, the absorption spectrum of compound 5 exhibited a marked red shift when compared to probe 3. This red shift was attributed to ICT. In addition, the red shift in absorption indicates that, indeed, the aldehyde group acts as an electron-withdrawing group in the ICT process. To assess probe 5 as a colorimetric sensor for Hg2+, titrations were performed with successive additions of Hg2+ (0 to 1.6 equiv.) to a solution of probe 5. With the addition of increasing amounts of Hg2+ the absorbance at 315 nm decreased gradually while a new absorption band at 233 nm (blue shift) developed, which induced a color change from colorless to light yellow, due to the internal charge transfer (ICT) between sulfur group attached probe 5 towards Hg2+ ion. The isosbestic absorption point was observed at 220 nm upon the addition of Hg2+, which indicated a large wavelength shift in the isosbestic point with clear reproduction of compound 3.
2, v/v) as the medium. Sensor compound 5 had maximum absorption around 260–360 nm related to π–π* transitions, making the compound solution colorless. The changes in the absorption maximum with the introduction of various metal ions, including Cr3+, Li+, Cd2+, Hg2+, Na+, Ni2+, Pb2+, Al3+, Co2+, Ag+, Zn2+, Sr2+, Ba2+, Mg2+, Bi3+, Th4+ and Fe3+ are described (Fig. 1). Upon the addition of 100 μL of Hg2+ ion, the absorption spectrum of compound 5 exhibited a marked red shift when compared to probe 3. This red shift was attributed to ICT. In addition, the red shift in absorption indicates that, indeed, the aldehyde group acts as an electron-withdrawing group in the ICT process. To assess probe 5 as a colorimetric sensor for Hg2+, titrations were performed with successive additions of Hg2+ (0 to 1.6 equiv.) to a solution of probe 5. With the addition of increasing amounts of Hg2+ the absorbance at 315 nm decreased gradually while a new absorption band at 233 nm (blue shift) developed, which induced a color change from colorless to light yellow, due to the internal charge transfer (ICT) between sulfur group attached probe 5 towards Hg2+ ion. The isosbestic absorption point was observed at 220 nm upon the addition of Hg2+, which indicated a large wavelength shift in the isosbestic point with clear reproduction of compound 3.
![[thin space (1/6-em)]](https://www.rsc.org/images/entities/char_2009.gif) :
:![[thin space (1/6-em)]](https://www.rsc.org/images/entities/char_2009.gif) 2, v/v) system. Probe 5 displayed high emission intensity with a longer wavelength at 340–475 nm. Except Hg2+, other competing metal ions, such as Cr3+, Li+, Cd2+, Hg2+, Na+, Ni2+, Pb2+, Al3+, Co2+, Ag+, Zn2+, Sr2+, Ba2+, Mg2+, Bi3+, Th4+ and Fe3+ did not show any spectral changes. The introduction of Hg2+ ion resulted in quenching of an intense emission peak at 385 nm as shown in Fig. 2a. The emission titration of compound 5 with 0 to 1.6 equivalent of Hg2+ ion step-by-step showed quenching of the fluorescence emission at 385 nm with a linear relationship between the concentration of Hg2+ and a decrease in the intensity of fluorescence. Due to the electron-rich nature, the thioacetal group could be easily eliminated by Hg2+ to release the electron-seeking aldehydic group resulting in a strong push–pull electron system. Furthermore, the detection limit of probe 5 toward Hg2+ was measured by plotting emission intensity against the concentration of Hg2+ ion. This plot showed good linearity (ESI† Fig. S4), and a detection limit of 5.3 nM was found, which is reasonably low for the limit of detection of Hg2+ in comparison with earlier reports on sensor performance (ESI† Table S1).
2, v/v) system. Probe 5 displayed high emission intensity with a longer wavelength at 340–475 nm. Except Hg2+, other competing metal ions, such as Cr3+, Li+, Cd2+, Hg2+, Na+, Ni2+, Pb2+, Al3+, Co2+, Ag+, Zn2+, Sr2+, Ba2+, Mg2+, Bi3+, Th4+ and Fe3+ did not show any spectral changes. The introduction of Hg2+ ion resulted in quenching of an intense emission peak at 385 nm as shown in Fig. 2a. The emission titration of compound 5 with 0 to 1.6 equivalent of Hg2+ ion step-by-step showed quenching of the fluorescence emission at 385 nm with a linear relationship between the concentration of Hg2+ and a decrease in the intensity of fluorescence. Due to the electron-rich nature, the thioacetal group could be easily eliminated by Hg2+ to release the electron-seeking aldehydic group resulting in a strong push–pull electron system. Furthermore, the detection limit of probe 5 toward Hg2+ was measured by plotting emission intensity against the concentration of Hg2+ ion. This plot showed good linearity (ESI† Fig. S4), and a detection limit of 5.3 nM was found, which is reasonably low for the limit of detection of Hg2+ in comparison with earlier reports on sensor performance (ESI† Table S1).
![[double bond, length as m-dash]](https://www.rsc.org/images/entities/char_e001.gif) O and C(
O and C(![[double bond, length as m-dash]](https://www.rsc.org/images/entities/char_e001.gif) O)–H groups, respectively. In line with probe 3, this result was also obtained. Moreover, the analysis of the HRMS spectrum of the probe clearly illustrates that the molecular ion peak was found at m/z 414.1380 but was changed to m/z 324.2122 when Hg2+ ions were introduced (ESI† Fig. S8). This is the same as compound 3 (ESI† Fig. S10), which confirms the deprotection of thiols in the presence of Hg2+ ions, which frees up an aldehyde group (Scheme 2).
O)–H groups, respectively. In line with probe 3, this result was also obtained. Moreover, the analysis of the HRMS spectrum of the probe clearly illustrates that the molecular ion peak was found at m/z 414.1380 but was changed to m/z 324.2122 when Hg2+ ions were introduced (ESI† Fig. S8). This is the same as compound 3 (ESI† Fig. S10), which confirms the deprotection of thiols in the presence of Hg2+ ions, which frees up an aldehyde group (Scheme 2).
![[thin space (1/6-em)]](https://www.rsc.org/images/entities/char_2009.gif) :
:![[thin space (1/6-em)]](https://www.rsc.org/images/entities/char_2009.gif) 2).
2).
![[thin space (1/6-em)]](https://www.rsc.org/images/entities/char_2009.gif) :
:![[thin space (1/6-em)]](https://www.rsc.org/images/entities/char_2009.gif) H2O (8
H2O (8![[thin space (1/6-em)]](https://www.rsc.org/images/entities/char_2009.gif) :
:![[thin space (1/6-em)]](https://www.rsc.org/images/entities/char_2009.gif) 2, v/v) solution using 2-(4-(1,3-dithian-2-yl) phenyl)-4,5-diphenyl-1H-imidazole as an indicator. In the presence of other metal ions, sensor 5 showed a unique colorimetric and fluorescence turn-off response, showing that it has higher selectivity than other metal ions. Fluorescence color can be observed under UV light at 365 nm with significant changes. A detection limit of 5.3 nM was calculated for compound 5. According to WHO guidelines, the LOD was well below the maximum acceptable limit in drinking water. By using 1H NMR titration and DFT studies, the sensing mechanism of the reaction was verified. Additionally, probe 5 detected Hg2+ ions in both living cells and environmental water samples. Further, test strips were made based on compound 5, which also showed superior selectivity for Hg2+ in organic semi-aqueous solutions. Test paper strips could serve as a feasible and convenient method of detecting Hg2+ in test kits.
2, v/v) solution using 2-(4-(1,3-dithian-2-yl) phenyl)-4,5-diphenyl-1H-imidazole as an indicator. In the presence of other metal ions, sensor 5 showed a unique colorimetric and fluorescence turn-off response, showing that it has higher selectivity than other metal ions. Fluorescence color can be observed under UV light at 365 nm with significant changes. A detection limit of 5.3 nM was calculated for compound 5. According to WHO guidelines, the LOD was well below the maximum acceptable limit in drinking water. By using 1H NMR titration and DFT studies, the sensing mechanism of the reaction was verified. Additionally, probe 5 detected Hg2+ ions in both living cells and environmental water samples. Further, test strips were made based on compound 5, which also showed superior selectivity for Hg2+ in organic semi-aqueous solutions. Test paper strips could serve as a feasible and convenient method of detecting Hg2+ in test kits.
![[thin space (1/6-em)]](https://www.rsc.org/images/entities/char_2009.gif) :
:![[thin space (1/6-em)]](https://www.rsc.org/images/entities/char_2009.gif) 10, v/v) to afford compound 5 as a white solid (0.58 g). Yield: 65%; melting point: 238–240 °C. FT-IR (cm−1): 3061.03, 2904.80, 1695.43, 1604.77, 1487.12, 1442.75, 1413.82, 1323.17, 1274.95, 1207.44, 1170.79, 1126.43, 1068.56, 970.19, 912.33, 850.61, 831.32, 765.74, 734.88, 694.37, 673.16, 603.72, 513.07, and 422.41. 1H NMR [400 MHz, DMSO-d6]: 1.704 (m, 2H, J = 2.8 Hz, CH2), 2.138 (m, 2H, J = 2 Hz, CH2), 2.894 (m, 2H, J = 3.6 Hz, CH2), 5.457 (s, 1H, J = 6.4 Hz, CH), 7.274 (t, 2H, J = 8 Hz, CH), 7.331 (t, 1H, J = 14.8 Hz, CH), 7.403 (t, 2H, J = 12.4 Hz, CH), 7.472 (m, 7H, J = 12.8 Hz, CH), 8.059 (d, 2H, J = 8.4 Hz, CH), 12.719 (s, 1H, NH); 13C NMR [100 MHz, DMSO-d6]: 25.24 (CH2), 31.49 (2 × CH2), 50.23 (CH), 125.95 (2 × ArCH), 127.02 (2 × ArCH), 127.54 (2 × Ar–CH), 128.29 (ArCH), 128.42 (ArCH), 128.66 (2 × ArCH), 128.90 (2 × ArCH), 129.13 (2 × Ar–CH), 130.73 (2 × Ar–CH), 135.56 (ArC), 137.70 (2 × ArC), 139.84 (C), 145.51 (ArC). HRMS (ESI/TOF-Q) for C25H22N2S2 calculated [M+] m/z was 414.1224, found: 414.1280.
10, v/v) to afford compound 5 as a white solid (0.58 g). Yield: 65%; melting point: 238–240 °C. FT-IR (cm−1): 3061.03, 2904.80, 1695.43, 1604.77, 1487.12, 1442.75, 1413.82, 1323.17, 1274.95, 1207.44, 1170.79, 1126.43, 1068.56, 970.19, 912.33, 850.61, 831.32, 765.74, 734.88, 694.37, 673.16, 603.72, 513.07, and 422.41. 1H NMR [400 MHz, DMSO-d6]: 1.704 (m, 2H, J = 2.8 Hz, CH2), 2.138 (m, 2H, J = 2 Hz, CH2), 2.894 (m, 2H, J = 3.6 Hz, CH2), 5.457 (s, 1H, J = 6.4 Hz, CH), 7.274 (t, 2H, J = 8 Hz, CH), 7.331 (t, 1H, J = 14.8 Hz, CH), 7.403 (t, 2H, J = 12.4 Hz, CH), 7.472 (m, 7H, J = 12.8 Hz, CH), 8.059 (d, 2H, J = 8.4 Hz, CH), 12.719 (s, 1H, NH); 13C NMR [100 MHz, DMSO-d6]: 25.24 (CH2), 31.49 (2 × CH2), 50.23 (CH), 125.95 (2 × ArCH), 127.02 (2 × ArCH), 127.54 (2 × Ar–CH), 128.29 (ArCH), 128.42 (ArCH), 128.66 (2 × ArCH), 128.90 (2 × ArCH), 129.13 (2 × Ar–CH), 130.73 (2 × Ar–CH), 135.56 (ArC), 137.70 (2 × ArC), 139.84 (C), 145.51 (ArC). HRMS (ESI/TOF-Q) for C25H22N2S2 calculated [M+] m/z was 414.1224, found: 414.1280.


