 Open Access Article
The impact of viscosity asymmetry on phase separating binary mixtures with suspended colloids†
Javeria
Siddiqui
a,
Joan
Codina
ab,
Ignacio
Pagonabarraga
 cd and
Jure
Dobnikar
 *aef
*aef
aCAS Key Laboratory of Soft Matter Physics, Institute of Physics, Chinese Academy of Sciences, Beijing 100190, China. E-mail: jd489@cam.ac.uk
bWenzhou Institute of the University of Chinese Academy of Sciences, Wenzhou, Zhejiang, China. E-mail: jocodina@gmail.com
cDepartament de Física de la Matèria Condensada, Universitat de Barcelona, Martí i Franqués 1, 08028 Barcelona, Spain. E-mail: ipagonabarraga@ub.edu
dUniversitat de Barcelona Institute of Complex Systems (UBICS), Universitat de Barcelona, 08028 Barcelona, Spain
eSchool of Physical Sciences, University of Chinese Academy of Sciences, Beijing 100049, China
fSongshan Lake Materials Laboratory, Dongguan, Guangdong 523808, China
First published on 20th June 2024
Abstract
The introduction of neutrally wetting colloidal particles into coarsening binary fluids is known to arrest the dynamics of the phase separation, as the colloids tend to be captured by the growing interfaces to reduce the free energy of the system. This phenomenon has often been studied in systems with symmetric fluid viscosities. In this study, we investigate the behavior of colloidal particles introduced into asymmetric binary fluids with a viscosity contrast. Our results show that due to the broken symmetry the colloidal particles more easily escape from the interface towards the more viscous fluid, which reduces the lifetime of the jammed phase. Moreover, the presence of colloidal particles near the interfaces promotes the formation of micro-droplets with typical sizes comparable to the colloids.
1 Introduction
Manipulation of non-equilibrium processes is a convenient tool for designing the self-assembly of novel meso-structured materials.1–3 Directing the assembly protocol provides controlled access to metastable configurations that often exhibit more robust mechanical properties than their equilibrium counterparts. A classical example of this process is spinodal decomposition of a binary mixture, where two immiscible fluids, initially homogeneously mixed, start phase separating and forming domains with a variety of topological features. The morphologies of the domains and their time evolution depend on the proportion of the two fluids and their physicochemical properties. Symmetric binary mixtures (composed of liquids with the same properties) have been extensively studied. If the two fluids are present in a similar amount, the system develops interpenetrating domains that coarsen in time following a universal dynamic scaling law.4 If one of the two liquids is a majority phase, then droplets of the minority phase form, which subsequently grow and coalesce.5 The addition of colloids with similar affinities for the two liquid phases strongly affects the demixing dynamics, and the stability of the observed structures. Previous studies have established a kinetic pathway to a bicontinuous interfacially jammed emulsion gel (Bijel) composed of two interpenetrating bicontinuous fluid domains frozen by a densely jammed monolayer of colloidal particles at the fluid–fluid interface.6 Bijels are soft-solid materials7 with highly tunable mechanical properties such as elasticity.Asymmetric binary mixtures composed of two components with different physical properties (closer to real-world situations) have been much less explored. Experiments with particle-stabilized asymmetric binary mixtures8 suggest that the viscosity contrast, in combination with the properties and amount of the colloidal particles, can be a good control parameter governing the complex assembly process that leads to the asymmetric formation of droplets of one fluid within the other. In this paper, we perform lattice Boltzmann simulations to computationally investigate the formation of bijels and droplets in particle-stabilized binary fluids with a viscosity contrast. We first compare the separation process of a colloid-free binary mixture with asymmetric viscosities and establish how the asymmetry in the fluid viscosity affects the coarsening route and the dynamic scaling law with effective viscosity as a parameter. Later we analyze how the introduction of colloidal particles with various packing fractions slows the dynamics of the separation process. At constant effective viscosity and colloidal packing fraction, we explore the effect of neutrally-wetting colloids on the structure and stability of the fluid domains, and how such particles can be used to manipulate and control the formation of arrested morphologies.
2 Methods
2.1 The model
Our system consists of colloidal particles of radius a dispersed in a binary fluid mixture undergoing spinodal decomposition. We use a lattice-Boltzmann approach to model a suspension of colloidal particles9 and to describe the fluid hydrodynamics that recovers the Navier–Stokes equations.10 The phase separation process is captured solving the Cahn–Hilliard equation11,12 through a phase-field variable, ϕ, representing the composition field of the binary fluid. The coupling between the composition field, and the hydrodynamic stress has been introduced elsewhere.13 We confine our study to fluids with equal density ρ, but with a viscosity contrast λ = ηH/ηL, where ηH (high) and ηL (low) are the viscosities of the two components. Within the Lattice-Boltzmann approach, different viscosities are introduced as different relaxation times for each fluid component.The phase diagram of the binary mixture is controlled by the Landau free energy, F[ϕ] = Aϕ2/2 + Bϕ4/4 + κ(∇ϕ)2/2, where ϕ is the local order parameter defined across the system. The parameters A and B control the stability of the mixture; the specific choice B = −A > 0 leads to demixing with equally stable states ϕ = ±ϕ*. The fluid–fluid interfacial tension is given by σ = (−8κ/9)1/2, and the interface thickness by ξ = (2κ/B)1/2. We choose a deep quench in which the fluid–fluid interface is sharp on the scale of the colloidal particle, ξ < a.
The system is described by a lattice, composed of fluid and solid nodes, to describe the liquid mixture and suspended colloids. The lattice-Boltzmann and the Cahn–Hilliard equations are solved on the liquid nodes. Solid nodes are identified from the positions of the geometric centers of the colloidal particles. The surface of the colloid is determined by boundary links, which connect a solid node with a fluid one. The fluid nodes connected to a solid are referred to as surface nodes. The coupling between the fluid dynamics and the motion of the colloidal particles is provided by the bounce-back on links method.13–15
Fluid particles moving along a boundary link are reflected by the colloidal surface. As a result of the collision, momentum is locally exchanged between the fluid and the colloidal particles. The total hydrodynamic force on each colloid is computed by taking the sum over all boundary links defining the particle and used to compute the colloidal center of mass velocity in a self-consistent approach. At each time step, the position of the colloid is updated following an Euler forward step considering the old and updated velocities.
2.2 Simulation details
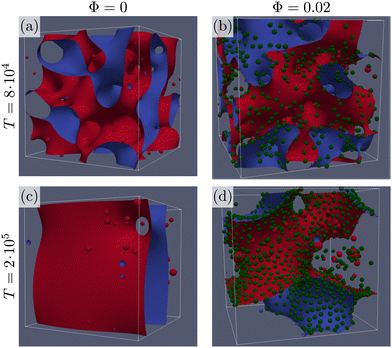
We fix the bulk free energy parameters to B = −A = 0.002, and κ = 1.4 × 10⁻³ resulting in equilibrium liquid phases at ϕ* = ±1, interfacial thickness ξ = 1.14, and fluid–fluid surface tension σ = 1.58 × 10⁻³. Colloids are neutrally wetting, and are introduced at a packing fraction Φ = 4Nπ(a/L)3/3, where N is the total number of colloids of radius a = 4.3 in lattice units.We perform lattice Boltzmann simulations16 using Ludwig10,17 on a cubic lattice of L = 256 sites with periodic boundary conditions. All simulations start from an initial homogeneous fluid with zero meaning uniform fluctuations up to ±10% of the equilibrium value, ϕ*. Colloids are initially positioned randomly avoiding overlaps. Examples of the simulations with and without colloidal particles, and their visualization, are shown in Fig. 1. The liquid–liquid interface is obtained as the surface where ϕ = 0, as interpolated from the nearby lattice nodes where ϕ changes sign. The interfacial region corresponds to the volume of the system where |ϕ| < 1/2. In Fig. 1, we visualize the liquid–liquid interface through two surfaces of constant values of the order parameter ϕ = −0.1 (red), and ϕ = 0.1 (blue). Colloidal particles are represented as green spheres. At short times, the snapshots in Fig. 1(a) and (b) show that the system is coarsening and colloidal particles are slowly captured by the interface of the growing domains. Even at a low packing fraction of colloidal particles (Φ = 0.02) we observe a large difference in the behavior at longer times: from the snapshots in Fig. 1(c) and (d) it is apparent that the colloidal particles adsorbed at the interface slow down the coarsening process. Additionally, some colloids that escape the interface can be found covering droplets in the bulk of the large domains.
2.3 Measuring the domain size
In the study of the kinetics of phase separation, it is important to consistently identify characteristic domain sizes. Since the systems we study typically exhibit a small number of domains of different shapes and sizes, the standard methods relying on Fourier transforms,18,19 and the geometry of interfaces4,20 do not resolve the characteristic length scales with sufficient precision. Here, we apply the so-called chord length method.21–23 We draw straight lines across the system, and define the segments belonging to the same fluid component (ϕ > 0 or ϕ < 0). Analyzing the statistics P(![[small script l]](https://www.rsc.org/images/entities/char_e146.gif) ) of the segment lengths
) of the segment lengths ![[small script l]](https://www.rsc.org/images/entities/char_e146.gif) enables us to extract the typical length-scales present in the system. In a separating system with many growing domains, the typical domain size is well captured by the mean
enables us to extract the typical length-scales present in the system. In a separating system with many growing domains, the typical domain size is well captured by the mean  . The domain size evolution follows three major stages: (i) order parameter diffusion and initiation of domains, T < Tinit, (ii) viscous domain growth regime, and (iii) saturation regime, T > Tsat, featuring macroscopic phase separation controlled by the finite system size. The initial waiting time Tinit depends on the initial conditions and in order to study the universal properties of the domain growth dynamics, we choose a sufficiently large time to avoid the regime (i). Empirically 〈
![[small script l]](https://www.rsc.org/images/entities/char_e146.gif) (Tinit)〉 = 8 proves to be a robust choice.
(Tinit)〉 = 8 proves to be a robust choice.
3 Results
Before studying droplet formation with different fluid viscosities, it is informative to determine an effective viscosity of the system and identify a characteristic temporal scale of the coarsening process. Combining the three relevant physical quantities in a symmetric binary fluid: viscosity, surface tension, and density, the scaling of the characteristic length and time scales can be deducted. As shown in ref. 4, the universal scaling is characterized by L0 = η2/(ρσ), and T0 = η3/(ρσ2). In asymmetric fluid mixtures, there is no a priori knowledge of whether there exists a universal scaling with a single pair of characteristic time and length scales, and if yes, how the different viscosities are combined to construct T0 and L0. One would expect that the relevant effective viscosity would depend on the details of the model, i.e., on how the viscosity of each component depends on the binary fluid order parameter ϕ. In 1![[thin space (1/6-em)]](https://www.rsc.org/images/entities/char_2009.gif) :
:![[thin space (1/6-em)]](https://www.rsc.org/images/entities/char_2009.gif) 1 incompressible binary mixtures where viscosity contrast is introduced by a linear composition model η(ϕ) = (ϕ + 1)/2ηL + (1 − ϕ)/2ηH, Henry and Tegze24 compared three simple forms of effective viscosity: the arithmetic mean, η(a)eff = (ηL + ηH)/2, the geometric mean
1 incompressible binary mixtures where viscosity contrast is introduced by a linear composition model η(ϕ) = (ϕ + 1)/2ηL + (1 − ϕ)/2ηH, Henry and Tegze24 compared three simple forms of effective viscosity: the arithmetic mean, η(a)eff = (ηL + ηH)/2, the geometric mean  , and the harmonic mean 1/η(h)eff = (1/ηL + 1/ηH)/2, the latter also known as Onuki's formula.25 They found that η(g)eff is the best among the three candidates in collapsing the growth rate onto a single curve dl/dt for a certain range of effective viscosity values (in a large viscosity regime). An alternative to the linear model of fluid viscosity has recently been presented by Gidituri et al.26 where an Arrhenius model η(ϕ) = η(1−ϕ)/2Hη(1−ϕ)/2L is explored with a lattice Boltzmann environment. We follow Ledesma et al.27 and perform the lattice Boltzmann scheme using viscosity that changes quickly at the interface: η(ϕ) = ηHθ(−ϕ) + ηLθ(ϕ), where θ(ϕ) is the Heaviside step function. This choice is convenient since it prevents the appearance of interfaces with viscosities different from the bulk domains.
We examine if the coarsening process in our asymmetric model follows a universal scaling law, which would enable us to determine the effective viscosity of the mixture. We follow the temporal evolution of the size of the fluid domains for a phase separating mixture starting from a homogeneous state. In Fig. 2 we show the growth of the domain length, l/L0 with the scaled time t/T0. We compute L0 = ηeff2/(ρσ), and T0 = ηeff3/(ρσ2) L0 using the three simple forms of effective viscosity introduced above. We compare the growth process to the linear universal scaling law, l/L0 ∼ t/T0, as observed in symmetric binary mixtures.4 In our simulations we fix the surface tension, and vary ηH and ηL between 0.006 and 1.5, using the parameters listed in Table 1. The chosen range of parameter values allows us to cover five decades in dimensionless domain sizes compatible with the linear growth regime for symmetric mixtures (l/L0 ≤ 100).
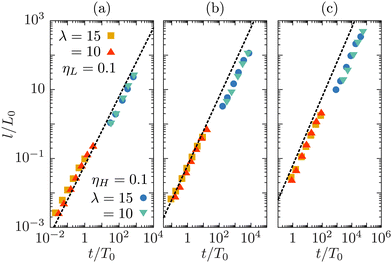 | ||
| Fig. 2 Dynamic scaling of the typical domain size, at Φ = 0, using the arithmetic (a), geometric (b), and harmonic (c) mean for the effective viscosity. The dashed line corresponds to the universal scaling law, l/L0 = 0.063t/T0, for a symmetric mixture.4 The viscosity values are displayed in the upper part of Table 1. The values of L0 and T0 are computed separately in each panel, using the corresponding effective viscosity. The symbols are colored by the viscosity contrast, λ = ηH/ηL. | ||
| η H | η L | λ | η (a)eff | L 0 | T 0 |
|---|---|---|---|---|---|
| 1.5 | 0.1 | 15 | 0.8 | 400 | 2 × 10⁵ |
| 1.0 | 0.1 | 10 | 0.55 | 189 | 65![[thin space (1/6-em)]](https://www.rsc.org/images/entities/char_2009.gif) 000 000 |
| 0.1 | 0.01 | 10 | 0.055 | 1.89 | 65 |
| 0.1 | 0.0066 | 15 | 0.053 | 1.778 | 59 |
| 1.03 | 0.0688 | 15 | |||
| 1 | 0.1 | 10 | |||
| 0.917 | 0.183 | 5 | 0.55 | 189 | 65![[thin space (1/6-em)]](https://www.rsc.org/images/entities/char_2009.gif) 000 000 |
| 0.733 | 0.367 | 2 | |||
| 0.55 | 0.55 | 1 |
We observe that the universal scaling characterizing symmetric mixtures4 is roughly recovered in all three cases. However, there are visible deviations from it. The curve obtained with the arithmetic mean hardly deviates from linear behavior in the entire range. It slightly overestimates the domain sizes for viscosity values below ηH,L < 0.1 and underestimates them for ηH,L > 0.1. The geometric mean, η(g)eff, in contrast, is a good match for large viscosities, but exhibits non-linear growth behavior and underestimates the domain growth rate for low viscosities. The harmonic mean seems to be the worse of the three. Comparing our observations to those of ref. 24 reveals some qualitatively similar trends, however, their evaluation was done at much larger viscosities and with a different model from ours, so quantitative comparison is not productive. We conclude that, even though the dynamic scaling results are not completely conclusive in identifying the optimal form of the effective viscosity, the scaling with the arithmetic average is reasonably close to the universal curve. We thus choose the arithmetic average as an approximation for the effective viscosity of the system. In the following, L0, T0 and ηeff will refer to the quantities derived using ηaeff as the effective viscosity.
To explore the effect of colloidal particles on the separation process, we compare the growth of the domain size, l(t), with different colloidal packing fractions, Φ, and different viscosity contrasts, λ. To ensure that phase separation kinetics is dominated by viscosity, the characteristic length L0 must be larger than the typical domain size, and the characteristic time, T0, must be large to keep the typical velocity V0 = L0/T0 small enough. Accordingly, we set ηeff = 0.55 with L0 = 190, and T0 = 65![[thin space (1/6-em)]](https://www.rsc.org/images/entities/char_2009.gif) 000, V0 = 2.9 × 10⁻³.
000, V0 = 2.9 × 10⁻³.
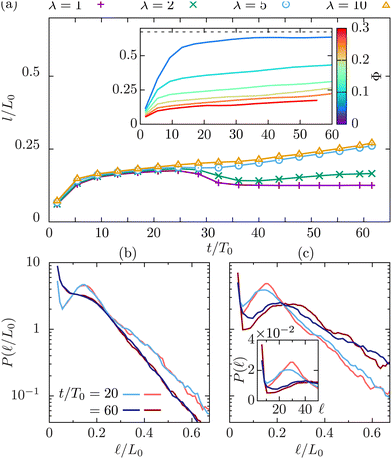
Colloidal particles significantly slow down the kinetics of phase separation, as is obvious from the inset in Fig. 3(a), which depicts the dynamics of the domain size, l(t)/L0, for a fixed λ = 10 and varying colloidal packing fraction Φ.
The results in Fig. 3(a) for Φ = 0.2 and varying λ reveal three kinetic regimes in system evolution: (i) domain formation and linear growth,  , (ii) slow-down regime,
  , and (iii) domain growth arrest for t/T0 ≳ 30. The viscosity contrast has a strong effect on the arrested regime. For λ = 1 (purple symbols), the complete arrest of domain growth leads to a gel-like bicontinuous phase, called bijel.6 This regime has not been reported before. We managed to identify it since we have covered timescales that are an order of magnitude larger than in the previously reported studies.6,28 As λ > 1 the stability of the bijels is reduced, and a slow kinetic growth is observed in this third regime. The inset of Fig. 3(a) also shows that increasing Φ in asymmetric mixtures does not affect the kinetics of phase separation but decreases the domain size at which the crossover to the arrested regime takes place.
A detailed analysis of the chord length probability distribution, P(![[small script l]](https://www.rsc.org/images/entities/char_e146.gif) ), for Φ = 0.2 and λ = 1 (Fig. 3(b)), and = 10 (Fig. 3(c) and its inset), reveals the formation of small domains with sizes below
), for Φ = 0.2 and λ = 1 (Fig. 3(b)), and = 10 (Fig. 3(c) and its inset), reveals the formation of small domains with sizes below ![[small script l]](https://www.rsc.org/images/entities/char_e146.gif) = 10. The temporal evolution of the chord length distributions is qualitatively different in the two cases. In a symmetric binary fluid the number of small domains stabilizes at long times (data not shown). The apparent domain size reduction is due to the droplet formation that alters the average domain size in two ways: by adding smaller domains in the distribution as seen by an increase in P(
= 10. The temporal evolution of the chord length distributions is qualitatively different in the two cases. In a symmetric binary fluid the number of small domains stabilizes at long times (data not shown). The apparent domain size reduction is due to the droplet formation that alters the average domain size in two ways: by adding smaller domains in the distribution as seen by an increase in P(![[small script l]](https://www.rsc.org/images/entities/char_e146.gif) ) at low values, and by splitting the larger domains in multiple segments as seen by introducing a shoulder in the distribution, and by reducing the long segments exponential decay length. In an asymmetric mixture, although we observe more droplets in that case, the fluid domains continue growing as shown by both the increase of the decay length of the exponential tail and the displacement of the peak of the P(
) at low values, and by splitting the larger domains in multiple segments as seen by introducing a shoulder in the distribution, and by reducing the long segments exponential decay length. In an asymmetric mixture, although we observe more droplets in that case, the fluid domains continue growing as shown by both the increase of the decay length of the exponential tail and the displacement of the peak of the P(![[small script l]](https://www.rsc.org/images/entities/char_e146.gif) ) to larger
) to larger ![[small script l]](https://www.rsc.org/images/entities/char_e146.gif) values. Systems at large packing fractions form the bijel structure but the viscosity contrast accelerates the slow relaxation process towards the complete phase separation.
values. Systems at large packing fractions form the bijel structure but the viscosity contrast accelerates the slow relaxation process towards the complete phase separation.
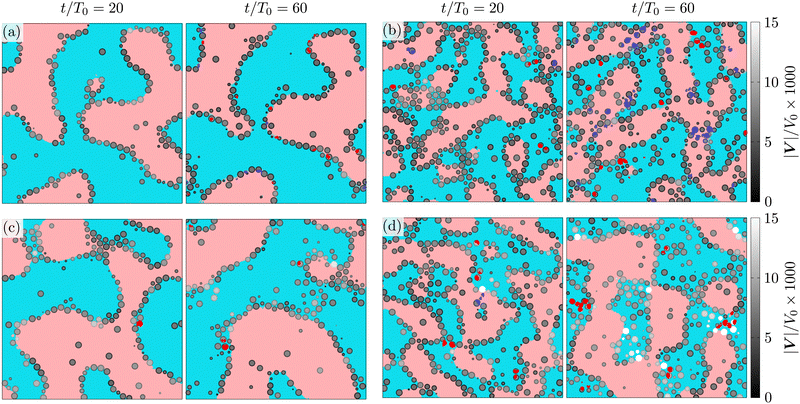
To visualize the structuring of the fluid, and colloidal particles, we present cuts of the system at constant z = z0 values (see Fig. 4) at different stages of the evolution, t/T0 = 20, 60. The fluid regions in the figure are colored as follows: if the lattice element is a part of a macroscopic percolating domain, it is colored in pale red (for ηL component) or pale blue (ηH); similarly, the smaller domains are colored in dark red (ηL) and dark blue (ηH). A colloidal particle is visualized if its center lies within one radius from the selected plane (|zi − z0| ≤ a). The apparent radius of the displayed colloidal particle is given by ri = (a2 − (zi − z0)2)1/2, the colloids are shaded in grey according to the module of their instantaneous velocity |Vi|/V0. The instantaneous velocity of the colloids trapped at the interface is a convenient probe for the temporal evolution of the corresponding domains. At packing fraction Φ = 0.2 (Fig. 4(b) and (d)), the instantaneous velocity of the particles trapped at the interface is quite different between the symmetric (λ = 1) and asymmetric (λ = 10) mixtures, which indicates different domain dynamics: in asymmetric mixtures the colloids are advected two- to three-times faster than in the symmetric mixtures.
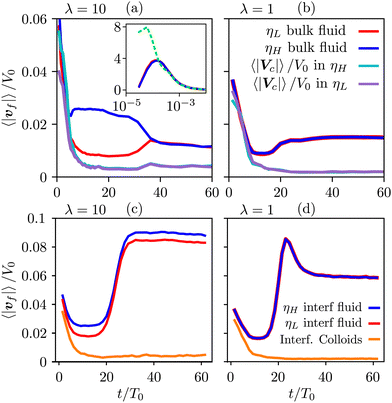
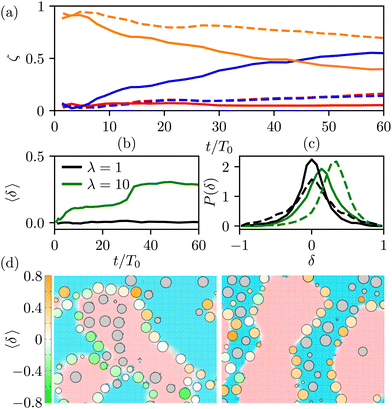
To gain further insight, we have analyzed the fluid and colloidal velocities both in the bulk (lattice nodes with |ϕ| > 0.5), and at the interface (|ϕ| < 0.5). Colloids are classified as interfacial if at least one of their surface nodes lies in the interfacial region. In Fig. 5 we plot the time evolution of the velocities of fluid phases and colloids – first in the bulk regions (a) and (b), and separately in the interfacial region (c) and (d). The bulk fluid velocities, Fig. 5(a) and (b), show a non-monotonous behaviour revealing three kinetic regimes in system evolution, which correlate with the observations in Fig. 3(a). In the domain growth regime,  , the fluid and colloidal velocities quickly decrease from their initial values, both in symmetric and asymmetric mixtures (see also the inset of Fig. 5(a)). For symmetric mixtures, the slow-down regime is characterized by a plateau with essentially constant values of fluid velocities, followed by an increase that eventually converges to a second plateau at large times. The transition between the second and third regimes is associated with a structural rearrangement of the interfacial colloids, which is reflected in the non-monotonous behaviour of the interfacial fluid velocity (a peak at t/T0 ∼ 25 in Fig. 5(d)). In asymmetric mixtures, the bulk fluid velocities behave qualitatively differently: they are larger in the high viscosity phase, and the plateau values are less clearly expressed than in the symmetric case. In order to understand this behaviour better, we computed the number of colloids that reside in the high viscosity fluid, NH, in the low viscosity fluid, NL, and in the interface region, NI. Clearly, N = NH + NL + NI, and the corresponding colloidal fractions are ζk = Nk/N,
![[thin space (1/6-em)]](https://www.rsc.org/images/entities/char_2009.gif)
![[thin space (1/6-em)]](https://www.rsc.org/images/entities/char_2009.gif) k ∈ {L,H,I}. In Fig. 6(a), we show their time evolution for symmetric (dashed lines) and asymmetric mixtures (solid lines). We observe that in symmetric mixtures in the entire simulation time the colloids predominantly reside at the interface. In the second and third kinetic regime, the colloids are symmetrically expelled into the bulk at a small rate, which is consistent with a gel-like behaviour of the bijels.6 In contrast, in asymmetric mixtures the colloids are expelled from the interface at a higher rate, and preferentially into the high viscosity bulk phase. This can be attributed to the asymmetric position of the colloids at the fluid interface, which is shown in Fig. 6(b), where we plot the average distance of the centers of the colloids from the fluid–fluid interface.
k ∈ {L,H,I}. In Fig. 6(a), we show their time evolution for symmetric (dashed lines) and asymmetric mixtures (solid lines). We observe that in symmetric mixtures in the entire simulation time the colloids predominantly reside at the interface. In the second and third kinetic regime, the colloids are symmetrically expelled into the bulk at a small rate, which is consistent with a gel-like behaviour of the bijels.6 In contrast, in asymmetric mixtures the colloids are expelled from the interface at a higher rate, and preferentially into the high viscosity bulk phase. This can be attributed to the asymmetric position of the colloids at the fluid interface, which is shown in Fig. 6(b), where we plot the average distance of the centers of the colloids from the fluid–fluid interface.
We calculate the dimensionless distance δi of a colloid i from the liquid interface by first identifying those surface nodes (fluid nodes in contact with the colloid i) that lie within the interfacial region. This set of nodes, denoted as {qi,I}, can be thought of as representing an extended object in three dimensions. We use the singular value decomposition technique29 to determine the principle axes of this kind of object and identify the axis that describes the normal to the interface, ![[N with combining circumflex]](https://www.rsc.org/images/entities/b_i_char_004e_0302.gif) i. By convention, the normal is pointing into the low viscosity phase. Once we know the direction of the normal to the interface at the position of the colloid Xi, we can calculate the distance δi = 〈
i. By convention, the normal is pointing into the low viscosity phase. Once we know the direction of the normal to the interface at the position of the colloid Xi, we can calculate the distance δi = 〈![[N with combining circumflex]](https://www.rsc.org/images/entities/b_i_char_004e_0302.gif) i·(qi,I − Xi)〉/a. According to our convention, the positive values of δi imply colloids residing predominantly in the high viscous phase. Fig. 6(b) shows that in the asymmetric mixtures the interfacial colloids, before they are expelled into the bulk, are positioned asymmetrically towards the high viscous phase.
i·(qi,I − Xi)〉/a. According to our convention, the positive values of δi imply colloids residing predominantly in the high viscous phase. Fig. 6(b) shows that in the asymmetric mixtures the interfacial colloids, before they are expelled into the bulk, are positioned asymmetrically towards the high viscous phase.
The distribution of the distances δi shown in Fig. 6(c) and illustrated in the snapshots in Fig. 6(d) shows that for λ = 1, the colloidal distribution around the interface is symmetric and broadens with time. This broadening is associated with the increased tension following the structural rearrangement in the third kinetic regime.30
In contrast, for λ = 10, the distribution is shifted towards the positive values of δ. The basic mechanism behind this displacement is the viscous lift force: since the fluid velocities of both phases at the interface are similar (Fig. 5(c)), and the viscosity contrast is 10, we expect a non-vanishing viscous drag force directed towards the high viscosity phase. We note that this explanation is based on a simple planar configuration with a simple flow pattern. Therefore, it can provide a qualitative rather than quantitative description of the mechanism for the onset of asymmetric interfacial stresses and the resulting asymmetric positioning of the colloids at the interface.
The asymmetric positioning, in turn, lowers the barrier for colloidal expulsion into the high viscosity bulk phase. The expulsion of a particle creates a locally enhanced fluid flow, which explains why in Fig. 5(a) and (c) the blue curves lie above the red ones. Therefore, at λ = 10, we do not observe a complete arrest of the domain coarsening, which indicates that the viscosity contrast destabilises the bijels.‡
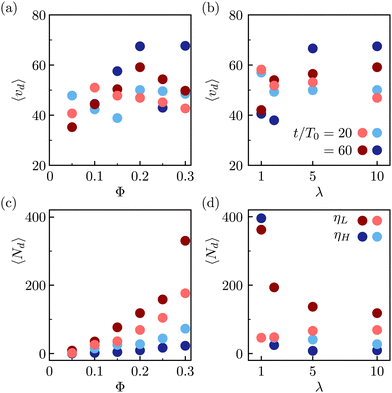
During the expulsion from the interface into the bulk, it is likely that the colloids drag the surrounding fluid with them, which can result in the formation of droplets of one fluid phase in the bulk of the other one. Our observations of such droplets are shown in the snapshots in Fig. 4, and in the movies in the online ESI.† The observed droplets are typically stabilized by the colloidal particles. Fig. 7 shows the statistics of the observed micro-droplets measured in the simulations within the second and third kinetic regimes. In the symmetric fluid the amount of red and blue droplets is statistically equivalent, while for asymmetric mixtures where most free colloids are in the high-viscosity phase, the droplets of the low viscosity fluid dominate. To identify the droplets, we performed the cluster analysis: two neighboring lattice nodes belong to the same fluid domain if they share the same fluid component (same sign of ϕ). The analysis reveals two macroscopic (percolating) domains with approximately half the lattice nodes each and on top of the macro-domains, there is a dispersion of microscopic domains with volumes ranging from tens to hundreds of lattice nodes. The quantitative analysis reveals that, in Fig. 7(a) and (b), the average volume per droplet lies around 〈vd〉 = 50 ± 10 lattice cells, approximately a quarter of a single colloidal particle. Moreover, the number of formed droplets increases both with the packing fraction of colloidal particles and with simulation time. Whenever there is a viscosity contrast, λ ≠ 1, the number of observed droplets presents a strong asymmetry with more droplets in the low viscosity fluid forming within the high-viscosity fluid domain. We speculate that the larger number of small droplets observed in the symmetric mixtures is associated to the larger free energy barrier for the colloidal escape, which in turn creates a larger distortion of the fluid interface, and as a consequence a larger number of emerging small droplets.
4 Summary
We have shown that viscosity asymmetry plays a crucial role in the survival of long-lived bijels. The asymmetry in the fluid viscosities breaks the symmetry in colloidal positions at the fluid interface and facilitates the colloidal escape process by which bijels relax into an equilibrium structure. The escape mechanism accumulates colloids in the high viscosity fluid even in the absence of thermal fluctuations. While the timescales associated with the domain coarsening arrest are controlled by the viscosity contrast, we observed that in the presence of colloids, the pathways leading to a coarsening process towards a bijel or complete phase separation remain unchanged. Finally, the accumulation and expulsion of colloidal particles from the interface creates complex fluid motion and favours the formation of small droplets with a characteristic size almost independent of the control parameters, i.e., the packing fraction and the viscosity contrast.Conflicts of interest
There are no conflicts to declare.Acknowledgements
We thank Li Tao for sharing his experimental results and for useful discussions. I. P. acknowledges support from Ministerio de Ciencia e Innovación MCICIN/AEI/FEDER for financial support under grant agreement PID2021-126570NB-100 AEI/FEDER-EU, from Generalitat de Catalunya under Program Icrea Acadèmia and project 2021SGR-673. J. D. and J. C. acknowledge funding from the National Natural Science Foundation of China through the Key project No. 12034019, and projects No. 11874398 and 12034019. JD acknowledges support from the Strategic Priority Research Program of the Chinese Academy of Sciences (XDB33000000), and from the K. C. Wong Educational Foundation through an international collaboration grant.Notes and references
- D. Reguera, J. M. Rubí and J. M. G. Vilar, The Mesoscopic Dynamics of Thermodynamic Systems, J. Phys. Chem. B, 2005, 109(46), 21502–21515, DOI:10.1021/jp052904i
.
- P. Stansell, K. Stratford, J. C. Desplat, R. Adhikari and M. E. Cates, Nonequilibrium Steady States in Sheared Binary Fluids, Phys. Rev. Lett., 2006, 96, 085701 CrossRef CAS PubMed
. Available from https://link.aps.org/doi/10.1103/PhysRevLett.96.085701.
- K. Ioannidou, M. Kandu
![[c with combining breve]](https://www.rsc.org/images/entities/char_0063_0306.gif) , L. Li, D. Frenkel, J. Dobnikar and E. D. Gado, The crucial effect of early-stage gelation on the mechanical properties of cement hydrates, Nat. Commun., 2016, 7(1), 12106 CrossRef CAS PubMed
, L. Li, D. Frenkel, J. Dobnikar and E. D. Gado, The crucial effect of early-stage gelation on the mechanical properties of cement hydrates, Nat. Commun., 2016, 7(1), 12106 CrossRef CAS PubMed .
- I. Pagonabarraga, A. J. Wagner and M. Cates, Binary fluid demixing: The crossover region, J. Stat. Phys., 2002, 107(1), 39–52 CrossRef
.
- R. Shimizu and H. Tanaka, A novel coarsening mechanism of droplets in immiscible fluid mixtures, Nat. Commun., 2015, 6, 7407 CrossRef PubMed
.
- K. Stratford, R. Adhikari, I. Pagonabarraga, J. C. Desplat and M. E. Cates, Colloidal Jamming at Interfaces: A Route to Fluid-Bicontinuous Gels, Science, 2005, 309(5744), 2198–2201 CrossRef CAS PubMed
. Available from https://www.science.org/doi/abs/10.1126/science.1116589.
- E. Kim, K. Stratford, P. J. Camp and M. E. Cates, Hydrodynamic Interactions in Colloidal Ferrofluids: A Lattice Boltzmann Study, J. Phys. Chem. B, 2009, 113(12), 3681–3693, DOI:10.1021/jp806678m
.
- T. Li, J. Klebes, J. Dobnikar and P. S. Clegg, Controlling the morphological evolution of a particle-stabilized binary-component system, Chem. Commun., 2019, 55(39), 5575–5578 RSC
.
- K. Stratford and I. Pagonabarraga, Parallel simulation of particle suspensions with the lattice Boltzmann method, Comput. Math. Appl., 2008, 55, 1585 CrossRef
.
- J. C. Desplat, I. Pagonabarraga and P. Bladon, LUDWIG: A parallel Lattice-Boltzmann code for complex fluids, Comput. Phys. Commun., 2001, 134(3), 273–290 CrossRef CAS
.
- J. W. Cahn and J. E. Hilliard, Free Energy of a Nonuniform System. I. Interfacial Free Energy. The, J. Chem. Phys., 1958, 28(2), 258–267 CrossRef CAS
.
- M. E. Cates, K. Stratford, R. Adhikari, P. Stantell, J. C. Desplat and I. Pagonabarraga,
et al., Simulating colloid hydrodynamics with lattice Boltzmann methods, J. Phys.: Condens. Matter, 2004, 16, S3903 CrossRef CAS
.
- K. Stratford, R. Adhikari, I. Pagonabarraga and J. C. Desplat, Lattice Boltzmann for binary fluids with suspended colloids, J. Stat. Phys., 2005, 121(1), 163–178 CrossRef
.
- N. Q. Nguyen and A. J. C. Ladd, Lubrication corrections for lattice-Boltzmann simulations of particle suspensions, Phys. Rev. E: Stat., Nonlinear, Soft Matter Phys., 2002, 66, 046708 CrossRef PubMed
. Available from https://link.aps.org/doi/10.1103/PhysRevE.66.046708.
- K. Stratford and I. Pagonabarraga, Parallel simulation of particle suspensions with the lattice Boltzmann method, Comput. Math. Appl., 2008, 200(55), 1585 CrossRef
.
-
S. Succi, The Lattice Boltzmann Equation for Fluid Dynamics and Beyond, Oxford University Press, 2001 Search PubMed
.
- kevinstratford, Henrich O, jlintuvuori, dmarendu, qikaifzj, austin1997, et al. ludwig-cf/ludwig: Ludwig 0.21.0. Zenodo; 2024 DOI:10.5281/zenodo.10480605.
- W. R. Osborn, E. Orlandini, M. R. Swift, J. M. Yeomans and J. R. Banavar, Lattice Boltzmann Study of Hydrodynamic Spinodal Decomposition, Phys. Rev. Lett., 1995, 75, 4031–4034 CrossRef CAS PubMed
. Available from https://link.aps.org/doi/10.1103/PhysRevLett.75.4031.
- K. Stratford, R. Adhikari, I. Pagonabarraga, J. C. Desplat and M. E. Cates, Colloidal jamming at interfaces: A route to fluid-bicontinuous gels, Science, 2005, 309(5744), 2198–2201 CrossRef CAS PubMed
.
- A. J. Wagner and J. M. Yeomans, Phase separation under shear in two-dimensional binary fluids, Phys. Rev. E: Stat. Phys., Plasmas, Fluids, Relat. Interdiscip. Top., 1999, 59, 4366–4373 CrossRef CAS
. Available from https://link.aps.org/doi/10.1103/PhysRevE.59.4366.
- P. Levitz, Off-lattice reconstruction of porous media: critical evaluation, geometrical confinement and molecular transport, Adv. Colloid Interface Sci., 1998, 76, 71–106 CrossRef
.
- L. D. Gelb and K. Gubbins, Characterization of porous glasses: Simulation models, adsorption isotherms, and the Brunauer- Emmett-Teller analysis method, Langmuir, 1998, 14(8), 2097–2111 CrossRef CAS
.
- V. Testard, L. Berthier and W. Kob, Intermittent dynamics and logarithmic domain growth during the spinodal decomposition of a glass-forming liquid, J. Chem. Phys., 2014, 140(16), 164502 CrossRef PubMed
.
- H. Henry and G. Tegze, Self-similarity and coarsening rate of a convecting bicontinuous phase separating mixture: Effect of the viscosity contrast, Phys. Rev. Fluids, 2018, 3(7), 074306 CrossRef
.
- A. Onuki, Domain growth and rheology in phase-separating binary mixtures with viscosity difference, EPL, 1994, 28(3), 175 CrossRef CAS
.
- H. Gidituri, A. Würger, K. Stratford and J. S. Lintuvuori, Dynamics of a spherical colloid at a liquid interface: A lattice Boltzmann study, Phys. Fluids, 2021, 33(5), 052110 CrossRef CAS
.
- R. Ledesma-Aguilar, A. Hernández-Machado and I. Pagonabarraga, Three-dimensional aspects of fluid flows in channels. I. Meniscus and thin film regimes, Phys. Fluids, 2007, 19(10), 102112 CrossRef
.
- F. Jansen and J. Harting, From bijels to Pickering emulsions: A lattice Boltzmann study, Phys. Rev. E: Stat., Nonlinear, Soft Matter Phys., 2011, 83, 046707 CrossRef PubMed
. Available from https://link.aps.org/doi/10.1103/PhysRevE.83.046707.
-
W. H. Press
Numerical recipes: The art of scientific computing, Cambridge University Press, 3rd edn, 2007 Search PubMed
.
- V. M. Kendon, M. E. Cates, I. Pagonabarraga, J. C. Desplat and P. Bladon, Inertial effects in three-dimensional spinodal decomposition of a symmetric binary fluid mixture: a lattice Boltzmann study, J. Fluid Mech., 2001, 440, 147–203 CrossRef CAS
.
Footnotes |
| † Electronic supplementary information (ESI) available. See DOI: https://doi.org/10.1039/d3sm00955f |
| ‡ Unlike the fluid velocities, the average colloidal velocities in the bulk, 〈|Vc|〉, decrease monotonically and are the same for symmetric and asymmetric binary mixtures. Due to the parameters chosen in our work, the typical domain size in the stabilization phase is only about four colloidal diameters, thus the colloids cannot be considered as passive local probes of the fluid velocity field and their average speed will generally be lower than that of the bulk fluid. |
| This journal is © The Royal Society of Chemistry 2024 |

