DOI:
10.1039/D3SM01308A
(Paper)
Soft Matter, 2024,
20, 89-93
How the geometry of patterned surfaces affects the thickness distribution of the oxidized silica layer on polydimethylsiloxane (PDMS) after ultraviolet/ozone treatment†
Received
29th September 2023
, Accepted 20th November 2023
First published on 20th November 2023
Abstract
It is well established that a thin silica-like surface layer is formed when a cross-linked PDMS structure is subjected to ultraviolet/ozone treatment. Due to surface geometry, especially near the corners, this silica-like surface layer has non-uniform thickness, which can impact many mechanical properties, including adhesion and fracture strength. Here we use a simple analytic model based on diffusion of reactive species to predict the thickness of the oxidized surface layer near the corners. We demonstrate that these corner solutions can be patched together to determine the thickness of the oxidized layer in complex geometries.
1. Introduction
Exposing cross-linked PDMS to oxidizing environments such as ultraviolet/ozone (UVO) or oxygen plasma is known to create a thin silica-like surface layer.1–6 This layer is commonly utilized to improve adhesion between PDMS and glass surfaces, particularly in microfluidic device fabrication.7 In the case of UVO, UV-assisted reactions result in the formation of this surface layer, with its growth primarily limited by the diffusion of radicals and molecular oxygen.4,5
While UVO treatments are often applied to PDMS surfaces with complex profiles, very little attention has been given to studying the resulting spatial variation in the thickness of the oxidized layer and its impact on the mechanical properties of patterned surfaces. In a previous work,8 we conducted a comparison of the surface profiles between two PDMS samples initially patterned identically (see Fig. 1(a)). Both samples consisted of long parallel micro-channels with a height (h) and spacing (L) (blue trace in Fig. 1(a)). The trace in red is for an initially identical sample that was additionally exposed to UVO treatment. The trace in cyan is for a sample which has been further stretched. Two noticeable differences emerged between the samples. Firstly, both the UVO-treated samples exhibited a significantly smaller surface amplitude compared to the non-UVO-treated sample. Secondly, and crucially for the matter addressed in this manuscript, the UVO-treated sample displayed a rounded overall deformed shape, with sharp features preserved in the upper corners while the lower corners appeared rounded.
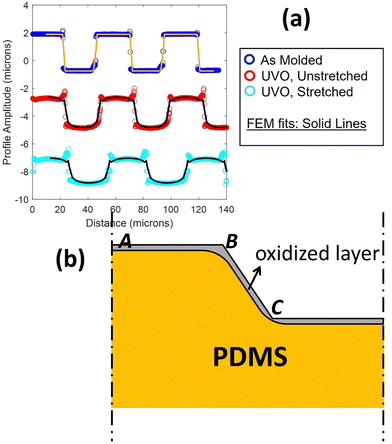 |
| | Fig. 1 (a) Surface profile of as-molded ridge-channel structures (in blue, top), the profile after exposure to UVO (in red, middle), and the profile after additional uniaxial stretch (bottom). This last profile is added to better illustrate the profile near the corners. Solid black lines are the result of a finite element analysis of deformation driven by surface residual stress and accounting for the elasticity of a near-surface oxidized layer. (b) Schematic drawing illustrating how the geometry influences the local thickness of the oxidized layer. | |
The decrease in surface amplitude of the UVO-treated sample can be attributed to the deformation driven by residual surface tension, in turn induced by the oxidation process on the oxidized surface layer. Fig. 1 displays solid lines representing a finite element simulation of the surface profile obtained in our previous work.8 The simulation matches the experimental profile well. The experiment data and the finite element simulation predictions in Fig. 1(a) are provided in the ESI.† The simulation captures the sharp corners at the upper edges and rounding at the lower edges. In this previous work, we note that to account for this feature, we needed to consider the assumption of a non-uniform thickness of the surface layer. Specifically, we proposed that the layer thickness at B is large compared to the flat portion near points A and C (Fig. 1(b)). Thus, the section of oxide layer near B has higher bending stiffness. By incorporating this assumption into our finite element simulation, we obtained excellent agreement with experimental data from samples with varying surface profiles.8 It should be noted that, as the sample is stretched less than 15%, our finite element model does not consider the oxidized layer thickness change during the stretch.
Fig. 1(b) provides a geometric explanation for the variation in thickness of the surface layer at corners such as B (compared to A) and re-entrant corners like C (compared to A). Experimental studies have shown that the thickness of the oxidized layer is influenced by the diffusion of gaseous reactive species into PDMS.6 However, there is no model for how the depth of penetration of these species depends on the geometry of the surface. For instance, at point A, PDMS is exposed to UVO on only one side of the surface. In contrast, at corner B, PDMS is exposed to UVO on two sides of the surface. This exposure to UVO from multiple sides leads to a thicker silica layer at corner B. On the other hand, at a re-entrant corner like C, we expect a longer average diffusion path and, consequently, the thickness of the silica layer to be smaller.
The goal of this paper is to introduce a quantitative model to predict the thickness of this layer near the corners. Based on the experimental findings of Mills et al.,6 the thickness of the oxidized layer is primarily controlled by diffusion, with a diffusion constant D that is approximately constant. This means that once the methyl groups on the PDMS are exposed to a certain concentration of UVO, the oxidation reaction proceeds significantly faster than diffusion. We further assume that the reaction front corresponds to the point where the local concentration of oxide, which is proportional to the concentration of ozone, exceeds a critical value. As a result, we would expect the thickness of the oxide layer to be larger near corners such as B, where the concentration of ozone is higher at the same distance from the surface. In the subsequent analysis, we consider all exposed surfaces to be at a constant concentration of ozone during the deposition process, denoted as c0.
2. Geometry and results
The geometry is shown in Fig. 2. Since in the flat part of the pattern (e.g., at point A in Fig. 1(b)) diffusion is one-dimensional, a function of distance from the surface, we focus our attention on the corners B and C. In addition, since the layer thickness (typically on the order of nanometers) is much smaller than the typical pattern dimensions, such as h or L, the PDMS at the corner can be represented as an infinite wedge of internal angle θ0, where 0 < θ0 < 2π. (We ignore the change in shape due to surface forces.) The tip of the wedge coincides with the origin of a polar coordinate system (r,θ). We assume that the reaction starts at time t = 0. Since the surfaces r > 0, θ = 0, θ0 are exposed to a constant concentration of ozone, the boundary conditions are| | | c(r, θ = 0, t > 0) = c0, | (1a) |
| | | c(r, θ = θ0, t > 0) = c0. | (1b) |
As deposition starts at t = 0, the initial condition is| | | c(r, 0 < θ < θ0, t = 0) = 0. | (2) |
In the polar coordinates, the diffusion equation is| |  | (3) |
The exact solution of (3) subjected to the initial and boundary conditions (2) and (1a), (1b) was given by Jaeger.9 Since Jaeger stated the result without derivation, we provide the proof in the ESI.† The solution, after some simplification (see the ESI†), is| |  | (4) |
where Γ and M are the Gamma and Kummer functions respectively and  . Eqn (4) allows us to determine the layer thickness on the wedge as a function of time and position. For the special case of θ0 = π where the wedge becomes a half space, (4) reduces to the well-known result, i.e.,
| |  | (5) |
where erfc is the complementary error function. An interesting feature of the solution given by (4) is that it is self-similar, as there is no intrinsic length scale in the wedge problem.
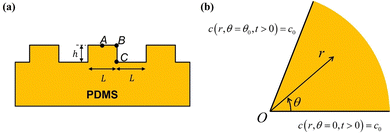 |
| | Fig. 2 (a) A periodic section of the geometry at t = 0 in Fig. 1(a), with points A, B and C highlighted. (b) Cross-section of an infinite wedge with angle θ0 at corners such as B (θ0 = π/2) or C (θ0 = 3π/2). The boundary conditions are indicated. The tip of the wedge is at the origin O. (r,θ) is a polar coordinate system. 0 ≤ r ≤ ∞ and 0 ≤ θ ≤ θ0. Note that the solutions at B and C can be obtained from the solution in Fig. 2(b) by a suitable rotation and translation of the polar coordinates. | |
In our coordinate system, the thickness of the layer at the corner is described by the radial distance from the origin. This layer thickness is a function of θ and t. Specifically, we define the oxide layer thickness ![[r with combining circumflex]](https://www.rsc.org/images/entities/i_char_0072_0302.gif) by imposing the condition c(r =
by imposing the condition c(r = ![[r with combining circumflex]](https://www.rsc.org/images/entities/i_char_0072_0302.gif) , θ, t) = ωc0, where 0 < ω < 1. In our previous work,8 we found that ω = 0.95 fits the thickness profile in our experiments. The self-similarity of the solution indicates that
, θ, t) = ωc0, where 0 < ω < 1. In our previous work,8 we found that ω = 0.95 fits the thickness profile in our experiments. The self-similarity of the solution indicates that
| |  | (6) |
The dimensionless function
f(
θ) can be computed using
eqn (4) and by setting
ω = 0.95.
![[r with combining circumflex]](https://www.rsc.org/images/entities/i_char_0072_0302.gif)
is plotted for two wedge angles
θ0 = π/2 and
θ0 = 3π/2 in
Fig. 3. The first case corresponds to corner
B while the second case corresponds to corner
C in
Fig. 2(a). It is interesting to note that, for small values of
r2/4
Dt, that is, near the wedge tip or for long times, the leading term behaviors of
c at
B and
C, defined as
cB and
cC (see the ESI
†), are
| |  | (7a) |
| |  | (7b) |
respectively. Note that for the same
r and
t,
cB ≫
cC, that is, equilibrium is reached much faster at
B than
C, a confirmation of our previous experimental observation.
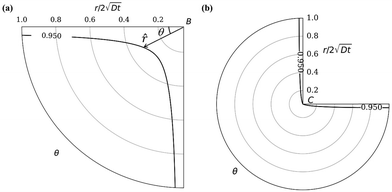 |
| | Fig. 3 Oxide layer thickness (solid dark line) at corner B (a) and C (b). ω = 0.95 in the plot. The radial distance r is normalized by  . This layer thickness is a function of θ and t. . This layer thickness is a function of θ and t. | |
The solution given by (7) is valid only near a corner. In general, it is not possible to obtain exact closed form solutions for patterned surfaces with complex geometry, such as those shown in Fig. 1(b) and 2(a). However, for all practical purposes, one can “paste” different corner solutions to obtain an accurate description of the layer thickness. To demonstrate this idea, let us consider a special case where an exact closed form solution is possible. The geometry is shown in Fig. 4. A ridge occupies the region |x| < L, y < 0. The ridge is taken to be infinitely long since the thickness of the layer is much less than its length. The corners are located at x = ±L, y = 0. The surfaces that are exposed to UVO are |x| ≤ L, y = 0 and x = ±L, y < 0.
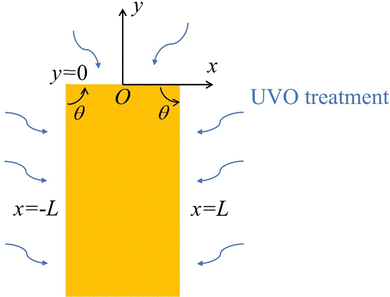 |
| | Fig. 4 An infinitely long ridge subjected to UVO treatment. | |
The diffusion equation is
| |  | (8) |
The boundary conditions are
| | | c(|x| ≤ L, y = 0, t > 0) = c0, c(x = ±L, y ≤ 0, t > 0) = c0, | (9) |
with initial condition
| | | c(|x| < L, y < 0, t = 0) = 0. | (10) |
Details of the solution are given in the ESI;
† the exact solution is
| |  | (11) |
We define the normalized quantities as
| |  | (12a) |
| |  | (12b) |
| |  | (12c) |
| |  | (12d) |
The solution
(11) expressed in terms of normalized variables is
| |  | (13) |
Note that the solution depends on
![[L with combining macron]](https://www.rsc.org/images/entities/i_char_004c_0304.gif)
since
![[small lambda, Greek, macron]](https://www.rsc.org/images/entities/i_char_e0cc.gif) n
n is inversely proportional to it. In the following, we choose
![[L with combining macron]](https://www.rsc.org/images/entities/i_char_004c_0304.gif)
≥ 1, so that the diffusion layer is less than or equal to the typical dimensions of the surface feature. This choice is invariably satisfied in practical situations where the thickness of the oxide layer is actually much less than the profile dimensions.
Let us compare (13) with an approximate solution obtained by pasting three “corner” solutions. We label these corner solutions by c1, c2 and c3 respectively. c1 and c3 correspond to the top right and left corners, respectively, in Fig. 4. c1 and c3 are essentially the same corner solutions except for the orientation of the corner. c2 is the straight “corner” solution θ0 = π or half space solution given by (5). For the coordinate system in Fig. 4, c1, c2 and c3 are
| |  | (14a) |
| |  | (14b) |
| |  | (14c) |
Fig. 5 compares the exact solution given by
(13) with the approximate solution
c =
c1 +
c3 −
c2 obtained by pasting with different
![[L with combining macron]](https://www.rsc.org/images/entities/i_char_004c_0304.gif)
. The pasted solution achieved through corner solutions closely approximates the exact solution given by
(13). It is important to note that this approximation is valid only when the thickness of the oxide layer is smaller than the typical dimensions of the surface features,
i.e., when

.
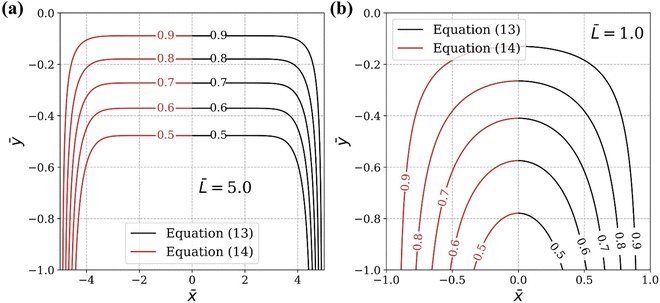 |
| | Fig. 5 Comparison of the exact solution (black lines, eqn (13)) and the approximate solution (red lines, eqn (14)). (a) ![[L with combining macron]](https://www.rsc.org/images/entities/i_char_004c_0304.gif) = 5 and (b) = 5 and (b) ![[L with combining macron]](https://www.rsc.org/images/entities/i_char_004c_0304.gif) = 1. = 1. | |
Next, we apply this pasting procedure to determine the approximate oxide layer evolution for the periodic cell geometry shown in Fig. 2(a). This solution is obtained by simply adding the corner solutions of a wedge with 90 degrees angle and 270 degrees angle and subtracting the common concentration on the vertical line joining B and C. For this case, we require  . This result is shown in Fig. 6. In the plot, we use
  and assume L ≫ h.
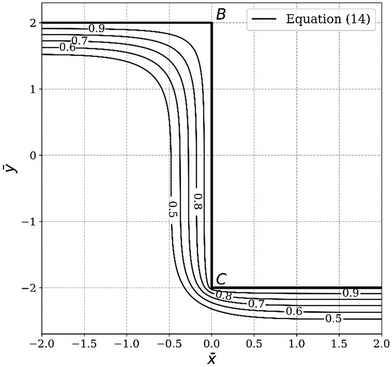 |
| | Fig. 6 Concentration contour (eqn (14)) of the oxide layer evolution for the periodic ridge-channel structure. | |
3. Summary and discussion
Many patterned surfaces on cross-linked PDMS have sharp corners. We present evidence that the oxide layers on such PDMS surfaces that are UVO treated can have non-uniform thickness. We present a simple analytic model, which allows us to determine the evolution of this corner layer. These corner solutions can be patched together to model the oxide thickness distribution of some simple surface patterns. The analytic solution presented here is valid for the duration of UV ozone treatment, which usually lasts for a few minutes to half an hour.
Because the oxide layer is much stiffer than the PDMS, the thickness of the oxidized surface is an important factor in controlling the shape of the patterned surface after UVO treatment, especially for patterns with sharp corners. This change in shape after UVO treatment can have a significant effect on the mechanical integrity of some devices. For example, micro-channels in micro-fluidic devices are often constructed by bonding two identical PDMS UVO treated surfaces such as those shown in Fig. 1(b). The oxidized layers on the PDMS surfaces provide good adhesion if contact is conformal. On the other hand, contact is not conformal due to the curvature of the oxide layer. In particular, the corner at B is a region of high stress concentration since the oxide layer is much thicker there.
There are some limitations of our theory. Our solution is valid if the oxidized layer is much smaller than the typical dimensions of the surface feature. Assuming this condition is satisfied, our analysis is valid for all sample heights or periodicities. However, when the UVO duration is sufficiently large such that the formed oxidized layer size becomes comparable to or larger than the surface dimensions, our theory breaks down. Furthermore, our solution assumes a constant diffusivity. When the UVO duration is long, the previously formed oxidized layer would act as a protective barrier restricting the surface mobility and hindering the diffusion of reactive species deeper into the PDMS network. In such cases, our theory is no longer valid.
The analytical results presented here can be adapted to model moisture diffusion in electronic packaging. In electronic packaging, a thin layer of polymer is typically molded on top of a patterned silicon wafer, which can absorb moisture during processing. The expansion of moisture inside the polymer layer during thermal cycling can cause premature failure of the package. To prevent such failures, it is necessary to remove the moisture by baking, and the time needed for removal depends on the diffusion of moisture from the polymer.
Conflicts of interest
There are no conflicts of interest to declare.
Acknowledgements
C. Y. Hui and A. Jagota acknowledge support by the National Science Foundation, USA MoMS program under grant no. 1903308.
References
- K. Efimenko, W. E. Wallace and J. Genzer, J. Colloid Interface Sci., 2002, 254, 306–315 CrossRef CAS PubMed.
- M. Meincken, T. A. Berhane and P. E. Mallon, Polymer, 2005, 46, 203–208 CrossRef CAS.
- A. E. Özçam, K. Efimenko and J. Genzer, Polymer, 2014, 55, 3107–3119 CrossRef.
- C. L. Mirley and J. T. Koberstein, Langmuir, 1995, 11, 1049–1052 CrossRef CAS.
- M. Ouyang, C. Yuan, R. J. Muisener, A. Boulares and J. T. Koberstein, Chem. Mater., 2000, 12, 1591–1596 CrossRef CAS.
- K. L. Mills, X. Zhu, S. Takayama and M. D. Thouless, J. Mater. Res., 2008, 23, 37–48 CrossRef CAS PubMed.
- Y. Xia and G. M. Whitesides, Annu. Rev. Mater. Sci., 1998, 28, 153–184 CrossRef CAS.
- N. Lapinski, Z. Liu, S. Yang, C.-Y. Hui and A. Jagota, Soft Matter, 2019, 15, 3817–3827 RSC.
- J. C. Jaeger, London, Edinburgh Dublin Philos. Mag. J. Sci., 1942, 33, 527–536 CrossRef.
|
| This journal is © The Royal Society of Chemistry 2024 |
Click here to see how this site uses Cookies. View our privacy policy here.  ab,
Anand
Jagota
 cd and
Zezhou
Liu
 *a
*a


 . Eqn (4) allows us to determine the layer thickness on the wedge as a function of time and position. For the special case of θ0 = π where the wedge becomes a half space, (4) reduces to the well-known result, i.e.,

![[r with combining circumflex]](https://www.rsc.org/images/entities/i_char_0072_0302.gif) by imposing the condition c(r =
by imposing the condition c(r = ![[r with combining circumflex]](https://www.rsc.org/images/entities/i_char_0072_0302.gif) , θ, t) = ωc0, where 0 < ω < 1. In our previous work,8 we found that ω = 0.95 fits the thickness profile in our experiments. The self-similarity of the solution indicates that
, θ, t) = ωc0, where 0 < ω < 1. In our previous work,8 we found that ω = 0.95 fits the thickness profile in our experiments. The self-similarity of the solution indicates that
![[r with combining circumflex]](https://www.rsc.org/images/entities/i_char_0072_0302.gif) is plotted for two wedge angles θ0 = π/2 and θ0 = 3π/2 in Fig. 3. The first case corresponds to corner B while the second case corresponds to corner C in Fig. 2(a). It is interesting to note that, for small values of r2/4Dt, that is, near the wedge tip or for long times, the leading term behaviors of c at B and C, defined as cB and cC (see the ESI†), are
is plotted for two wedge angles θ0 = π/2 and θ0 = 3π/2 in Fig. 3. The first case corresponds to corner B while the second case corresponds to corner C in Fig. 2(a). It is interesting to note that, for small values of r2/4Dt, that is, near the wedge tip or for long times, the leading term behaviors of c at B and C, defined as cB and cC (see the ESI†), are


 . This layer thickness is a function of θ and t.


![[L with combining macron]](https://www.rsc.org/images/entities/i_char_004c_0304.gif) since
since ![[small lambda, Greek, macron]](https://www.rsc.org/images/entities/i_char_e0cc.gif) n is inversely proportional to it. In the following, we choose
n is inversely proportional to it. In the following, we choose ![[L with combining macron]](https://www.rsc.org/images/entities/i_char_004c_0304.gif) ≥ 1, so that the diffusion layer is less than or equal to the typical dimensions of the surface feature. This choice is invariably satisfied in practical situations where the thickness of the oxide layer is actually much less than the profile dimensions.
≥ 1, so that the diffusion layer is less than or equal to the typical dimensions of the surface feature. This choice is invariably satisfied in practical situations where the thickness of the oxide layer is actually much less than the profile dimensions.


![[L with combining macron]](https://www.rsc.org/images/entities/i_char_004c_0304.gif) . The pasted solution achieved through corner solutions closely approximates the exact solution given by (13). It is important to note that this approximation is valid only when the thickness of the oxide layer is smaller than the typical dimensions of the surface features, i.e., when
. The pasted solution achieved through corner solutions closely approximates the exact solution given by (13). It is important to note that this approximation is valid only when the thickness of the oxide layer is smaller than the typical dimensions of the surface features, i.e., when  .
.

![[L with combining macron]](https://www.rsc.org/images/entities/i_char_004c_0304.gif) = 5 and (b)
= 5 and (b) ![[L with combining macron]](https://www.rsc.org/images/entities/i_char_004c_0304.gif) = 1.
= 1. . This result is shown in Fig. 6. In the plot, we use
  and assume L ≫ h.


