Flattened chains dominate the adsorption dynamics of loosely adsorbed chains on modified planar substrates†
Jianquan
Xu‡
 ,
Lu
Bai‡
,
Weizhao
Ren
,
Huifeng
Zhu
,
Xianjing
Zhou
,
Lu
Bai‡
,
Weizhao
Ren
,
Huifeng
Zhu
,
Xianjing
Zhou
 ,
Cuiyun
Zhang
and
Xinping
Wang
 *
*
School of Chemistry and Chemical Engineering, Key Laboratory of Surface & Interface Science of Polymer Materials of Zhejiang Province, Zhejiang Sci-Tech University, Hangzhou, 310018, P. R. China. E-mail: wxinping@zstu.edu.cn
First published on 27th November 2023
Abstract
Herein, the adsorption of polystyrene (PS) on phenyl-modified SiO2–Si substrates was investigated. Different from those for PS adsorption on a neat SiO2–Si substrate, the growth rate (vads) in the linear regime and hads/Rg (hads, thickness of flattened and loosely adsorbed layers on the substrate; Rg, radius of gyration) declined with increasing molecular weight (Mw) of PS and the phenyl content on the modified substrates, while the thickness of the flattened layer (hflat) and its coverage increased with increasing phenyl content. The results indicated that the adsorption of loose chains was controlled by the adsorption of flattened chains, as it only occurred in the empty contact sites remaining after the adsorption of flattened chains. Before approaching quasi-equilibrium (t < tcross), the number of flattened chain contact sites increased due to an enthalpically favorable process and, correspondingly, their spatial positions dynamically changed, which perturbed the adsorption of loose chains. When the adsorption of flattened chains reached quasi-equilibrium (t > tcross), the adsorption of loose chains was determined by the empty contact sites. The coverage of flattened chains and time to reach quasi-equilibrium were increased with more phenyl groups on the substrate, enhancing π–π interfacial interactions and resulting in a decreased adsorption rate and fewer loosely adsorbed chains. Mw-dependent vads and hads/Rg differed on phenyl-modified substrates compared to the neat SiO2–Si substrate owing to fewer empty contact sites for loose chains. The study findings improve our understanding of the mechanism responsible for the formation and structure of the adsorbed layer on solid surfaces.
1. Introduction
Decreasing the thickness of supported thin polymer films to the nanoscale significantly affects their physical properties due to the molecular chain structure at the substrate's interfacial region and its growing volume fraction within the whole film.1–5 However, the polymer's structure at the interface is mainly related to that of adsorbed chains on the substrate,6–10 and the molecular chain conformation near the substrate is dramatically influenced by interactions between chain segments and the solid substrate. This influence is transmitted throughout the supported polymer film, affecting the properties of the entire polymer material.2,9,11–18 It was reported that the loop height of adsorbed chains can control the glass transition temperature of supported thin polystyrene (PS) films.7,19–23 The distance over which the mobility of molecular chains is suppressed by the substrate was observed to proportionally increase with the thickness of the adsorbed layer (hads),9,24 which was related to the length of loosely adsorbed chains.21 This distance changed the mobility distribution of molecular chains within the thin polymer film,25 suggesting a potential approach for tuning the physical performance of supported polymer films. Therefore, adjusting the structure of adsorbed chains on the substrate has become a hot topic in nanomaterials science,7,26–31 providing a novel perspective for solving problems associated with functional thin films32–41 in applications such as photoelectric materials37,38 and nanochips.32–34As for the architecture of the adsorbed PS layer on the surface of a silicon substrate at quasi-equilibrium, it was revealed42 that the adsorbed layer comprises two different structures: tightly flattened chains in the inner layer and loosely adsorbed chains in the outer layer. Loose chains adsorb after the formation of the tightly adsorbed layer (flattened adsorbed layer),43,51 having fewer contact sites with the substrate. In our previous reports,51,52,58 the structure of the adsorbed layer was greatly affected by interactions between chain segments and the substrate. The thickness and density of the flattened layer, as well as the thickness of the loose layer, within the poly(methyl methacrylate) (PMMA) adsorbed layer declined with decreasing hydroxyl content on the substrate, and the loosely adsorbed layer subsisted only when the –OH content was approximately 31%.44 Hong et al.45 found that flattened PS layer thickness increased with increasing phenyl content on the modified substrate. Investigating the adsorption of PS, PMMA, and poly(2-vinylpyridine) on silicon substrates, Jiang et al.46 reported that the thickness of the flattened adsorbed layer at quasi-equilibrium (hequflat) and the adsorption kinetics of the flattened layer were regulated by the strength of the interfacial interactions between the polymer and solid substrate.
Understanding the adsorption mechanism and kinetics of polymer chains is important for tuning the architecture of the adsorbed layer. O’Shaughnessy47 reported that the formation of adsorbed polymer chains on a solid substrate in dilute solutions was time-dependent. At the initial stage, only a small amount of chains reached the substrate surface, lying flat on the substrate. After a certain time, more chains adsorbed on the substrate, forming a dense adsorbed layer. Meanwhile, some polymer chains could not lie flat on the substrate and adopted a relatively vertical arrangement. Rotella et al.43 believed that this special double-layered structure was related to the formation mechanism of the adsorbed layer in the polymer melt. The molecular chains that first reached the substrate surface formed many contact sites and adopted a parallel arrangement, while those arriving later had fewer contact sites and formed a more perpendicular conformation to the substrate surface. Since the interfacial adsorbed layer is formed at the embedding interfacial region between the polymer and solid substrate, “Guiselin's approach” is a common method employed to unveil the architecture of the adsorbed polymer layer through the removal of unadsorbed molecular chains on the substrate via solvent elution.48 Durning et al.49 reported that the relationship between the thickness of the PMMA adsorption layer (hads(t)) on quartz, obtained by solvent leaching, and annealing time (t) could be described by eqn (1):
| hads(t) = ht=0 + hmaxads[1 − exp(−t/τ)] | (1) |
On this basis, Housmans et al.50 believed that the formation process of adsorbed polymer chains on a solid substrate could be divided into two stages of linear and logarithmic growth. The experimental results of several studies6,46,51 have indicated that this adsorption kinetic process is consistent with actual measurements. As for the adsorption kinetics of the irreversible adsorption of PS chains on the SiO2 substrate with weak interaction,50 the linear growth rate (v) on a short time scale increased linearly with N1/2 and hads/radius of gyration (Rg) with annealing time (t) was independent of molecular weight (Mw), which was also observed in the bound layer of nanocomposites.52 It was assumed that the equilibrium adsorbed mass depended on the depth of the effective interfacial potential.13
The architecture of the adsorbed layer is known to be inevitably affected by differences in processing conditions, such as time and temperature, in the manufacturing process of polymer materials. Meanwhile, modification of the solid substrate is very popular in the materials field. Thus, investigating the effect of the solid substrate's surface chemistry on the structure and formation kinetics of the adsorbed layer is essential. Although great efforts have been undertaken to understand the effects of interfacial interactions theoretically and through modeling, experimental results regarding the formation kinetics and structure of the adsorbed layer are lacking. Herein, a series of silicon substrates with various phenyl contents were prepared and the effects of their surface chemistry on the formation kinetics and architecture of adsorbed PS layers were investigated. It was found that hflat and the density of the flattened layer increased with increasing phenyl content. Interestingly, different from the adsorption of PS on a neat SiO2 substrate, the growth rate (vads) over a short time and hads/Rg declined with increasing Mw of PS and phenyl content on the substrate. Furthermore, the adsorption of loose chains was dominated by the formation kinetics of flattened chains. The study findings will improve our understanding of the effect of the substrate's surface chemistry on the inner structure and formation kinetics of the adsorbed layer.
2. Experimental section
2.1. Materials
Monodisperse PS samples with various weight-average molecular weights (Mw) corresponding to different apposite polydispersity index (PDI) values (Mw = 100 kDa, PDI = 1.08; Mw = 225 kDa, PDI = 1.06; Mw = 442 kDa, PDI = 1.05; Mw = 783 kDa, PDI = 1.07) were purchased from Polymer Source, Inc. (Dorval, QC, Canada). Phenyltrimethoxysilane (C6H5Si(OCH3)3, PTS) used to modify the silica substrates was purchased from Sigma-Aldrich (St. Louis, MO, USA). The clean SiO2–Si substrates with a native oxide layer (approximately 2.2 nm) were obtained by submerging silicon (100) wafers in piranha solution at 363 K for 120 min, followed by rinsing with deionized water several times and drying with nitrogen. The water contact angle of these clean SiO2–Si substrates was less than 10°.2.2. Sample preparation
The SiO2–Si substrates with 20%, 49%, 69%, and 75% phenyl contents on the surface were prepared by immersing the clean SiO2–Si substrates in anhydrous toluene solution containing 0.25 vol% PTS at 333 K for 15, 30, 45, and 60 min, respectively, according to a previously reported method.23,53 Correspondingly, these substrates were labeled as PTS-1, PTS-2, PTS-3, and PTS-4, respectively, and the neat SiO2–Si substrate was labeled as PTS-0. Detailed information regarding the modified substrates is shown in Table S1 (ESI†) and their relative characterization is presented in Fig. S1 (ESI†).The adsorbed PS layer on the substrate was obtained using the solvent leaching method reported in the literature.46,48 PS films with a thickness of approximately 200 nm were prepared by spin coating 3 wt% PS toluene solution followed by solvent removal under vacuum at 393 K for 48 h. To obtain the adsorbed flattened layer and interfacial sublayer (including flattened and loosely adsorbed layers) on the substrates, the PS films were annealed at 423 K for various times, followed by leaching several times with toluene or CHCl3 until the residual thickness remained constant. The variation in residual film thickness with leaching time is shown in Fig. S2 (ESI†), indicating that the residual thickness of the film did not decrease further after 48 h of elution. Thus, the substrates were removed from toluene or CHCl3 after 48 h and dried at 393 K under vacuum for 48 h to eliminate small residual solvent molecules and obtain equilibrium morphologies of the adsorbed layer54 before the following tests were conducted.
2.3. Characterization
3. Results and discussion
3.1. Structure and adsorption kinetics of adsorbed PS layers on silicon surfaces with various phenyl contents
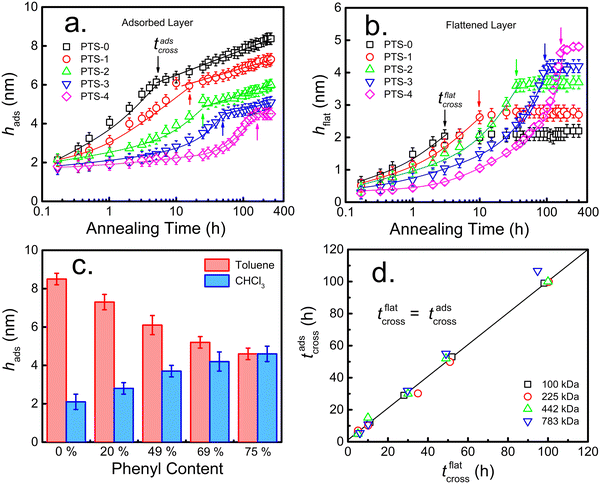
Due to π–π interfacial interactions between the PS chains and PTS-modified substrates,45,58 PTS-modified silicon (SiO2–Si) substrates are ideal models to investigate the effects of interfacial interactions on the structure of the adsorbed layer and its adsorption kinetics. Following our previously reported method,23,53 a series of PTS-modified substrates with phenyl contents of approximately 20% (PTS-1), 49% (PTS-2), 69% (PTS-3), and 75% (PTS-4) were prepared by immersing clean silicon wafers (with an approximately 2.2 nm native SiO2 layer) in 0.25 vol% PTS toluene solutions at 333 K for 15, 30, 45, and 60 min, respectively. The obtained PTS-modified substrates were characterized by contact angle, XPS, and SFG measurements (Table S1 and Fig. S1, ESI†).To investigate the effect of the phenyl groups at the polymer/modified substrate interface on the adsorbed PS layer, the adsorption kinetics of the interfacial sublayer (consisting of flattened and loosely adsorbed layers) and flattened layer were explored on modified substrates with different phenyl contents. According to the reported method, the interfacial sublayer and flattened layer were obtained by solvent leaching with toluene and chloroform, respectively (Fig. S2, ESI†), until equilibrium was reached, which was confirmed by XR (Fig. S3, ESI†). The annealing time evolution of the interfacial sublayer on PTS-modified silicon, as shown in Fig. 1a, was similar to that reported in the study conducted by Napolitano.50 Two regimes were separated by the crossover time (tcross), with the thickness of the interfacial sublayer (hads) first increasing linearly (t < tcross) and then logarithmically (t > tcross) with increasing annealing time (t), as shown in eqn (2):44
 | (2) |
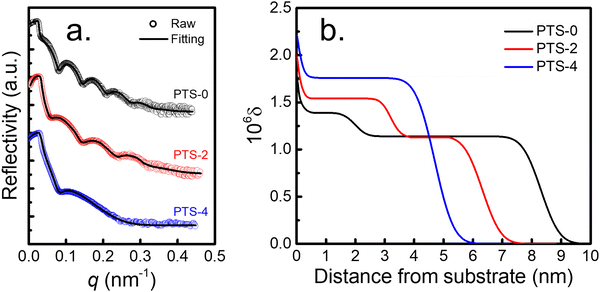
Meanwhile, tcross increased with increasing phenyl content, indicating that the adsorption rate decreased. As for the adsorption kinetics of the flattened chains (Fig. 1b), the thickness of the flattened layer (hflat) remained unchanged as the annealing time increased longer than tcross. The quasi-equilibrium thickness of the flattened chain (hequflat) and tflatcross increased with increasing phenyl content on the substrate surface. When the phenyl content on the surface of the PTS-modified substrates was approximately 75%, hequads obtained by toluene elution and hequflat obtained by chloroform elution were equivalent (approximately 4.7 nm). The results shown in Fig. 1c demonstrate that hequads decreased and hequflat increased with increasing phenyl content, approaching hequads = hequflat. To further understand the internal structure of the adsorbed layer, XR tests were conducted on the adsorbed layer on different PTS-modified substrates after reaching adsorption equilibrium obtained by toluene leaching. Fig. 2a shows the XR profiles of the PS interfacial sublayer on a representative PTS-modified substrate, while Fig. 2b shows the X-ray refractive index (δ) vs. the distance from the substrate profiles, which were obtained by fitting the XR data according to the multilayer model.22,61 Noteworthily, a distance of 0 nm was set at the middle of the transition region between the SiO2 layer and adsorbed PS layer. The corresponding best fits to the XR profiles were obtained using the X-ray Reflectivity program in the REFLEX software integrated with the Abeles matrix21,22,44,64 and employing a four-layer model (Si/SiO2/high density layer/low density layer) and a three-layer model (Si/SiO2/adsorbed layer) respectively. The bulk value of δ is 1.14 × 10⁻⁶ for PS.54 The fitting results presented in Tables S3 and S4 (ESI†) showed that the three-layer model was agreeable for the PTS-4 substrate, while the four-layer model was fit for PTS-0 and PTS-2 substrates. The δ values of the Si and SiO2 layers were fixed, while the thickness of the SiO2 layer and the thickness, δ, and roughness of the higher and lower density adsorbed layers were optimized to minimize the value of the coefficient of fitting error (χ) between the fitted line and raw data points.22,64 The results of best fitting revealed that the adsorbed layer on the PTS-modified substrates with <75% phenyl content (PTS-0 and PTS-2) exhibited a two-layered architecture, with the bottom PS layer having the higher density adjacent to the substrate and the bulk-like layer on top. With increasing phenyl content, the density and thickness of the inner layer on the substrate surface gradually increased, while the thickness of the loosely adsorbed layer decreased, and the adsorbed layer eventually changed from a two-layered structure to a single-layered structure (flattened layer) when the phenyl content was approximately 75%. This was consistent with the results shown in Fig. 1c, indicating that the structure of the adsorbed PS layer could be modulated by altering the phenyl content. At the same time, the relative high density of the inner layer was similar to the reported result according to which the density of the adsorbed layer is about 20–50% higher than the bulk.42,65,67 The reason may be attributed to strong π–π interfacial interactions. A “zipping-down” process of the transient flattened chains on planar solids happened in order to further increase the number of segment/substrate contact points (i.e. the number of phenyl groups), which is the driving force for a more dense packing and for overcoming the conformational entropy loss in the total free energy.46
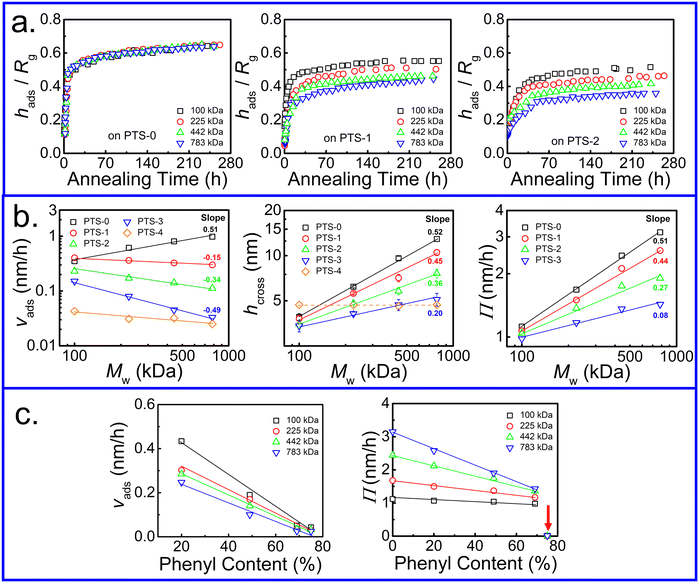
The adsorption kinetics of the adsorbed PS layer with various Mw were investigated. Different from that on the neat SiO2 substrate,50 the variation of hads/Rg with annealing time showed Mw dependence (Fig. 3a), which was enhanced with increasing phenyl content on the substrates. The adsorption kinetics of the interfacial sublayer on PTS-1 and PTS-2 are shown in Fig. S5 (ESI†) and the relative parameters extracted from eqn (2) are presented in Fig. 3b and c. Interestingly, in contrast to the neat SiO2 substrate with vads close to Mw0.5 (related to the size of the polymer chain, Rg ∝ Mw0.5),66vads in the linear regime decreased with increasing Mw. Although hcross and Π showed similar trends to those on the neat SiO2–Si substrate,50 their Mw dependence was decreased on PTS-modified substrates. The above results indicated that the adsorption kinetics of the PS chains on the substrate were significantly influenced by the phenyl groups.
As shown in Fig. 3c, the adsorption rate (vads) in the first regime and Π in the second regime gradually decreased with increasing phenyl content. The extent of the reduction in vads was enhanced with higher Mw. When the phenyl content on the PTS-modified substrates was approximately 75%, the value of Π was close to 0 owing to the disappearance of loosely adsorbed chains at quasi-equilibrium. The larger slope of Π and lower slope of vads at relatively high Mw against the phenyl content on the substrate surface further indicated that these values were related to loose chain adsorption since hflat was independent of Mw (Fig. S6, ESI†), but dependent on the phenyl group content. According to the architecture of the adsorbed layer,42 the inner flattened chains near the polymer/substrate interface were closely combined with the substrate surface, while the outer loose chains had fewer “anchor points” on the substrate surface. To further understand the influence of the phenyl content on the internal structure of the adsorbed layer, the adsorption kinetics of the flattened layer were investigated, as shown in Fig. 1b. hflat at the final adsorption equilibrium (hequflat) did not change after tflatcross and increased with increasing phenyl content on the PTS-modified substrates. Additionally, tflatcross increased with increasing phenyl content and was equal to tadscross, as shown in Fig. 1b and d, regardless of the phenyl content on the PTS-modified substrates and the Mw of PS, which further suggested that the adsorption of flattened and loose chains occurred independently.50
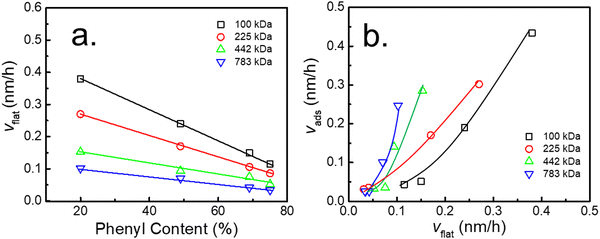
Similarly, to quantitatively describe the effect of the phenyl content on the adsorption kinetic parameters of the flattened layer, the specific adsorption rate for the formation of the flattened layer (vflat) was obtained by fitting through eqn (2). The relationship between vflat and the phenyl content on the PTS-modified substrates is shown in Fig. 4a. vflat linearly declined with increasing phenyl content, and the extent of its reduction was enhanced with increasing Mw, which was the same as vads and similar to the results reported by Jiang.46 Although the quasi-equilibrium thickness of the flattened layer did not depend on Mw, the thickness of the entire adsorbed layer was positively correlated with Mw, similar to the results reported by Napolitano.50 To investigate the influence of the flattened chains on the whole adsorbed layer, the graph of vadsvs. vflat was considered, as shown in Fig. 4b, which showed a positive correlation. As the adsorption rate of the flattened chains increased, the adsorption rate of the loosely adsorbed chains synchronously increased. This result directly indicated that the growth rate of the flattened layer affected the growth rate of the loosely adsorbed chains in the first regime.
3.2. Origin of the structure of the adsorbed layer and effect of the phenyl content on the adsorption kinetics of PTS-modified substrates
Similar to polymer chains tethered to solid substrates,68–70 flattened chains exist like “stretched brushes” when the grafting density of end-tethered polymer chains becomes sufficiently high, and their height increases proportionately with grafting density. The orientation of “brush” chains varied from a horizontal “mushroom-like” chain conformation at low grafting density to a vertical stretched chain conformation at high grafting density owing to repulsive interaction among adjacent molecular chains, resulting in a greater thickness of the polymer brushes with the same Mw.42,71,72 Therefore, the coverage and hflat of chains increased with the increasing number of phenyl groups on the substrate surface, which acted as anchoring points for PS chains via π–π interfacial interactions. When the phenyl content was approximately 75%, the flattened chains almost covered the entire surface due to having sufficient anchoring points (Fig. 5), adopting a stretched chain conformation similar to polymer brushes at high grafting density and resulting in the greatest thickness of flattened chains in the system. Meanwhile, due to the higher coverage of flattened chains, insufficient empty sites remained for the adsorption of loose chains, resulting in the adsorbed layer only consisting of flattened chains (no Π value) (Fig. 3b).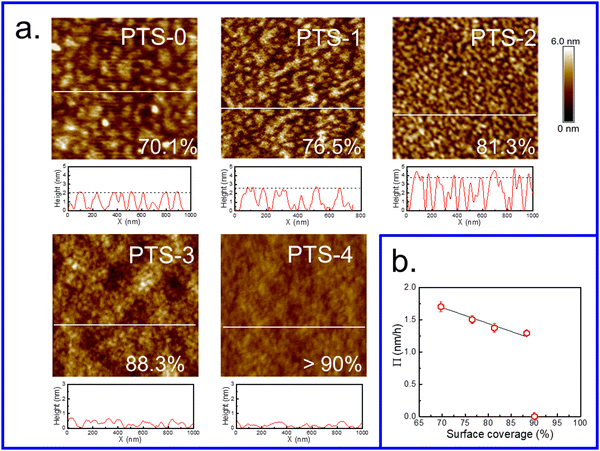 | ||
| Fig. 5 (a) Surface morphology of the (Mw = 225 kDa) flattened PS layer after tcross on various PTS-modified substrates. The scan sizes are 1 μm × 1 μm. The coverage is shown in the lower right inside graph using the bearing area analysis method reported in the literature.46 (b) Relationship between the coverage of the flattened layer and adsorption rate (Π) for the entire adsorbed PS layer in the second regime. | ||
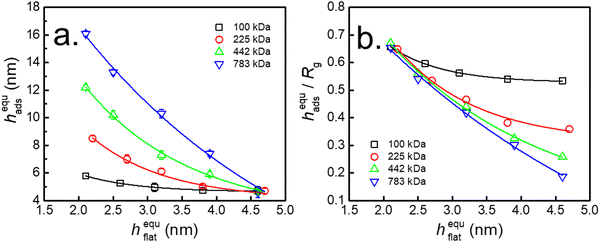
Fig. 6a shows the thickness of the interfacial sublayer after adsorption quasi-equilibrium (hequads) as a function of hequflat for PS with different Mw. The results revealed that hads declined with increasing hflat, and this phenomenon was more obvious for PS with higher Mw. This finding indicated that the quantity of loosely adsorbed chains was enhanced with decreasing hflat. Fig. 6b shows that hequads/Rg was independent of Mw when hflat was approximately 2.0 nm on the neat SiO2–Si substrate. However, the extent of the reduction in hequads/Rg was enhanced for higher Mw with increasing hequflat. Since hequads/Rg was related to the amount of adsorbed chains, this result indicated that the amount of loosely adsorbed chains declined with increasing Mw of PS. The above evidence indicated that the adsorption of flattened chains controlled the adsorption of loose chains.
Fig. 5a shows the surface morphology of the flattened layer at equilibrium on different PTS-modified substrates and the surface coverage was calculated using the reported method.46 With increasing phenyl content on the PTS-modified substrates (<69%), the surface morphology of the flattened layer showed an obvious “island” shape with a gradually decreasing characteristic length, while the average height of the “island” gradually increased, which was consistent with the ellipsometry results (Fig. 1c). Fig. S7 (ESI†) shows the bearing analysis results, which corresponded to the AFM images presented in Fig. 5a. The surface coverage of the PS flattened layer on PTS-modified substrates was enhanced with increasing phenyl content. Until the phenyl content reached 75%, the flattened layer was homogeneous and almost covered the whole surface of the substrate, with coverage >90%.
The coverage of flattened chains at equilibrium as a function of the adsorption rate in the second regime for the entire adsorbed PS layer (Π) is shown in Fig. 5b. The value of Π decreased with increasing coverage of flattened chains and was zero when the substrate was completely covered by flattened chains. Meanwhile, the results shown in Fig. 1c and 6 also indicated that hequads showed the same trend as the coverage of flattened chains. These results further confirmed that the adsorption of loose chains was related to the empty sites remaining after the adsorption of the flattened chains on the substrate. When the phenyl content was sufficiently high, almost the entire surface of the PTS-modified substrate was occupied by flattened adsorbed chains. Thus, there were no vacancies on the surface of the substrate to which loose chains could attach, preventing them from contacting the substrate and thus resulting in the loss of the anchoring effect.
To deeply comprehend the effect of flattened layer formation on the interfacial sublayer, hads and hflat were assessed on the PTS-4 substrate against annealing time at 423 K. As shown in Fig. 7, hads was much larger than hflat, when the annealing time was <50 h. This result indicated that flattened and loosely adsorbed chains were both present on the substrate. When the annealing time was >50 h, the thickness of the whole adsorbed layer increased very little and was finally equal to that of the flattened chains, indicating that the amount of loosely adsorbed chains decreased and disappeared due to the increased amount of flattened chains adsorbed on the substrate surface. The above evidence further proved that the adsorption of flattened chains controlled the adsorption of loose chains.
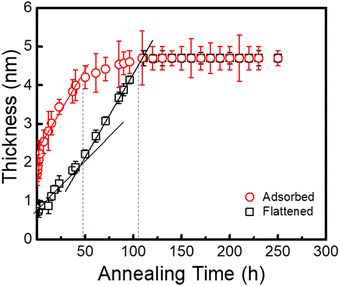 | ||
| Fig. 7 Variation in the thicknesses of the PS (Mw = 225 kDa) interfacial sublayer and flattened layer on the PTS-4 substrate against annealing time at 423 K. | ||
According to the results shown in Fig. 1d, the annealing time to reach quasi-equilibrium for the flattened layer (tflatcross) on all substrates was equal to the crossover time of the adsorption kinetics for the whole adsorbed layer (tadscross). The molecular chains of the flattened layer were tightly packed with many contact sites on the substrate, while the loosely adsorbed layer was formed after the tightly adsorbed layer, with few contact sites on the substrate.42 We recently reported that flattened PS chains on SiO2 could be desorbed,73 but this was more difficult than the desorption of loosely adsorbed PS chains due to the presence of many more contact sites on the substrate. The flattened chains prior to tflatcross underwent a “collapse and zipping-down” procedure on the solid substrate toward a quasi-equilibrium state,47,74 which resulted from the increased quantity of contact sites between the substrate and chain segments overcoming the conformational entropy loss.42,46,75 Therefore, during the formation of the adsorbed layer, we hypothesize that loosely adsorbed chains exist in adsorption–desorption dynamic equilibrium due to the limited availability of contact sites on the substrate surface. However, this process does not occur for flattened chains during the annealing process, wherein the increased number of contact sites for flattened chains results in a more stretched chain conformation at higher “grafting density,” which is enthalpically favored and driven by π–π interactions.58 The distance between contact sites for these adsorbed chains becomes increasingly small, resulting in a thicker flattened layer and closer flattened chains with increasing annealing time until quasi-equilibrium is reached. In this process, the empty contact sites for the adsorption of loose chains decrease, and those adsorbed early are repelled when their contact sites become occupied during the densification process of the flattened layer. Molecular chains arriving later continue to adsorb at empty contact sites, forming loosely adsorbed chains. As for the weak interaction between PS and SiO2, it was clear that the time needed for PS flattened chains to reach quasi-equilibrium was very short (approximately 3 h). Since the quantity of anchoring sites increased with incremental phenyl content, the interfacial energy between PS molecular chains and the phenyl-modified substrate decreased and their π–π interactions increased.45 Therefore, the mobility of the adsorbed flattened chains was considerably suppressed, resulting in the decreasing densification rate of the flattened chains. Correspondingly, the empty sites remaining for loosely adsorbed chains generated slowly, causing a lower adsorption rate. This mechanism was responsible for the adsorption kinetics of the whole adsorbed layer being controlled by the formation of the flattened layer before tadscross. After tflatcross or tadscross, the adsorption of flattened chains on the substrate reached quasi-equilibrium, and the later arriving molecular chains formed the loosely adsorbed layer through the “reeling-in” process, which dominates the adsorption behavior of PS chains.46,76 Both the adsorption rate and amount of loosely adsorbed chains were determined by the empty contact sites remaining after the adsorption of flattened chains. Fewer empty sites resulted in a longer time for the loosely adsorbed chains to reach adsorption quasi-equilibrium and fewer adsorbed chains. Since excluded-volume repulsion by early adsorbed molecular chains and entanglement among adjoining polymer chains likely occurred, sufficient empty space was necessary to accommodate the adsorption of larger polymer chains (high Mw). Since the coverage of flattened chains on neat SiO2–Si was relatively low, vads increased with increasing Mw (vads ∝ Mw0.5) of PS and hequads/Rg was independent of Mw. Correspondingly, the different Mw dependence of the adsorption behavior on PTS-modified substrates (as shown in Fig. 3) was attributed to the reduction in empty space remaining after the adsorption of flattened chains and the increase of polymer/substrate interaction with increasing phenyl content.
4. Conclusions
The adsorption kinetics of PS on phenyl-modified silicon substrates with various phenyl contents were investigated. Different from those for PS adsorption on a neat silicon substrate, vads in the linear regime decreased and the crossover time increased with increasing Mw of PS when the silicon substrate surface was modified with the phenyl group. As the phenyl content increased, both vads and vflat decreased. Meanwhile, the adsorption rate of loosely adsorbed chains was found to be controlled by the formation rate of the flattened layer before tflatcross or tadscross. The mechanism responsible for the phenomenon described above was the preferential formation of flattened adsorbed chains, which occupied adsorption sites on the substrate. Thus, loosely adsorbed chains could only adsorb at the remaining vacancies. When approaching quasi-equilibrium, the increased quantity of contact sites for flattened chains resulted in a more stretched chain conformation at higher grafting density, which was enthalpically favored and driven by π–π interactions. During this process, empty contact sites for loose chain adsorption dynamically decreased, and loose chains adsorbed early were repelled as their contact sites were occupied during the densification process of the flattened layer. Furthermore, owing to π–π interactions between the PS molecular chains and PTS-modified substrates, the mobility of PS molecular chains was suppressed, resulting in a decreased adsorption rate. After the flattened chains reached quasi-equilibrium (t > tflatcross), the adsorption kinetics of the loose chains was determined by the coverage of flattened chains on the substrate, which affected the adsorption rate and amount of loosely adsorbed chains. The adsorption kinetics of the interfacial sublayer on various substrates was dependent on the architecture and formation kinetics of the flattened layer, which affected the empty sites remaining after the adsorption of the flattened chains. Since excluded-volume repulsion from early adsorbed molecular chains and entanglement among adjoining polymer chains likely occurred, sufficient empty space was necessary to accommodate the adsorption of larger polymer chains. The relatively high coverage of flattened chains on PTS-modified substrates resulted in decreasing vads with increasing Mw of PS and Mw-dependent hequads/Rg. These results are conducive to understanding the effects of interfacial non-covalent bonding on the structure and adsorption behavior of polymer chains at the interface, which will contribute to the design and development of supported thin polymer films and nanocomposites.Conflicts of interest
The authors declare no competing financial interests.Acknowledgements
We are thankful for financial support from the National Natural Science Foundation of China (grant no. 22161160317 and 22203075) and the Fundamental Research Funds of Zhejiang Sci-Tech University (No. 22062313-Y).References
- J. L. Keddie, R. A. L. Jones and R. A. Cory, Europhys. Lett., 1994, 27, 59–64 CrossRef CAS.
- J. L. Keddie, R. A. L. Jones and R. A. Cory, Faraday Discuss., 1994, 98, 219–230 RSC.
- C. B. Roth and J. R. Dutcher, J. Electroanal. Chem., 2005, 584, 13–22 CrossRef CAS.
- Y. C. Jean, R. Zhang, H. Cao, J. P. Yuan, C. M. Huang, B. Nielsen and P. Asoka-Kumar, Phys. Rev. B: Condens. Matter Mater. Phys., 1997, 56, R8459–R8462 CrossRef CAS.
- J. A. Forrest and K. Dalnoki-Veress, Adv. Colloid Interface Sci., 2001, 94, 167–195 CrossRef CAS.
- S. Napolitano, Soft Matter, 2020, 16, 5348–5365 RSC.
- B. Zuo, H. Zhou, M. J. B. Davis, X. Wang and R. D. Priestley, Phys. Rev. Lett., 2019, 122, 217801 CrossRef CAS.
- B. Li, S. Zhang, J. S. Andre and Z. Chen, Prog. Polym. Sci., 2021, 120, 101431 CrossRef CAS.
- J. Xu, Y. Zhang, H. Zhou, Y. Hong, B. Zuo, X. Wang and L. Zhang, Macromolecules, 2017, 50, 5905–5913 CrossRef CAS.
- S. Napolitano, E. Glynos and N. B. Tito, Rep. Prog. Phys., 2017, 80, 036602 CrossRef PubMed.
- R. Inoue, M. Nakamura, K. Matsui, T. Kanaya, K. Nishida and M. Hino, Phys. Rev. E: Stat., Nonlinear, Soft Matter Phys., 2013, 88, 032601 CrossRef.
- N. G. Perez-de-Eulate, M. Sferrazza, D. Cangialosi and S. Napolitano, ACS Macro Lett., 2017, 6, 354–358 CrossRef CAS PubMed.
- J. Algers, R. Suzuki, T. Ohdaira and F. H. J. Maurer, Macromolecules, 2004, 37, 4201–4210 CrossRef CAS.
- H. Cao, J.-P. Yuan, R. Zhang, C. S. Sundar, Y. C. Jean, R. Suzuki, T. Ohdaira and B. Nielsen, Appl. Surf. Sci., 1999, 149, 116–124 CrossRef CAS.
- H. Li and S. Yan, Macromolecules, 2011, 44, 417–428 CrossRef CAS.
- B. Zuo, J. Xu, S. Sun, Y. Liu, J. Yang, L. Zhang and X. Wang, J. Chem. Phys., 2016, 144, 234902 CrossRef.
- L. Cartier, T. Okihara, Y. Ikada, H. Tsuji, J. Puiggali and B. Lotz, Polymer, 2000, 41, 8909–8919 CrossRef CAS.
- M. J. Capitán, D. R. Rueda and T. A. Ezquerra, Macromolecules, 2004, 37, 5653–5659 CrossRef.
- S. Napolitano and M. Wübbenhorst, Nat. Commun., 2011, 2, 260 CrossRef.
- S. Z. Sun, H. Xu, J. Han, Y. M. Zhu, B. Zuo, X. P. Wang and W. Zhang, Soft Matter, 2016, 12, 8348–8358 RSC.
- W. Ren, X. Wang, J. Shi, J. Xu, H. Taneda, N. L. Yamada, D. Kawaguchi, K. Tanaka and X. Wang, Soft Matter, 2022, 18, 1997–2005 RSC.
- L. Bai, P. Luo, X. Yang, J. Xu, D. Kawaguchi, C. Zhang, N. L. Yamada, K. Tanaka, W. Zhang and X. Wang, ACS Macro Lett., 2022, 11, 210–216 CrossRef CAS.
- F. F. Zheng, B. Zuo, Y. M. Zhu, J. P. Yang and X. P. Wang, Soft Matter, 2013, 9, 11680–11689 RSC.
- E. Glynos, K. J. Johnson, B. Frieberg, A. Chremos, S. Narayanan, G. Sakellariou and P. F. Green, Phys. Rev. Lett., 2017, 119, 227801 CrossRef.
- J. Xu, X. Wang, L. Chen, W. Ao, B. Zuo, C. Zhang and X. Wang, Macromolecules, 2022, 55, 7110–7116 CrossRef CAS.
- S. Ge, S. Samanta, M. Tress, B. Li, K. Xing, P. DieudonnéGeorge, A. C. Genix, P. F. Cao, M. Dadmun and A. P. Sokolov, Macromolecules, 2021, 54, 4246–4256 CrossRef CAS.
- X. Cheng, K. W. Putz, C. D. Wood and L. C. Brinson, Macromol. Rapid Commun., 2015, 36, 391–397 CrossRef CAS.
- A. P. Holt, P. J. Griffin, V. Bocharova, A. L. Agapov, A. E. Imel, M. D. Dadmun, J. R. Sangoro and A. P. Sokolov, Macromolecules, 2014, 47, 1837–1843 CrossRef CAS.
- K. Yang, X. Y. Huang, Y. H. Huang, L. Y. Xie and P. K. Jiang, Chem. Mater., 2013, 25, 2327–2338 CrossRef CAS.
- M. Inutsuka, M. Haraguchi, M. Ozawa, N. L. Yamada and K. Tanaka, ACS Macro Lett., 2019, 8, 267–271 CrossRef CAS.
- N. Jiang, J. Wang, X. Di, J. Cheung, W. Zeng, M. K. Endoh, T. Koga and S. K. Satija, Soft Matter, 2016, 12, 1801–1809 RSC.
- L. Liu, L. Kong, Q. Li, C. He, L. Ren, Q. Tao, X. Yang, J. Lin, B. Zhao, Z. Li, Y. Chen, W. Li, W. Song, Z. Lu, G. Li, S. Li, X. Duan, A. Pan, L. Liao and Y. Liu, Nat. Electron., 2021, 4, 342–347 CrossRef CAS.
- F. Wu, H. Tian, Y. Shen, Z. Hou, J. Ren, G. Gou, Y. Sun, Y. Yang and T. L. Ren, Nature, 2022, 603, 259–264 CrossRef CAS.
- T. A. Chen, C. P. Chuu, C. C. Tseng, C. K. Wen, H. P. Wong, S. Pan, R. Li, T. A. Chao, W. C. Chueh, Y. Zhang, Q. Fu, B. I. Yakobson, W. H. Chang and L. J. Li, Nature, 2020, 579, 219–223 CrossRef CAS.
- S. Cheng, W. Chen and P. Zhang, Giant, 2022, 9, 100091 CrossRef CAS.
- R. van Erp, R. Soleimanzadeh, L. Nela, G. Kampitsis and E. Matioli, Nature, 2020, 585, 211–216 CrossRef CAS.
- K. Sun, D. Tan, X. Fang, X. Xia, D. Lin, J. Song, Y. Lin, Z. Liu, M. Gu, Y. Yue and J. Qiu, Science, 2022, 375, 307–310 CrossRef CAS PubMed.
- I. A. MacKenzie, L. Wang, N. P. R. Onuska, O. F. Williams, K. Begam, A. M. Moran, B. D. Dunietz and D. A. Nicewicz, Nature, 2020, 580, 76–80 CrossRef CAS.
- J. Xu, S. Wang, G. N. Wang, C. Zhu, S. Luo, L. Jin, X. Gu, S. Chen, V. R. Feig, J. W. To, S. Rondeau-Gagné, J. Park, B. C. Schroeder, C. Lu, J. Y. Oh, Y. Wang, Y. H. Kim, H. Yan, R. Sinclair, D. Zhou, G. Xue, B. Murmann, C. Linder, W. Cai, J. B. Tok, J. W. Chung and Z. Bao, Science, 2017, 355, 59–64 CrossRef CAS.
- B. Zhang, W. Chen, J. Zeng, F. Fan, J. Gu, X. Chen, L. Yan, G. Xie, S. Liu, Q. Yan, S. J. Baik, Z. G. Zhang, W. Chen, J. Hou, M. E. El-Khouly, Z. Zhang, G. Liu and Y. Chen, Nat. Commun., 2021, 12, 1984 CrossRef CAS.
- Z. Zhang, W. Wang, Y. Jiang, Y. Wang, Y. Wu, J. C. Lai, S. Niu, C. Xu, C. C. Shih, C. Wang, H. Yan, L. Galuska, N. Prine, H. Wu, D. Zhong, G. Chen, N. Matsuhisa, Y. Zheng, Z. Yu, Y. Wang, R. Dauskardt, X. Gu, J. B. H. Tok and Z. Bao, Nature, 2022, 603, 624–630 CrossRef CAS PubMed.
- P. Gin, N. Jiang, C. Liang, T. Taniguchi, B. Akgun, S. K. Satija, M. K. Endoh and T. Koga, Phys. Rev. Lett., 2012, 109, 265501 CrossRef PubMed.
- C. Rotella, S. Napolitano, S. Vandendriessche, V. K. Valev, T. Verbiest, M. Larkowska, S. Kucharski and M. Wübbenhorst, Langmuir, 2011, 27, 13533–13538 CrossRef CAS.
- W. Ren, Y. Hong, H. Wei, J. Xu, C. Zhang, X. Zhou and X. Wang, Macromolecules, 2023, 56, 1410–1418 CrossRef CAS.
- Y. Hong, Y. Li, F. Wang, B. Zuo, X. Wang, L. Zhang, D. Kawaguchi and K. Tanaka, Macromolecules, 2018, 51, 5620–5627 CrossRef CAS.
- N. Jiang, J. Shang, X. Di, M. K. Endoh and T. Koga, Macromolecules, 2014, 47, 2682–2689 CrossRef CAS.
- B. O’Shaughnessy and D. Vavylonis, Eur. Phys. J. E: Soft Matter Biol. Phys., 2003, 11, 213–230 CrossRef.
- O. Guiselin, Europhys. Lett., 1992, 17, 225–230 CrossRef CAS.
- C. J. Durning, B. O’Shaughness, U. Sawhney, D. Nguyen, J. Majewski and G. S. Smith, Macromolecules, 1999, 32, 6772–6781 CrossRef CAS.
- C. Housmans, M. Sferrazza and S. Napolitano, Macromolecules, 2014, 47, 3390–3393 CrossRef CAS.
- M. Sen, N. Jiang, J. Cheung, M. K. Endoh, T. Koga, D. Kawaguchi and K. Tanaka, ACS Macro Lett., 2016, 5, 504–508 CrossRef CAS PubMed.
- N. Jouault, J. F. Moll, D. Meng, K. Windsor, S. Ramcharan, C. Kearney and S. K. Kumar, ACS Macro Lett., 2013, 2, 371–374 CrossRef CAS PubMed.
- C. Huang, H. E. Katz and J. E. West, Langmuir, 2007, 23, 13223–13231 CrossRef CAS.
- N. Jiang, J. Cheung, Y. Guo, M. K. Endoh, T. Koga, G. Yuan and S. K. Satija, Macromol. Chem. Phys., 2017, 1700326 Search PubMed.
- Y. Zhang, H. Fan, Y. Wang, B. Zuo, W. Zhang, S. Wang and X. Wang, Soft Matter, 2015, 11, 9168–9178 RSC.
- B. Zuo, C. Li, Q. Xu, K. Randazzo, N. Jiang, X. Wang, R. D. Priestley and U. Glassy, ACS Nano, 2021, 15, 9568–9576 CrossRef CAS.
- Q. Xu, N. Zhu, H. Fang, X. Wang, R. D. Priestley and B. Zuo, ACS Macro Lett., 2021, 10, 1–8 CrossRef CAS PubMed.
- Y. Hong, S. Bao, X. Xiang and X. Wang, ACS Macro Lett., 2020, 9, 889–894 CrossRef CAS PubMed.
- B. Zuo, M. Inutsuka, D. Kawaguchi, X. P. Wang and K. Tanaka, Macromolecules, 2018, 51, 2180–2186 CrossRef CAS.
- W. Ren, Y. Wang, X. Chen, B. Zuo, X. Zhou and X. Wang, Macromolecules, 2018, 51, 195–203 CrossRef CAS.
- J. Xu, Y. Li, X. Wu, B. Zuo, X. Wang, W. Zhang and O. K. C. Tsui, Macromolecules, 2018, 51, 3423–3432 CrossRef CAS.
- D. N. Simavilla, W. Huang, P. Vandestrick, J. P. Ryckaert, M. Sferrazza and S. Napolitano, ACS Macro Lett., 2017, 6, 975–979 CrossRef CAS PubMed.
- D. N. Simavilla, W. Huang, C. Housmans, M. Sferrazza and S. Napolitano, ACS Cent. Sci., 2018, 4, 755–759 CrossRef.
- A. Nelson, J. Appl. Crystallogr., 2006, 39, 273–276 CrossRef CAS.
- G. Vignaud, M. S. Chebil, J. K. Bal, N. Delorme, T. Beuvier, Y. Grohens and A. Gibaud, Langmuir, 2014, 30, 11599–11608 CrossRef CAS.
- J. Xu, Y. Zhang, H. Zhou, Y. Hong, B. Zuo, X. Wang and L. Zhang, Macromolecules, 2017, 50, 5905–5913 CrossRef CAS.
- S. Lee, A. V. Lyulin, C. W. Frank and D. Y. Yoon, Polymer, 2017, 116, 540–548 CrossRef CAS.
- G. Reiter, J. Schultz, P. Auroy and L. Auvray, Europhys. Lett., 1996, 33, 29–34 CrossRef CAS.
- G. Reiter, P. Auroy and L. Auvray, Macromolecules, 1996, 29, 2150–2157 CrossRef CAS.
- E. Raphael and P. G. De Gennes, J. Phys. Chem., 1992, 96, 4002–4007 CrossRef CAS.
- M. Aubouy, G. H. Fredrickson, P. Pincus and E. Raphaeel, Macromolecules, 1995, 28, 2979–2981 CrossRef CAS.
- B. Zuo, S. Zhang, C. Niu, H. Zhou, S. Sun and X. Wang, Soft Matter, 2017, 13, 2426–2436 RSC.
- W. Ren, Y. Li, Y. Tang, J. Xu, C. Zhang, O. K. C. Tsui and X. Wang, ACS Macro Lett., 2023, 12, 854–859 CrossRef CAS.
- B. O’Shaughnessy and D. Vavylonis, Phys. Rev. Lett., 2003, 90, 056103 CrossRef.
- J. M. H. M. Scheutjens and G. J. Fleer, J. Phys. Chem., 1980, 84, 178–190 CrossRef CAS.
- R. Zajac and A. Chakrabarti, Phys. Rev. E: Stat. Phys., Plasmas, Fluids, Relat. Interdiscip. Top., 1995, 52, 6536–6549 CrossRef CAS.
Footnotes |
| † Electronic supplementary information (ESI) available. See DOI: https://doi.org/10.1039/d3sm01339a |
| ‡ J. X. and L. B. contributed equally to this work. |
| This journal is © The Royal Society of Chemistry 2024 |

