A main chain biodegradable polyurethane with anti-protein adsorption and anti-bacterial adhesion performances†
Zhonglin
Cao
 *a,
Chunfeng
Ma
 b,
Li
Xiang
 ac and
Linyan
Cao
*d
aCollege of Materials Science and Engineering, Guizhou Minzu University, Guiyang 550025, China. E-mail: zhonglincao@126.com
bFaculty of Materials Science and Engineering, South China University of Technology, Guangzhou 510640, PR China
cKey Laboratory of Polymer Processing Engineering (South China University of Technology), Ministry of Education, China
dCollege of Chemistry and Bioengineering, Hunan University of Science and Engineering, Yongzhou 425199, China. E-mail: cly917@mail.ustc.edu.cn
First published on 27th November 2023
Abstract
Biofilms are initially formed by substances such as proteins secreted by bacteria adhering to a surface. To achieve a durable antibacterial material, biodegradable dihydroxyl-terminated poly[(ethylene oxide)-co-(ethylene carbonate)] (PEOC(OH)2) with anti-protein adsorption properties was synthesized in this study. Further polycondensation of PEOC(OH)2 and isophorone diisocyanate (IPDI) led to biodegradable polyurethane (PEOC–PU) with PEOC as the soft segment. For comparison, polyurethanes with polyethylene glycol (PEG–PU) and polypropylene glycol (PPG–PU) as soft segments were also synthesized. The chemical structures of the polyurethanes were characterized by 1H NMR and FTIR. The biodegradation behavior of PEOC–PU promoted by lipase due to the presence of ethylene carbonate units was also studied. Their resistance to proteins was studied using quartz crystal microbalance with dissipation (QCM-D) and the results revealed that PEOC–PU exhibited excellent nonspecific resistance to proteins. The colonization of microorganisms on PU in the liquid culture medium was further examined and the results showed that PEOC–PU exhibited excellent antibacterial adhesion performance due to its protein resistance and biodegradation.
Introduction
In modern medicine, to prevent wound infection and promote wound healing, an effective method is the use of medical dressings. Medical dressings should not only be nontoxic, harmless, nonirritating, and of low cost but also have excellent antibacterial properties to prevent wound infection.1,2 Polyurethane is an important material for medical dressings. This is because polyurethane is nontoxic, nonmutagenic and nonallergic and can be easily prepared as coatings, foams, and hydrogels and in other forms for medical dressings. More importantly, polyurethane has a flexible structural design that facilitates the introduction of functional groups possessing antibacterial activity.Traditional antibacterial dressings in clinical applications are mostly prepared by simply adding antibacterial agents.3 However, due to the short effective antibacterial period of traditional antibacterial dressings, treatment is still very difficult once the wound is infected. The main reason for this is that the bacterial biofilm forms on the surface of the dressing after infection. Traditional antibacterial dressings kill free bacteria by releasing antibacterial agents, but their bactericidal effect on bacteria hiding in biofilms is limited. Biofilms can protect bacteria from the action of fungicides and are extremely difficult to remove once they form and settle on the surface of a material. Removing and replacing antibacterial dressings is often the only way to treat wound infections. Therefore, the development of antibacterial materials that can effectively resist biofilm adhesion remains a challenging task in achieving durable medical dressings.
Generally, biofilms are initially formed by substances such as proteins secreted by bacteria adhering to a surface.4,5 Subsequently, bacteria will proliferate, aggregate to form bacterial clusters, and secrete mucus to form biofilms. That is to say, the biofilm is a complex composed of proteins, polysaccharide matrices and bacteria adsorbed on the surface of materials.6 Researchers have done much work to develop protein-resistant materials that can be used to design potential antibacterial adhesion materials. To date, many polymer materials with protein resistance have been found, such as polyethylene glycol (PEG),7–9 polysaccharides,10 poly(vinyl alcohol),11 heparin12 and zwitterion polymers.13,14 The introduction of functional molecules with protein resistance, such as PEG7 or polyzwitterions,15 into antibacterial polymers will further improve their performance. However, the performance of these antibacterial materials in preventing bacterial infections in clinical applications is not satisfactory. It is inevitable that a small amount of biofilm will form and adhere to the surface of the material after long-term use.16 Once bacterial biofilms are formed, the surface properties of the materials change, and their antibacterial ability will be weakened or even lost.17
Generally, the surface of a biodegradable polymer would be gradually decomposed and eroded by the action of enzymes; this surface could then be removed to clear the attached living microorganisms. In other words, biodegradation can result in a self-renewing surface.18–22 After the formation of a small amount of biofilm, the surface of antibacterial materials with self-renewal abilities can be polished to remove the biofilm, exposing new surfaces and restoring antibacterial adhesion performance.23–25 Therefore, a self-renewing material with antibacterial adhesion properties will have outstanding and long-lasting antibacterial properties.
To achieve durable antibacterial activity, in the present study, we synthesized dihydroxyl-terminated PEOC (PEOC(OH)2). PEOC is a main chain biodegradable polymer with antibacterial adhesion properties and it is composed of anti-protein ethylene oxide (EO) segments and ethylene carbonate (EC) segments with biodegradable carbonate bonds.26 The polyaddition of an oligomer with isophorone diisocyanate (IPDI) and 1,4-butanediol (BDO) units generates a biodegradable polyurethane (PEOC–PU). To study the biodegradation, protein resistance, and antimicrobial adhesion properties of PEOC–PU, polyurethanes with soft segments of PEG (PEG–PU) and PPG (PPG–PU) were also synthesized for comparison. Compared to PEOC, there are no degradable structures in the PEG chain, and hence PEG is not biodegradable. The structure of polypropylene glycol (PPG) is similar to PEG, but PPG does not possess protein adsorption resistance due to the dehydrated segment.27 The chemical structures of the polyurethanes were characterized by 1H NMR and FTIR. Furthermore, their resistance to three different proteins was studied using QCM-D, and PEOC–PU showed exceptional nonspecific resistance performance towards the proteins. The lipase enzymatic biodegradation behavior of PU was also studied. The colonization of microorganisms on PU in the culture medium was further investigated. The aim of this study was to develop a PU material with durable and effective protein resistance and antibacterial adhesion properties.
Experimental section
Materials
Tetrahydrofuran (THF), EC and 1,4-butanediol (BDO), which were purchased from Aladdin, were refluxed with calcium hydride and distilled before use. t-BuP4 was purchased from Aldrich. Isophorone diisocyanate (IPDI) and dibutyltin dilaurate (DBTDL) from Aladdin were used as received. The dihydroxyl-terminated polyethylene glycol (PEG(OH)2, Mw = 2000 g mol−1) and polypropylene glycol (PPG(OH)2, Mw = 2000 g mol−1) were purchased from Macklin. Lipase PS was purchased from Aladdin, filtered and freeze-dried before use. Fibrinogen (Fib), BSA and lysozyme (Lys) were purchased from Aldrich. The Mw values of Fib, BSA and Lys are 340, 68 and 14.7 kDa, respectively. The pIs of Fib, BSA and Lys are 5.5, 4.8 and 11.1, respectively. PBS (0.14 M, pH 7.4) was prepared by dissolving Na2HPO4, NaCl, KH2PO4 and KCl in distilled water. The protein was dissolved in PBS buffer with a concentration of 1.0 mg mL−1.The synthesis route of a main chain biodegradable polyurethane with protein resistance and antibacterial adhesion is shown in Scheme 1.
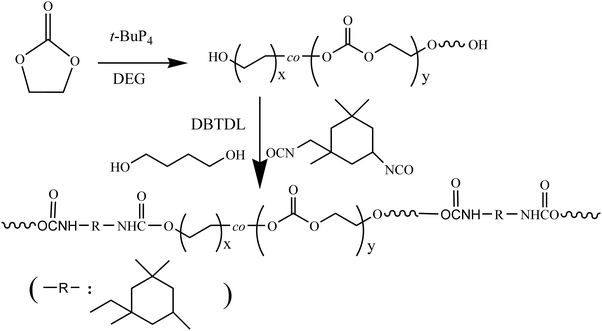 | ||
| Scheme 1 The synthesis route of a main chain biodegradable polyurethane with protein resistance and antibacterial adhesion properties. | ||
Synthesis of PEOC(OH)2
The dihydroxyl-terminated PEOC (PEOC(OH)2) was synthesized by t-BuP4 catalyzed ring-opening polymerization (ROP) of ethylene carbonate (EC). The synthesis was performed in a Schlenk flask with an injection needle. The flask was thoroughly dried by roasting over fire and filling nitrogen by vacuum-nitrogen cycles five times. The ethylene carbonate monomer and ROP initiator DEG were added into the flask under a nitrogen atmosphere. Next, the reactants were degassed using three freeze–pump–thaw cycles. After the reactants had been melted, the catalyst t-BuP4 was added to the flask under a nitrogen gas atmosphere, and the reaction was carried out at 180 °C for 3 hours. The reaction was terminated with hydrochloric acid/methanol solution (1/20 v/v). After the reaction, the product was precipitated in ethyl ether to remove impurities, and the purified PEOC(OH)2 was dried under vacuum.Synthesis of polyurethane with a degradable main chain
PUs were fabricated by two-step condensation polymerization in THF under a nitrogen gas atmosphere. PEOC(OH)2 was dried at 110 °C under vacuum for 2 hours before synthesis reaction. Firstly, IPDI reacted with the soft segment PEOC(OH)2 at 80 °C for 1 hour to obtain a low molecular weight –NCO-terminated PU prepolymer. Next, the chain extender BDO and catalyst DBTDL were added to the flask and reacted at 90 °C for 3 hours. The PU solutions were precipitated in hexane and washed four times, and the obtained PUs were dried under vacuum. The compositions of polyurethanes are listed in Table 1.The different polyurethanes with PEG, PPG, or PEOC as soft segments are marked as X–PU, where X represents soft segments PEG, PPG, or PEOC with a content of about 50 wt%.
Characterization
Biodegradation of polyurethane films
The polyurethane films used for biodegradation were fabricated by solution casting on an epoxy resin panel (20 × 20 mm). Then, the solvent in films was allowed to evaporate completely at room temperature for 5 days. The weight (W0) of the film for each sample along with the panel was recorded. An enzyme solution with a concentration of 0.8 mg mL−1 was prepared by dissolving lipase (PS) in PBS buffer (10 mM, pH 7.4). The PU films along with the panel were placed in a 5 mL enzyme solution at 37 °C and oscillated at 50 rpm. The enzyme solution was replaced every 2 days. Every 2 or 4 days, the samples were taken out, treated with 1% OP-10 solution, and then rinsed with distilled water. After drying to constant weight at 50 °C, the mass (Wt) of the film along with the panel was measured.The remaining mass (wt%) was calculated as follows: remaining mass (wt%) = (Wt − Wpanel)/(W0 − Wpanel) × 100%, where W0, Wt, and Wpanel are the initial mass, the mass after t days degradation of the PU films along with panel, and the mass of the panel, respectively. For each polyurethane, three films along with the panel were fabricated and tested, and three panels were measured, and then the average value was used as its remaining mass.
QCM-D measurements
The anti-protein adsorption study of PU coatings was conducted on QDM-D (Q-Sense AB, Sweden).28,29 The PU coatings used for QCM-D testing were fabricated by spin-casting onto a QCM-D quartz crystal sensor with PU/THF solution (0.5 wt%) using a spin coater (CHEMAT, KW-400) at 4000 rpm and then dried at 50 °C for 24 hours to completely evaporate the solvent. In theory, QCM-D simultaneously recorded the changes in resonance frequency (Δf), which indicated the mass changes of the coating on the sensor surface and the changes in dissipation (ΔD) that reflected the changes in viscoelasticity.30 In the QCM-D measurements, PBS was used as the solvent of protein and eluent. Hence, the curves of ΔD and Δf could reflect the amount and structure of the protein layer adsorbed on the sensor surface, respectively. Because the Δf and ΔD recorded from the first overtone (n = 1) are usually noise components,30 the Δf and ΔD recorded from the third overtone (n = 3) are used. All QCM-D measurements were repeated three times at 25 °C.Bacterial adhesion assays
To study the anti-biofilm performance of the PU film surfaces, the adhesion of the bacteria on the films in the culture medium was tested. Escherichia coli and S. aureus, which are Gram-negative and Gram-positive bacteria, respectively, were used as model bacteria. First, bacterial suspension with a concentration of 109 cells per mL in LB broth (for Escherichia coli) or TSB culture (for S. aureus) medium was prepared. The quartz wafers covered with PU films were placed in 5 mL of bacterial suspension and oscillated for 24 hours at 50 rpm and 37 °C. Then, the films were taken out and rinsed with water three times to remove loosely adhered bacteria. The bacteria adhered on PU films were stained with crystal violet. The bacteria adhered on the surface of PU films were observed under a microscope (Nikon ECLIPSE Ts2, Japan), and three photos at 1000× magnification were taken for each sample. The amount of bacteria in the photos was counted using the ImageJ software. The average values counted from three photos of 200 μm × 200 μm were used to calculate the adhered bacteria per square millimeter. The standard deviations were used as error bars.Results and discussion
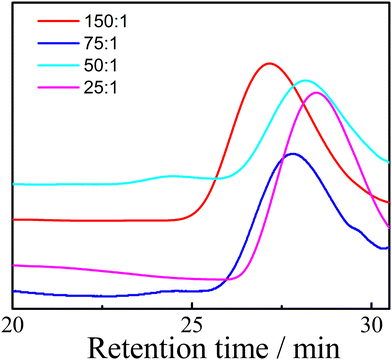
The GPC traces of PEOC(OH)2 with different monomer and initiator ratios are shown in Fig. 1 and the Mn and PDI measured by GPC are listed in Table 2. As the ratio of monomer to initiator increases, the Mn of PEOC increases. The PDIs of all PEOC(OH)2 were below 1.5. PEOC(OH)2 with a monomer to initiator ratio of 25![[thin space (1/6-em)]](https://www.rsc.org/images/entities/char_2009.gif) :
:![[thin space (1/6-em)]](https://www.rsc.org/images/entities/char_2009.gif) 1 was used to synthesize a main chain biodegradable polyurethane.
1 was used to synthesize a main chain biodegradable polyurethane.
| Ratios | M n | PDI |
|---|---|---|
150![[thin space (1/6-em)]](https://www.rsc.org/images/entities/char_2009.gif) : :![[thin space (1/6-em)]](https://www.rsc.org/images/entities/char_2009.gif) 1 1 |
5546 | 1.45 |
75![[thin space (1/6-em)]](https://www.rsc.org/images/entities/char_2009.gif) : :![[thin space (1/6-em)]](https://www.rsc.org/images/entities/char_2009.gif) 1 1 |
4386 | 1.43 |
50![[thin space (1/6-em)]](https://www.rsc.org/images/entities/char_2009.gif) : :![[thin space (1/6-em)]](https://www.rsc.org/images/entities/char_2009.gif) 1 1 |
3339 | 1.44 |
25![[thin space (1/6-em)]](https://www.rsc.org/images/entities/char_2009.gif) : :![[thin space (1/6-em)]](https://www.rsc.org/images/entities/char_2009.gif) 1 1 |
2475 | 1.45 |
As shown in Scheme 1, the preparation of PU is divided into two steps: (1) in the first step, PEOC(OH)2 was synthesized by the ROP of ethylene carbonate (EC) catalyzed by t-BuP4 and subsequently terminated with hydrochloric acid/methanol. The entire preparation process is carried out under a nitrogen atmosphere and under strictly anhydrous conditions. (2) In the second step, PEOC–PU was prepared through two-step condensation polymerization.
From the spectrum of PEOC(OH)2 with a monomer to initiator ratio of 25![[thin space (1/6-em)]](https://www.rsc.org/images/entities/char_2009.gif) :
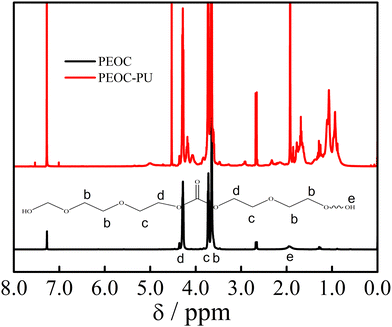
:![[thin space (1/6-em)]](https://www.rsc.org/images/entities/char_2009.gif) 1 in Fig. 2, we could see that three peaks at δ = 3.63, 3.71 and 4.27, (b), (c), and (d), were ascribed to OCH2CH2O, COOCH2CH2O and COOCH2CH2O, respectively. These three peaks indicate that PEOC(OH)2 is a random copolymer of EC and EO.31 The content of EC in PEOC(OH)2 was calculated using the following equation: EC (mol%) = Ad/(Ab + Ac + Ad) × 100%, where Ab, Ac, and Ad are the areas of the peaks b, c, and d, respectively. From the 1H NMR spectrum in Fig. 2, the EC content was found to be 21 mol%. The 1H NMR spectra of PEOC with other monomer to initiator ratios are shown in Fig. S1 (ESI†). The EC contents of PEOC with ratios of 150
1 in Fig. 2, we could see that three peaks at δ = 3.63, 3.71 and 4.27, (b), (c), and (d), were ascribed to OCH2CH2O, COOCH2CH2O and COOCH2CH2O, respectively. These three peaks indicate that PEOC(OH)2 is a random copolymer of EC and EO.31 The content of EC in PEOC(OH)2 was calculated using the following equation: EC (mol%) = Ad/(Ab + Ac + Ad) × 100%, where Ab, Ac, and Ad are the areas of the peaks b, c, and d, respectively. From the 1H NMR spectrum in Fig. 2, the EC content was found to be 21 mol%. The 1H NMR spectra of PEOC with other monomer to initiator ratios are shown in Fig. S1 (ESI†). The EC contents of PEOC with ratios of 150![[thin space (1/6-em)]](https://www.rsc.org/images/entities/char_2009.gif) :
:![[thin space (1/6-em)]](https://www.rsc.org/images/entities/char_2009.gif) 1, 75
1, 75![[thin space (1/6-em)]](https://www.rsc.org/images/entities/char_2009.gif) :
:![[thin space (1/6-em)]](https://www.rsc.org/images/entities/char_2009.gif) 1, and 50
1, and 50![[thin space (1/6-em)]](https://www.rsc.org/images/entities/char_2009.gif) :
:![[thin space (1/6-em)]](https://www.rsc.org/images/entities/char_2009.gif) 1 were 15.8%, 17.5%, and 18.9%, respectively. The peak at δ = 1.93 was attributed to the end hydroxyl group of PEOC(OH)2. Mn of PEOC was estimated according to the areas of the peaks from the 1H NMR spectrum in Fig. 2 as follows: Mn = 116 × (Ab + Ac)/4Ae + 34 × Ad/4Ae = 2300 g mol−1. The Mn of PEOC with a monomer to initiator ratio of 25
1 were 15.8%, 17.5%, and 18.9%, respectively. The peak at δ = 1.93 was attributed to the end hydroxyl group of PEOC(OH)2. Mn of PEOC was estimated according to the areas of the peaks from the 1H NMR spectrum in Fig. 2 as follows: Mn = 116 × (Ab + Ac)/4Ae + 34 × Ad/4Ae = 2300 g mol−1. The Mn of PEOC with a monomer to initiator ratio of 25![[thin space (1/6-em)]](https://www.rsc.org/images/entities/char_2009.gif) :
:![[thin space (1/6-em)]](https://www.rsc.org/images/entities/char_2009.gif) 1 was consistent with the molecular weight measured using GPC. Similarly, the molecular weights calculated from the peak areas in the 1H NMR spectra of PEG(OH)2 and PPG(OH)2 in Fig. S2 and S3 (ESI†) were 2200 and 1900 g mol−1, respectively.
1 was consistent with the molecular weight measured using GPC. Similarly, the molecular weights calculated from the peak areas in the 1H NMR spectra of PEG(OH)2 and PPG(OH)2 in Fig. S2 and S3 (ESI†) were 2200 and 1900 g mol−1, respectively.
From the 1H NMR spectrum of PEOC–PU in Fig. 2, we could see that the signal located in the range of δ = 1.0–2.2 ppm was ascribed to –CH2– and –CH3 in the IPDI unit. Compared with PEOC(OH)2, new peaks at δ = 3.75, δ = 2.91 and δ = 4.5–5.0 ppm were ascribed to NHCOOCH2, CH2NHCOO and NHCOO, respectively. The characteristic signals belonging to PEOC(OH)2 are shown in Fig. 2. In summary, the 1H NMR results indicated that the target polyurethane PEOC–PU was obtained. The 1H NMR spectra of PEG(OH)2, PEG-PU, PPG(OH)2 and PPG-PU are provided in Fig. S2 and S3 (ESI†), which demonstrate that PEG–PU and PPG–PU were also successfully synthesized.
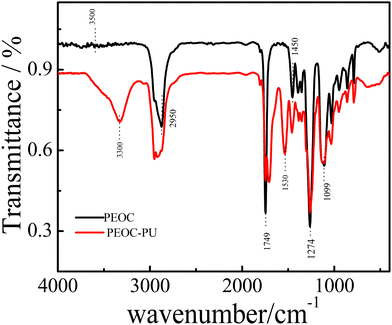
Fig. 3 shows the FTIR spectra of PEOC(OH)2 and PEOC–PU. The black line in Fig. 3 shows the infrared curve of PEOC(OH)2. The weak peak at 3500 cm−1 was attributed to the stretching vibrations of the end O–H group. The signals appearing at approximately 1749 cm−1 belonged to the stretching vibrations of C![[double bond, length as m-dash]](https://www.rsc.org/images/entities/char_e001.gif) O. The peaks at 1450 cm−1 and 2950 cm−1 belonged to the bending vibrations and stretching vibrations of C–H, respectively. The peaks at 1099 cm−1 and 1274 cm−1 belonged to the stretching vibrations of C–O in EO and EC units, respectively. The red line in Fig. 3 shows the infrared curve of PU using PEOC(OH)2 as the soft segment. The peaks at approximately 3300 cm−1 and 1533 cm−1 could be assigned to the stretching vibrations and bending vibration of the N–H bond in carbamate, respectively.32 The peaks at 1710 cm−1 suggested stretching vibrations of the C=O bond in carbamate. Hence, we confirmed that we successfully synthesized PEOC–PU. Similarly, the successful synthesis of PEG–PU and PPG–PU was also confirmed by the FTIR spectra of PEG(OH)2, PEG-PU, PPG(OH)2 and PPG-PU in Fig. S4 and S5 (ESI†).
O. The peaks at 1450 cm−1 and 2950 cm−1 belonged to the bending vibrations and stretching vibrations of C–H, respectively. The peaks at 1099 cm−1 and 1274 cm−1 belonged to the stretching vibrations of C–O in EO and EC units, respectively. The red line in Fig. 3 shows the infrared curve of PU using PEOC(OH)2 as the soft segment. The peaks at approximately 3300 cm−1 and 1533 cm−1 could be assigned to the stretching vibrations and bending vibration of the N–H bond in carbamate, respectively.32 The peaks at 1710 cm−1 suggested stretching vibrations of the C=O bond in carbamate. Hence, we confirmed that we successfully synthesized PEOC–PU. Similarly, the successful synthesis of PEG–PU and PPG–PU was also confirmed by the FTIR spectra of PEG(OH)2, PEG-PU, PPG(OH)2 and PPG-PU in Fig. S4 and S5 (ESI†).
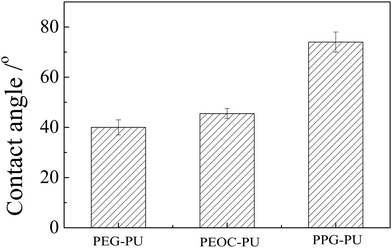
The wettabilities of the PEG–PU, PEOC–PU and PPG–PU coatings were studied by measuring the contact angle. Their static contact angle data are shown in Fig. 4. The weight percentages of the soft segment for the three PUs were all approximately 50%. The contact angle of PEG–PU was approximately 40°, which indicated that the PEG–PU coating was relatively hydrophilic due to the hydration of PEG segments. Compared with PEG–PU, the water contact angle of PEOC–PU slightly increased due to the addition of hydrophobic EC segments in the structure of PEOC. Compared with the PEOC brush whose contact angle was 35.9°,26 PEOC–PU had a greater contact angle. This was because, hydrophobic IPDI units were also introduced into the PU chain. The ester bonds in the EC segment endowed PEOC–PU with biodegradability. The hydration of EO segments made PEOC–PU relatively hydrophilic. The strong hydrophilicity of the coating could improve its anti-protein adsorption performance, because a stable hydration layer can be formed on the surface of the hydrophilic coating, which can prevent protein adsorption.33 The contact angle of the PPG–PU coating was significantly greater than those of PEG–PU and PEOC–PU. This was because the PPG segment was dehydrated at the experimental temperature.27
The enzymatic degradation behavior of PUs has also been studied. Fig. 5 shows the time dependence of the remaining masses of PEG–PU, PEOC–PU and PPG–PU films in 0.8 mg mL−1 lipase solution at 37 °C. With the extension of experimental time, the remaining mass of PEG–PU had been maintained at about 93%, and the remaining mass of PPG-PU had been maintained at about 97%. The result indicated that the masses of the PEG–PU and PPG–PU films almost did not change over time due to the lack of a biodegradable construct. The remaining mass of the PEOC–PU film gradually decreased over time. The decrease in the mass of the PEOC–PU film could be attributed to the biodegradation of carbonate in PEOC. The polymer chains on the surface of the material were degraded by enzymes and transformed into small molecules, which dissolved in the solution, leading to the surface erosion of the PEOC–PU film. It is worth noting that in the first 14 days of degradation, the remaining mass of the PEOC–PU film almost linearly decreased, suggesting the uniform degradation of the PEOC–PU film. The reason for this is that the degradable EC units are randomly copolymerized in the soft segment PEOC, which is amorphous, resulting in a uniform distribution of degradable units in the PEOC–PU film.31 In addition, the surface erosion of PEOC could be induced by the cholesterol esterase enzyme, which is a kind of lipase.34 After the degradation of EC units on the top of the film, the old surface peels off and new surfaces are exposed. That is to say, the PEOC–PU film is a self-renewing surface. The biodegradation of materials led to the self-renewal performance of films, which had also been reported in other studies.32 Besides, after 14 days of biodegradation using the enzyme, the PEOC–PU film was too thin and ruptured, resulting in a significant reduction in its mass. Based on the above analysis, the biodegradable PEOC–PU film in our study has the potential to maintain antibacterial adhesion properties for a long period of time due to its self-renewal performance.
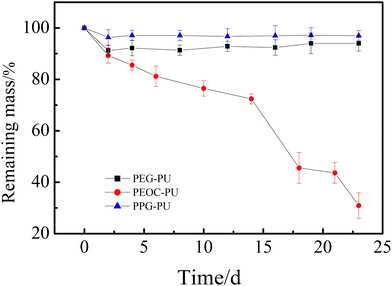 | ||
| Fig. 5 Remaining masses of PEG-PU, PEOC-PU and PPG-PU films incubated with 0.8 mg mL−1 of lipase solution. Values are presented as means ± SD (n = 3). | ||
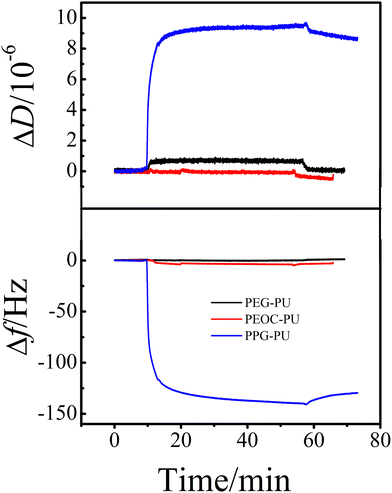
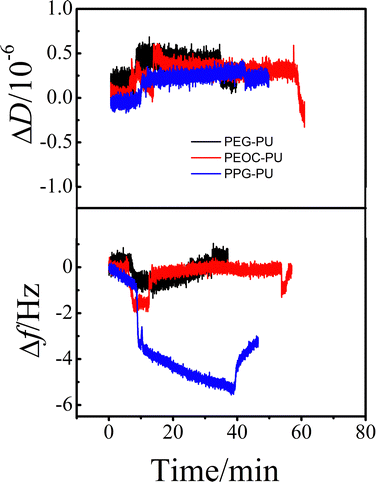
Protein adsorption is the initial step of bacterial adhesion on surfaces, and so the anti-protein adsorption performances of the PEG–PU, PEOC–PU and PPG–PU coatings were investigated. Three kinds of proteins (BSA, Lys, and Fib) with different molecular weights and charges were used for anti-protein adsorption studies on coating surfaces. Fig. 6 shows the time dependence of ΔD and Δf for BSA adsorption on different coatings in PBS at 25 °C. In PBS (pH ∼ 7.4), BSA is a hydrophobic protein with negative charges. For the PPG–PU coating, after the addition of fibrinogen solution, the Δf curve first rapidly decreases and then gradually leveled off. After rinsing with PBS solution, there is still a significant decrease in Δf. On the other hand, there is a significant increase in ΔD. According to theory, an increase in the mass of the material on the sensor surface results in a decrease in Δf, while an increase in the thickness of the material on the sensor surface results in an increase in ΔD.28,35 The decrease of Δf and the increase of ΔD in Fig. 6 indicated that BSA was adsorbed on the surface of the PPG–PU coating. However, for PEG–PU and PEOC–PU coatings, after rinsing with blank PBS, both Δf and ΔD returned to the baseline, indicating that BSA could not be adsorbed on the surfaces of these two coatings. That is to say, the PEG–PU and PEOC–PU coatings presented outstanding resistance to BSA. Compared to BSA, fibrinogen used in this study with a bigger molecular size has greater adsorption capacity because of the greater intermolecular interactions between the protein and coatings. Similar to the adsorption of BSA, for the adsorption of fibrinogen on PEG–PU and PEOC–PU coatings, Δf and ΔD are approximately zero (Fig. 7). Fig. 8 shows the time dependence of ΔD and Δf for lysozyme adsorption on different PU coatings. Among the three proteins, lysozyme has the smallest molecular size and with a positive charge in PBS with pH ∼ 7.4. For PEG–PU and PEOC–PU coatings, after rinsing with blank PBS, Δf and ΔD returned to the baseline. All these studies on anti-protein adsorption had shown that PEG–PU and PEOC–PU coatings show excellent anti-non-specific protein adsorption performance, regardless of the molecular size and charge of the protein. The PEO and PEG based polymers have been proved to show excellent protein adsorption resistance due to the hydration of the surface of materials.9,27 PEOC(OH)2 used in this study has approximately 79% EO units (Fig. 2). So the excellent anti-protein adhesion performance of the PEOC–PU coating is attributed to the closely bound hydration layer of EO chain segments.
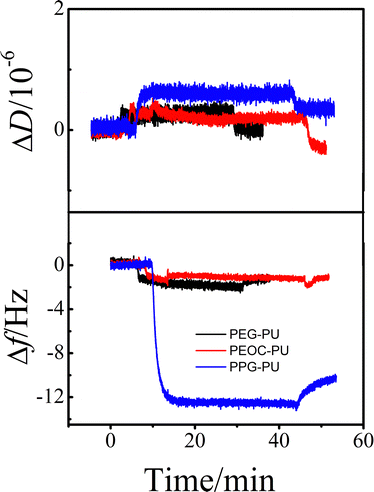 | ||
| Fig. 6 The time dependence of the changes in ΔD and Δf for BSA adsorption on PEG–PU, PEOC–PU and PPG–PU at 25 °C. | ||
 | ||
| Fig. 7 The time dependence of the changes in ΔD and Δf for fibrinogen adsorption on PEG–PU, PEOC–PU and PPG–PU at 25 °C. | ||
 | ||
| Fig. 8 The time dependence of the changes in ΔD and Δf for lysozyme adsorption on PEG–PU, PEOC–PU and PPG–PU at 25 °C. | ||
To evaluate the influence of biodegradation on the protein resistance of PU coatings, the time dependence of ΔD and Δf of the protein adsorbed on the PEOC–PU coating after degradation was determined and is shown in Fig. 9. After 7 days of degradation, whether the protein is Fib, BSA, or Lys, the Δf and ΔD of the PEOC–PU coatings remained close to the baseline. This means that after 7 days of degradation, the PEOC coating still exhibits excellent resistance to non-specific protein adsorption. This is because the steady degradation of the PEOC–PU coating can remove the inevitable pollutants adhered on the coating surface. That is to say, the coating is a self-renewing surface in enzymatic environments.
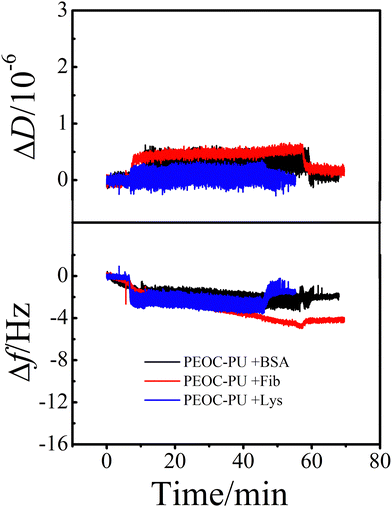 | ||
| Fig. 9 The time dependence of the changes in ΔD and Δf for the proteins adsorbed on the PEOC–PU coating degraded in 0.8 mg mL−1 of lipase solution (PBS, pH 7.4) at 37 °C for 7 days. | ||
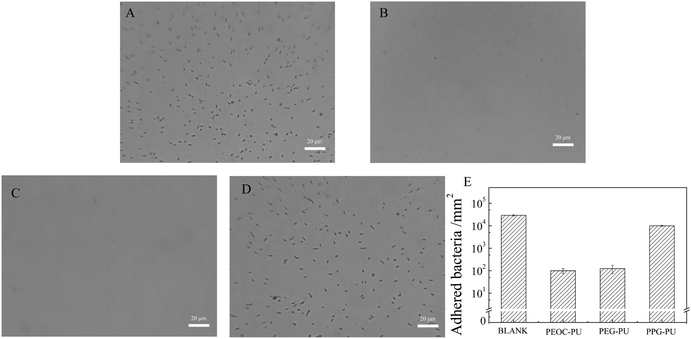
To illustrate the anti-biofilm performance of the PEOC–PU film, the effect of the soft segment of PU on the colonization of microorganisms was examined. Fig. 10 shows the typical microscopic pictures of PEG–PU, PEOC–PU and PPG–PU films after immersion in Escherichia coli suspension in the culture medium for 24 hours. The quantitative evaluation of microbial adhesion is performed by counting the bacteria adhering to the PU film in the photos and by calculating the adhered bacteria per square millimeter (Fig. 10E). After the blank quartz wafers (Fig. 10A) and PPG–PU film (Fig. 10C) were immersed in an Escherichia coli suspension for 24 h, a large number of Escherichia coli in strip form adhered to the surfaces. In contrast, there was only a small amount of bacteria adhered to the PEG–PU and PEOC–PU films. Similar to the adhesion of Escherichia coli, the adhesion of S. aureus on PEG–PU and PEOC–PU coatings is approximately zero (Fig. S6, ESI†). However, there were a large number of S. aureus bacteria adhered on the blank quartz wafers and PPG–PU film. These results indicated that the PEG–PU and PEOC–PU films showed excellent anti-bacterial adhesion performance, which was attributed to the outstanding anti-protein adsorption performance of the films. The adhesion of bacteria on the surface begins with the adhesion of various proteins.4 For the PEOC film, the self-renewal of the film surface caused by biodegradation is also an important factor contributing to its good anti-bacterial adhesion performance.26 It is worth noting that the renewable PU film prepared using PEOC(OH)2 in this study can maintain long-term anti-bacterial adhesion performance.
Generally, bacteria settle on a surface and secrete glue-like substances to anchor the microbial cells. Then, biofilms are formed.36 Biofilms are extremely important for the settling of fouling species on man-made surfaces. Thus, developing anti-biofilm materials is a promising way to prevent bacterial infections in biomedicine. Since the PEOC–PU film could prevent the adhesion of bacteria, it further had the potential to prevent biofilm formation. PEOC–PU has potential in biomedical applications, such as medical dressings. That is to say, this study provides new ideas for the development of biomedical materials for preventing bacterial infections.
Conclusion
The dihydroxyl-terminated PEOC (PEOC(OH)2) with anti-protein adsorption properties was synthesized by the ROP of EC. A main chain biodegradable polyurethane (PEOC–PU) with PEOC as the soft segment was synthesized. The results of several measurements (1H NMR and FTIR) demonstrated the structures of the obtained PUs. The QCM-D study showed that PEOC–PU presented outstanding nonspecific resistance to different proteins. The PEOC–PU film was biodegradable due to the ethylene carbonate units. The colonization of microorganisms on the PEOC–PU film was much less than that on the PPG–PU film, revealing its outstanding antibacterial adhesion performance because of its protein resistance and biodegradation properties. It is worth noting that the biodegradation of EC units in the PEOC segment makes the PEOC–PU film a self-renewable material that will maintain long-term antibacterial adhesion performance. In conclusion, PEOC–PU could hopefully be used in medical antibacterial dressings.Conflicts of interest
There are no conflicts to declare.Acknowledgements
Financial support from the Science and Technology Fund of Guizhou Province, P. R. China (No. ZK [2021] 250), Youth Science and Technology Talent Growth Project of Education Department of Guizhou Province, P. R. China (No. KY [2021]122), the Science, Technology Foundation of Guizhou Minzu University, China (Grant No. GZMUZK [2021] YB02) and the Opening Project of Key Laboratory of Polymer Processing Engineering (South China University of Technology), Ministry of Education (Grant No. KFKT2003) is acknowledged. The authors thank Prof. Zhang Guangzhao from the South China University of Technology for their help with QCM-D measurements.References
- C. M. Deng, L. Z. He, M. Zhao, D. Yang and Y. Liu, Carbohydr. Polym., 2007, 69, 583–589 CrossRef CAS.
- W. Xiao-Chun, Prog. Mod. Biomed., 2007, 7, 1228–1229 Search PubMed.
- X. Zhao, B. L. Guo, H. Wu, Y. P. Liang and P. X. Ma, Nat. Commun., 2018, 9, 2784 CrossRef.
- C. R. Arciola, D. Campoccia and L. Montanaro, Nat. Rev. Microbiol., 2018, 16, 397–409 CrossRef CAS PubMed.
- K. T. Hughes and H. C. Berg, Science, 2017, 358, 446–447 CrossRef CAS.
- J. H. Ch'ng, K. K. L. Chong, L. N. Lam, J. J. Wong and K. A. Kline, Nat. Rev. Microbiol., 2019, 17, 82–94 CrossRef.
- Y. D. Zhang, X. Zhang, Y. Q. Zhao, X. Y. Zhang, X. K. Ding, X. J. Ding, B. R. Yu, S. Duan and F. J. Xu, Biomater. Sci., 2020, 8, 997–1006 RSC.
- P. Lundberg, A. Bruin, J. W. Klijnstra, A. M. Nyström, M. Johansson, M. Malkoch and A. Hult, ACS Appl. Mater. Interfaces, 2010, 2, 903–912 CrossRef CAS.
- P. M. Imbesi, N. V. Gohad, M. J. Eller, B. Orihuela, D. Rittschof, E. A. Schweikert, A. S. Mount and K. L. Wooley, ACS Nano, 2012, 6, 1503–1512 CrossRef CAS.
- M. Yahyaei, F. Mehrnejad, H. Naderi-Manesh and A. H. Rezayan, Carbohydr. Polym., 2018, 191, 191–197 CrossRef CAS PubMed.
- J. A. Park and S. B. Kim, J. Membr. Sci., 2017, 540, 192–199 CrossRef CAS.
- A. Barrantes, J. Wengenroth, T. Arnebrant and H. J. Haugen, J. Colloid Interface Sci., 2017, 485, 288–295 CrossRef CAS.
- A. Sinclair, M. B. O'Kelly, T. Bai, H. C. Hung, P. Jain and S. Y. Jiang, Adv. Mater., 2018, 30, 1–8 Search PubMed.
- F. Sun, H. C. Hung, A. Sinclair, P. Zhang, T. Bai, D. D. Galvan, P. Jain, B. W. Li, S. Y. Jiang and Q. M. Yu, Nat. Commun., 2016, 7, 13437 CrossRef CAS.
- T. Zhang, J. Gu, X. Liu, D. Wei and S. Chen, Mat. Sci. Eng. C, 2020, 111, 110855 CrossRef CAS.
- C. F. Ma, H. J. Yang, X. Zhou, B. Wu and G. Z. Zhang, Colloids Surf., B, 2012, 100, 31–35 CrossRef CAS PubMed.
- J. Koc, T. Simovich, E. Schönemann, A. Chilkoti, H. Gardner, G. W. Swain, K. Hunsucker, A. Laschewsky and A. Rosenhahn, Biofouling, 2019, 35, 454–462 CrossRef CAS.
- J. Pan, X. Ai, C. Ma and G. Zhang, Acc. Chem. Res., 2022, 11, 3312–3317 Search PubMed.
- Q. Xie, Q. Xie, J. Pan, C. Ma and G. Zhang, ACS Appl. Mater. Interfaces, 2018, 10, 11213–11220 CrossRef CAS PubMed.
- X. Ai, L. Mei, C. Ma and G. Zhang, Prog. Org. Coat., 2021, 153, 106141 CrossRef CAS.
- J. Pan, L. Mei, H. Zhou, C. Zhang, Q. Xie and C. Ma, Prog. Org. Coat., 2022, 163, 106674 CrossRef CAS.
- G. Dai, Q. Xie, C. Ma and G. Zhang, ACS Appl. Mater. Interfaces, 2019, 11, 11947–11953 CrossRef CAS PubMed.
- T. Wei, W. J. Zhan, Q. Yu and H. Chen, ACS Appl. Mater. Interfaces, 2017, 9, 25767–25774 CrossRef CAS PubMed.
- T. Wei, Q. Yu and H. Chen, Adv. Healthcare Mater., 2019, 8, 1801381 CrossRef CAS.
- E. K. Riga, M. Vohringer, V. T. Widyaya and K. Lienkamp, Macromol. Rapid Commun., 2017, 38, 1700216 CrossRef.
- Z. L. Cao, T. S. Gan, G. X. Xu and C. F. Ma, Langmuir, 2019, 35, 14596–14602 CrossRef CAS.
- C. F. Ma, G. Y. Zhou and G. Z. Zhang, J. Polym. Sci., Part B: Polym. Phys., 2010, 48, 1987–1993 CrossRef CAS.
- M. V. Voinova, M. Rodahl, M. Jonson and B. Kasemo, Phys. Scr., 1999, 59, 391 CrossRef CAS.
- L. Daikhin and M. Urbakh, Faraday Discuss., 1997, 107, 27–38 RSC.
- N. J. Cho, C. W. Frank, B. Kasemo and F. Höök, Nat. Protoc., 2010, 5, 1096–1106 CrossRef CAS PubMed.
- H. J. Yang, M. Q. Yan, S. Pispas and G. Z. Zhang, Macromol. Chem. Phys., 2011, 212, 2589–2593 CrossRef CAS.
- C. Ma, L. Xu, W. Xu and G. Zhang, J. Mater. Chem. B, 2013, 1, 3099–3106 RSC.
- C. Ma, Y. Hou, S. Liu and G. Zhang, Langmuir, 2009, 25, 9467–9472 CrossRef CAS.
- D. F. Chu, C. Curdy, B. Riebesehl, Y. Zhang, M. Beck-Broichsitter and T. Kissel, Eur. J. Pharm. Biopharm., 2013, 85, 1232–1237 CrossRef CAS.
- M. Rodahl, F. Hook, A. Krozer, P. Brzezinski and B. Kasemo, Rev. Sci. Instrum., 1995, 66, 3924–3930 CrossRef CAS.
- X. Chen, S. R. Suwarno, T. H. Chong, D. McDougald, S. Kjelleberg, Y. Cohen, A. G. Fane and S. A. Rice, Biofouling, 2013, 29, 319–330 CrossRef CAS PubMed.
Footnote |
| † Electronic supplementary information (ESI) available: Synthetic route for the synthesis of FMA; 1H NMR and FTIR spectra of PEG(OH)2, PEG-PU, PPG(OH)2 and PPG-PU. See DOI: https://doi.org/10.1039/d3sm01344h |
| This journal is © The Royal Society of Chemistry 2024 |

