 Open Access Article
Creative Commons Attribution 3.0 Unported Licence
Aluminosilicate colloidal gels: from the early age to the precipitation of zeolites†
Arnaud
Poulesquen
 *a,
Donatien
Gomes Rodrigues
 b,
Bavand
Keshavarz
 c,
Nicolas
Courtois
 a,
Jan
Ilavsky
 d and
Gareth H.
McKinley
 e
e
aCEA, DES, ISEC, DPME, Univ. Montpellier, F-30207 Bagnols-sur-Cèze, France. E-mail: arnaud.poulesquen@cea.fr
bCEA, DES, ISEC, DMRC, Univ. Montpellier, F-30207 Bagnols-sur-Cèze, France
cDepartment of Mechanical Engineering and Materials Science, Duke University, Durham, NC, USA
dAdvanced Photon Source, Argonne National Laboratory, Lemont, Illinois 60439, USA
eHatsopoulos Microfluids Laboratory, Department of Mechanical Engineering, Massachusetts Institute of Technology, Cambridge, Massachusetts 02139, USA
First published on 19th June 2024
Abstract
Aluminosilicate hydrogels are often considered to be precursors for the crystallisation of zeolites carried out under hydrothermal conditions. The preparation of mechanically homogeneous aluminosilicate gels enables the study of these materials through bulk rheology and observation of the aging dynamics until the precipitation of crystalline zeolites. The first part of this study deals with the establishment of ternary state diagrams, in order to identify the range of chemical formulations that enable preparation of single-phase homogeneous gels. Then, by studying the viscoelastic moduli during the gelation reaction, and by yielding the gel under large deformation, we propose an empirical law considering the partial order of reaction on each chemical element, to predict the gelation time according to the chemical formulation. The scaling behavior of the elastic properties of this colloidal gel shows a transition from a strong link behavior to a weak link regime. Long term aging results in the shrinkage of the gel, accompanied by syneresis of interstitial liquid at the surface. Zeolites precipitate through crystallisation by a particle attachment mechanism, when thermodynamic equilibrium is reached. The stoichiometry of the precipitated zeolites is not only consistent with the concentration of the remaining species in the supernatant but, surprisingly, it is also very close to the partial order of the reaction of the chemical elements involved in the determination of the critical gel point. This indicates a strong correlation between the morphology of the soft amorphous gel network that is formed at an early age and those of the final solid precipitated crystals.
1 Introduction
Aluminosilicate-based materials, such as synthetic zeolites or alkali activated materials (AAM), also referred to as geopolymers, have many applications in various areas such as catalysis or adsorption processes for separation,1,2 construction materials,3,4 wastewater treatment by ionic exchange processes,5,6 soil stabilization by grouting7,8 as well as in the nuclear industry.9–13 For both classes of materials, the synthesis process relies on polycondensation reactions that occur in the molecular scale between alkali silicate and aluminate species in solution.14–16 In the case of geopolymers, the aluminates emerge from the slow dissolution of aluminosilicate precursors as metakaolin,17 fly ash or slags.18,19 In the case of zeolite production, however, the aluminates are introduced directly into the alkali silicate solution, which initiates the fast reaction between silicate and aluminate groups due to the very high reactivity between the two species.16,20,21 Although both classes of alumino-silicate-based materials are synthesized with the same chemical elements (Si, Al, Na and H2O), there are two major differences between them. Firstly, the reaction mixture differs between these two materials. Indeed, in contrast to the synthesis of geopolymer binders,22 a high water content and limited alkalinity are necessary for the production of zeolites. Secondly, zeolite-type materials are usually synthesized under hydrothermal conditions which commonly refers to a range of techniques for crystallizing substances from high-temperature aqueous solutions at high vapor pressures that can be considered as a “black box”, whereas AAM or geopolymers are often produced at room temperature. For zeolites, the resulting solid material consists of a powdered crystalline structure made of silicon, aluminum and oxygen that form a highly structured framework with cavities and nanochannels through which cations, water and/or small molecules may be transported through.1 On the other hand, geopolymers are micro–meso–macroporous monolithic amorphous materials, with a framework composed of SiO4 and AlO4 tetrahedra.23 A cation (often Na and/or K) compensates for the charge deficiency of aluminum atoms and the porosity is fully saturated with highly concentrated pore water, triggering the ionic exchange process. They are considered to be zeolite precursors due to the fact that at room temperature they are in a metastable state but they can ultimately be crystallized into zeolitic structures if heated at high temperature.24Before their transformation to solid materials (powder or monolith for zeolites and geopolymers, respectively), the evolution of their viscoelastic properties may be monitored as a function of time. For geopolymers, the viscoelastic moduli slowly increase over a few hours, until the gelation time is reached and the material turns into a viscoelastic solid with an elastic modulus around a few MPa.25,26 In the case of hydrogels, also considered as amorphous precursors of zeolites, the kinetics of gelation is faster (shorter than one hour) and the elastic modulus only ranges from a few Pa to a few kPa.16,27,28
Most synthetic zeolites are usually formed in basic media (mainly with hydroxide ions as the mineralizing agent) using alkali and/or tetra-alkylamonium cations as a structure-directing agent,29 with the exception of some recent studies where zeolite precipitation has been extended into acidic media.30 As pointed out in the review by Valtchev et al.,21 depending on the specific details of the chemical formulation (such as the Si/Al ratio, the concentration of alkali cation and the water content), the zeolites formed may vary from ultra-dense gels and hydrogels to optically clear solutions. Although the hydrogel systems are complex due to their inhomogeneity, study of their rheomechanical properties is of particular importance due to their widespread use in the production of industrial zeolites.31 Many studies have been dedicated to characterization of the gels, with direct observations by high resolution transmission electron microscopy (HRTEM), scanning electron microscopy (SEM), transmission electron microscopy (TEM)31–34 and in situ atomic force microscopy (AFM).35,36 These studies have been used to image the evolution of the amorphous gel over time, until the ultimate state involving crystallisation and growth of the zeolites. Spectroscopic techniques such as Fourier transform infrared (FTIR),34 and27 Al or29 Si nuclear resonance magnetic (NMR),27,28,37–39 are also very useful for identifying the connectivity of the spatial framework and the structure of the aluminosilicate generated (e.g. the coordination of silicon and aluminum atoms) in the solid network. In basic media, tetrahedral TO4 networks where T = Si or Al derived from the polycondensation of soluble species in the mixture constitute the spatial framework of the growing zeolites. Time-resolved scattering techniques using neutrons or X-rays offer the advantage of probing in situ the structural evolution at mesoscales in a non-invasive manner. Complementary to direct visualisation, scattering has been widely utilized to study colloids suspended in a clear sol40–44 or in hydrogel systems.16,28 Obviously, structural parameters such as the size of the primary aluminosilicate particles, the cluster size and the fractal dimension of such aggregates strongly depend on the chemical formulation of the initial ingredients and parameters such as the Si/Al ratio, aluminum concentration, water content, and nature of the alkali cations as well as the conditions of synthesis such as temperature and relative humidity.
The selection of the starting materials and especially the silicon source can have a very pronounced impact on the formation mechanism of the final product. Indeed, if silica nanoparticles such as a Ludox colloidal suspension are used as precursors, an initial dissolution step occurs in alkaline media, releasing some silicate monomers or oligomers into the reactive mixture.45 On contact with a source of alumina, polymerization is initiated between aluminate and silicate, forming a gel around the remaining undissolved silica particles, driving their aggregation into worm-like particles (WLPs).46–48 In the case of an alkali silicate solution, also referred to as waterglass, the silicates are already dissolved and possess different degrees of connectivity, denoted Qi (with i = 1 to 4), where the proportion of each constituent can be tuned with the alkali content.49,50 The average connectivity of the Si centers decreases when the alkali hydroxide concentration increases, yielding smaller and more reactive species (with respect to the alumina source). In either of the two scenarios discussed above, an amorphous precursor is always observed before and throughout the nucleation of zeolites, leading to a two-step nucleation process, often referred to as a “non-classical pathway”,51 which is also observed in many other crystallisation processes.52 Several mechanisms have been proposed to describe the induction period, such as aggregation, densification, formation of voids or appearance of an alkali-rich zone. Dynamical changes take place before and throughout the nucleation process,21,33,42,43,46,51 but a global framework for zeolite synthesis is yet to be provided.
Our purpose in this paper is not to specifically study the nucleation and growth of the zeolites, but rather to provide new insights into the early stage processes occurring before the crystallisation of zeolites. Our main focus is on the rheological, structural and aging aspects of these hydrogels, as we vary the relative chemical composition of the building elements. To the best of our knowledge, there is a paucity of substantive studies on the effect of formulation changes on the developing rheological properties of homogeneous aluminosilicate hydrogels, with the exception of a few specific studies that are focused on geopolymer gels.27,28
Recently, we studied the rheology of aluminosilicate hydrogels16 and showed that this class of aging materials can be considered to be weak colloidal physical gels in which the particles interact with each other via a potential well described by the DLVO (Derjaguin, Landau, Verwey and Overbeek) theory.53 The characterization of these gels at the mesoscale using time-resolved SAXS and USAXS reveals that the kinetics of polycondensation are very fast, with initial consumption of dissolved silicate at high q (small length scale) resulting in rapid aluminsosilicate growth, reaching a size around 1 nm. These building units aggregate to form clusters with a fractal dimension around 2 ≤ df ≤ 2.1, suggesting a reaction-limited cluster aggregation mechanism.54 The Si/Al ratio is sufficiently low, meaning that the aluminum content is sufficiently high (Si/Al ≈ 10 and [Al] = 0.12 mol l−1) to produce a homogeneous hydrogel with an elastic modulus of a few kPa. Indeed, the volume fraction of particles (ϕ ≈ 1–2%) is sufficient to form a space-spanning network whose strength depends on the chemical and physical nature of the underlying framework,55,56 as we will examine in detail later in this paper.
From a mechanical characterisation point of view, the evolution of the viscoelastic parameters can also be monitored during gelation using novel time-resolved waveforms such as exponential chirps.57 Using the concept of time-connectivity superposition we can generate a master curve of the mechanical response of these gels over 7–8 decades of frequency (or a similar range of corresponding timescales). These master curves for the dynamic mechanical properties and the evolving relaxation time spectrum of these gels reveal the dual nature of these materials; they exhibit both gel- and glass-like behaviors at large and small length- and time-scales, respectively. This behavior can be well described using a simple three-parameter model called the Fractional Maxwell Gel (FMG).16,58 Another key finding from our previous study is the observation that the fractal structure of the nanoparticle gel is set at the critical gel point and these fractal remnants persist in the microstructure of the underlying network during the subsequent aging process. This resonates with the seminal observations of Martin and Adolf59 in the context of chemically cross-linked gels that “the structures formed at the gel point are not completely absent in the final gel” and our findings show that similar principles apply to colloidal physical gels. This observation can also rationalize results from other studies such as the one by Valtchev and Tosheva,21 in which the authors state that the initial polymerization reaction occurring at room temperature during the induction period predetermines, to a great extent, the reaction pathway followed during subsequent hydrothermal treatment. In the present work we first investigate the influence of the chemical composition on the formation of a homogeneous colloidal gel by exploring the corresponding ternary phase diagrams. We then discuss the temporal evolution of the linear viscoelastic properties i.e. the elastic storage modulus, G′(ω,t) and viscous loss modulus, G′′(ω,t) during gelation of the aluminosilicate species. This is followed by a detailed discussion of the linear viscoelastic spectrum obtained in mature gels and the effects of nonlinear oscillatory tests with increasing strain amplitude that eventually lead to the destruction of the studied gels. The results are compared with appropriate theoretical models from the literature,55 enabling us to connect the measured linear and nonlinear rheological properties to key structural parameters, such as the fractal dimension and the cluster size. We use the simple and compact fractional constitutive model to accurately capture the power-law viscoelastic behavior of these gels and also study the influence of the aluminum and sodium concentrations on the resulting mechanical response. Finally, by monitoring the volume occupied by the gel over time and analysing the composition of the solution that is exuded from it, we investigate the aging of the hydrogels at elevated temperatures (40 and 50 °C) over the period of a few weeks until the crystallisation of zeolites. The influence of the aluminum and sodium content on the structure of the final precipitated zeolites is analysed using structural characterization performed via X-ray diffraction (XRD).
2 Materials and methods
2.1 Chemical products
Commercial sodium silicate solution (Betol 39T, [Si] = 6.26 mol L−1; [Na] = 3.64 mol L−1) and sodium aluminate solution (Stabisil 19, [Al] = 5.89 mol L−1 [Na] = 9.44 mol L−1) were provided by Woellner GmbH (Germany). Sodium hydroxide pellets (99%) were provided by Alfa Aesar. Each chemical product was used as received without further purification. Water was used after deionization using a Milli-Q Water purification system and was collected with a resistivity of about 18.2 MΩ cm.2.2 Formulation of hydrogels
2.3 Rheological characterization
![[small gamma, Greek, dot above]](https://www.rsc.org/images/entities/i_char_e0a2.gif) = 200 s−1. After the addition of aluminate with a syringe, we stirred the mixture for another 30 seconds at the same shear rate (see Fig. S1 and S2 in the ESI,† for details of sequences and scheme). By adding hexadecane on top of the gelling solution and using a solvent trap we avoid drying of the samples. The experiments were primarily carried out at room temperature, except for a few tests that were performed over a range of temperatures to enable estimation of the thermal activation energy.
= 200 s−1. After the addition of aluminate with a syringe, we stirred the mixture for another 30 seconds at the same shear rate (see Fig. S1 and S2 in the ESI,† for details of sequences and scheme). By adding hexadecane on top of the gelling solution and using a solvent trap we avoid drying of the samples. The experiments were primarily carried out at room temperature, except for a few tests that were performed over a range of temperatures to enable estimation of the thermal activation energy.
After the pre-shear, we performed a time-sweep measurement in the linear regime and monitored the evolution of the storage (G′) and loss (G′′) moduli as a function of reaction time. This sequence was performed at fixed values of strain amplitude and frequency, γ0 = 1% and ω = 4π rad s−1, respectively. After observing the storage modulus approach a constant plateau value, we measured the linear dynamic response of the material using a frequency sweep test performed between 100 and 0.1 rad s−1 while maintaining a fixed strain amplitude of 1%. We then measured the nonlinear response of the material through a strain sweep at a fixed value of oscillation frequency ω = 1 rad s−1. This enabled us to estimate the critical strain that separates the linear and non-linear response of the material.
 | (1) |
 represents the Caputo fractional derivative of order α.16,60 This is a three parameter model, in which
  represents a quasi-property (with dimension of Pa sα). As discussed by Keshavarz et al.,16
 is a quasi-property that is very similar to the gel point strength that Winter and Chambon61 have introduced in their rheological study of the gel point. A detailed discussion in Keshavarz et al.16 shows that in the fractal network of an aging weak colloidal gel, such as aluminosilicate systems,
  captures the dissipation level of the network at small length-scales
  where a scale-free relaxation gives rise to a power-law viscoelastic behavior in the mechanical spectroscopy of these pasty materials. G0 is the elastic modulus of the gel and 0 < α ≤ 1 is a dimensionless power law exponent. In the limit of α → 1, this model reduces to the classical Maxwell model of linear viscoelasticity. Fourier transformation of eqn (1) yields the following expression for the complex viscoelastic modulus:
 | (2) |
 is a characteristic timescale for this model and G0 is the plateau value of the elastic modulus at high frequencies. The storage and loss modulus of the weak colloidal gel are computed from the real and imaginary parts of the complex modulus and given by
 | (3) |
 | (4) |
 while at high oscillation frequencies ω ≫ 1/τ, the elastic modulus approaches a plateau value of G′(ωτ ≫ 1) ∼ G0 and the loss modulus decays to zero in a power-law manner, G′′(ωτ ≫ 1) ∼ ω−α.
2.4 X-ray measurement techniques
 | (5) |
2.5 Scanning electron microscopy (SEM)
The observations were made on a Zeiss Supra 55 SEM at 15 keV, using backscattered electrons. EDS images and spectra were acquired using Esprit 1.9 software. The samples were metallized under vacuum with carbon, in order to avoid surface charging.2.6 Inductively coupled plasma-optical emission spectrometry (ICP-OES)
The silicon and aluminum concentrations were measured by ICP-OES, using a Thermo Scientific iCAP 6000 Series device. The samples were diluted in 3% HNO3 in order to reach an expected concentration around 10–15 mg L−1. The maximum concentration of total elements in a sample should be below 1 g L−1. External calibration with elemental standards of interest was performed from 0 to 20 mg L−1.3 Results and discussion
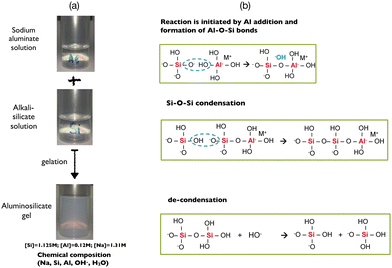
The formation of aluminosilicate species occurs instantaneously following addition of the sodium aluminate solution to the sodium silicate solution (see Fig. S1 and S2 in the ESI†). The aluminates formed in high alkaline media are in [Al(OH)4]− monomer form. On the other hand, the silicate species may have various degrees of connectivity according to the nature and the concentration of the alkali cation (Me = sodium or potassium…). Indeed, it is known that a decrease of the Si/Me molar ratio (by increasing the alkali content Me and keeping the concentration of Si constant) entails a depolymerization of the silicate oligomers.15,66–68 Recently, we have shown by molecular simulation and time-resolved X-ray scattering that the decondensation of silicate species is triggered by hydroxide ions that weaken and break the Si–O bonds, whereas silicate clusters are not impacted by water dilution, suggesting a protecting effect of the sodium cations with respect to the silicate chains.50 The decondensation scenario is described by the well known chemical equilibrium (6).69[![[triple bond, length as m-dash]](https://www.rsc.org/images/entities/char_e002.gif) Si−O−Si Si−O−Si![[triple bond, length as m-dash]](https://www.rsc.org/images/entities/char_e002.gif) ] + HO− ⇌ ≡ Si−O− + HO−Si ] + HO− ⇌ ≡ Si−O− + HO−Si![[triple bond, length as m-dash]](https://www.rsc.org/images/entities/char_e002.gif) | (6) |
[![[triple bond, length as m-dash]](https://www.rsc.org/images/entities/char_e002.gif) Si−OH] + [Al(OH)4]− → Si−OH] + [Al(OH)4]− → ![[triple bond, length as m-dash]](https://www.rsc.org/images/entities/char_e002.gif) [Si−O−Al(OH)3]− + H2O [Si−O−Al(OH)3]− + H2O | (7) |
Consequently, the reactivity, the homogeneity, the physico-chemical and the mechanical properties of the ensuring polymerized network depend not only on the overall chemical composition of the hydrogel but also on the way the gel is prepared as observed in Fig. 1. As previously mentioned, a gel is typically obtained after mixing alkali silicate and aluminate solutions in isovolumic proportion in order to avoid excessively high reactivity. The addition of sodium in the silicate or in the aluminate solution also has an impact on the kinetics of gelation of the hydrogel but not on the mechanical properties of the final gel (Fig. S3 in the ESI†). The presence of sodium hydroxide leads to decondensation of the silicate species, increasing their mobility and reactivity with respect to the aluminate. On the other hand, adding sodium hydroxide into the aluminate solution does not modify the speciation of aluminum and therefore the kinetics of gelation. The gel preparation protocol is thus crucial, because two concomitant but antagonist reactions take place when both solutions are mixed, i.e. the polymerization of aluminosilicate species and the breaking of silicate bonds, when an excess of alkali hydroxide (and particularly OH−) is present in the aluminate solution.16
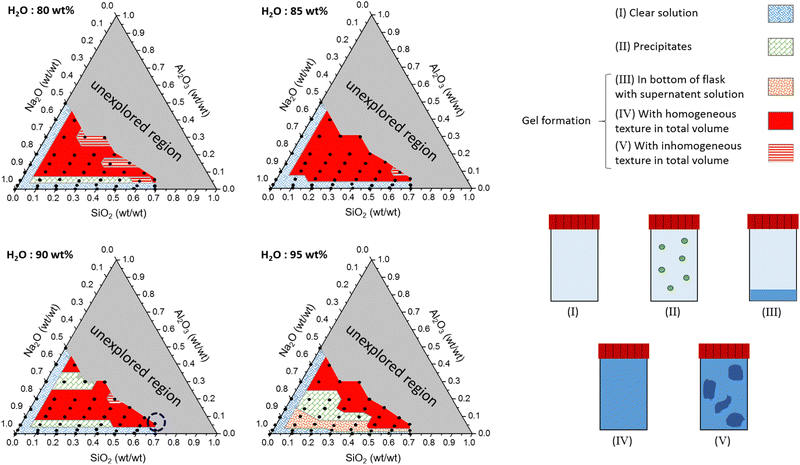
3.1 Ternary phase diagrams
Ternary phase diagrams for silicate/aluminate/sodium hydroxide mixtures were determined for various water contents in order to identify optimal chemical compositions that enable synthesis of a homogeneous hydrogel (Fig. 2). After stirring, the solutions were allowed to rest for about one hour and visually inspected. The various amounts of silicate, aluminate and sodium are expressed in weight fraction (wt/wt), fm, of SiO2, Al2O3 and Na2O (calculated from): (m(i)/(mtotal − m(H2O))) and water amount expressed in wt% (calculated from): (m(H2O) × 100/mtotal). The ternary phase diagrams shown in Fig. 2 with various delimiting zones were then obtained.• Zone (I): monophasic liquid. For 80, 85, 90 and 95 wt% water content, the mixtures remain monophasic and clear. This zone was observed at the lowest amount of aluminate (approx. fm(Al2O3) < 0.05 wt%) or silicates (approx. fm(SiO2) < 0.05 wt%) (blue hatched zone (I) in Fig. 2).
• Zone (II): precipitation of crystallized solid. A domain corresponding to the precipitation of white solid was observed (green square zone (II)). This was not observed for the composition containing 85 wt% water. Although silicate and aluminate are soluble in water, the solubility product of zeolites is very low. Šefčík et al. demonstrated the solubility product (Ksp) of zeolite-A was equal to 1.2 × 10⁻⁸ mol3 L−3 for sodium concentrations ranging from 1 to 4 mol L−1.70
• Zones (III), (IV) and (V): gel formation. In the case of the highest water content (95%), a few formulations allowed the formation of gel particles visible to the naked eye (orange hatched zone (III)). These gel particles settled down and formed a layer at the bottom of the container with a large excess of clear solution at the top. Because fm(Al2O3) was low (approx. 0.05 wt%) and the amount of water (95 wt%) was high, the amorphous particles could not percolate throughout the overall volume to produce a homogeneous hydrogel. For higher Al2O3 weight fractions, the turbidity of the mixture gradually increases until bulk percolation of the gel network (solid red zone (IV)). The gelation was progressive in time due to the reasonable reactivity rates in this range of composition. The time needed for total homogeneous gelation was measured to vary from a few minutes to a few hours according to the chemical formulation. However, in some cases, part of the gel was formed instantaneously and locally during addition of aluminate (red hatched zone (V)). The gelation of the remaining solution occurred a few minutes later when the aluminate monomers diffuse throughout the bulk to react with the silicate species. This two-stage gelation provides a very inhomogeneous gel and is mainly observed for the lowest water content (see Fig. S4 in the ESI†). On the other hand, increasing the water content reduces the reactivity between aluminate and silicate species entailing the vanishing of the zone (V) for H2O = 95 wt%. It is therefore evident that the concentrations of reactive species and the preparation method have an impact on the homogeneity of the entire gel. At the molecular scale, the reaction kinetics between aluminate and silicate are very fast, leading to high reactivity. Therefore, diluting the two solutions in water before mixing them is recommended to prevent excessive reactivity. On the other hand, it is important to mention that, for the chemical formulations studied in this work, the gel phases remain unchanged, and it is clearly the reaction kinetics that control the system.
The grey zone corresponds to unexplored regions of the formulation space. Because of the fixed initial sodium concentration in the commercial alkali silicate (Betol) and alkali aluminate (Stabisil) solutions, a large region of the ternary diagram at low fm(Na2O) could not be explored (grey zone). Carefully comparing the ternary diagrams highlights the observation that the more diluted the initial reactants are, the smaller the region of homogeneous gelation.
3.2 Influence of the chemical formulation on the gelation process
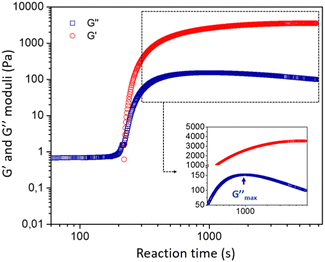
![[thin space (1/6-em)]](https://www.rsc.org/images/entities/char_2009.gif) δ = G′′/G′ > π/4. During the gelation process, both moduli slowly grow in time until the material passes through a crossover point where G′ = G′′, after which the viscoelastic moduli both increase rapidly with time. The measured storage modulus exhibits faster temporal growth compared to the loss modulus and the gel becomes increasingly solid-like. The rate of increase in the elastic modulus ultimately reduces as the reactive species are consumed and we observe an approach to an asymptotic plateau value. However, the loss modulus G′′(ω,t) passes through a local maximum, before slowly decreasing with time. This is characteristic of an aging soft glassy material.71 In the next section, we will discuss the influence of chemical formulation on the gelation time tgel that, for the sake of simplicity, we approximate here as the crossover point, i.e., G′(ω0, tgel) = G′′(ω0, tgel), where ω0 is the fixed oscillatory test frequency used for the time sweep. A more precise determination of the gelation time can be performed using time-resolved mechanical spectroscopy of the gel during the gelation process but, as shown by Keshavarz et al.,16 the crossover point is a good first-order approximation for the gelation time of alumino-silicate hydrogels. We have indicated the formulation we study in detail by the dotted blue circle on the ternary diagram with a water content equal to 90% (Fig. 2).
δ = G′′/G′ > π/4. During the gelation process, both moduli slowly grow in time until the material passes through a crossover point where G′ = G′′, after which the viscoelastic moduli both increase rapidly with time. The measured storage modulus exhibits faster temporal growth compared to the loss modulus and the gel becomes increasingly solid-like. The rate of increase in the elastic modulus ultimately reduces as the reactive species are consumed and we observe an approach to an asymptotic plateau value. However, the loss modulus G′′(ω,t) passes through a local maximum, before slowly decreasing with time. This is characteristic of an aging soft glassy material.71 In the next section, we will discuss the influence of chemical formulation on the gelation time tgel that, for the sake of simplicity, we approximate here as the crossover point, i.e., G′(ω0, tgel) = G′′(ω0, tgel), where ω0 is the fixed oscillatory test frequency used for the time sweep. A more precise determination of the gelation time can be performed using time-resolved mechanical spectroscopy of the gel during the gelation process but, as shown by Keshavarz et al.,16 the crossover point is a good first-order approximation for the gelation time of alumino-silicate hydrogels. We have indicated the formulation we study in detail by the dotted blue circle on the ternary diagram with a water content equal to 90% (Fig. 2).
 | ||
| Fig. 4 Gelation time tgelvs. concentration of (A) silicate, (B) aluminate and (C) sodium ions. Experimental data are represented by symbols. The model prediction, according to eqn (9) and data given in Table 1, are represented with dashed lines. | ||
The influence of aluminate was studied with [Na] fixed at 1.31 mol L−1 and two different concentrations of silicate: [Si] = 1.125 and 1.000 mol L−1 as shown by the red circle and blue triangle, respectively (Fig. 4B). For [Si] = 1.125 mol L−1, increasing the aluminate concentration from 8.5× 10⁻² to 2.12× 10⁻¹ mol L−1 reduces tgel from 617 to 108 s. Likewise, for [Si] = 1.000 mol L−1, sweeping the aluminate concentration results in a decrease of tgel from 402 to 70 s. Taken together, the results shown in Fig. 4A and B evidence that for a low Si/Al ratio, the gelation process is faster.
Fig. 4C shows that the gelation time decreases slightly when the sodium content is increased from 1.31 to 1.71 mol L−1, regardless of the Si/Al ratio. The maximum concentration of sodium is restricted because values higher than 1.7–1.8 mol L−1 produce an inhomogeneous gel.
In our previous work, we highlighted that the gelation mechanism is related to the number of initial building blocks formed as a result of the polycondensation reaction between aluminates and silicate species.16 The decrease of the Si/Al ratio – by increasing [Al] or decreasing [Si] – enables the formation of a higher number of initial building blocks in the reactive mixture. Increasing the volume fraction of building blocks leads to a decrease in the interparticle distance, favoring their interactions and consequently diminishing the gelation time and increasing the elastic modulus at the plateau (see Fig. S12 in the ESI†). On the other hand, increasing the sodium hydroxide concentration at a constant Si/Al ratio, increases the kinetic rate of gelation but the elasticity slightly decreases (see Fig. S12 in the ESI†). Those results are consistent with a decondensation process of the silicate oligomers by the hydroxide ions,50 which makes these species more mobile and reactive with respect to polycondensation with aluminates. Additional SAXS/WAXS analyses and molecular simulation were also performed. Comparing the hydrogel and silicate solution scattering patterns highlighted that the measured signal originated from the silicate oligomers in the initial solution,50 corresponding to the scattered signal of the homogeneous gel for q > 0.1 Å−1.72 These observations suggest that the stoichiometry of the gels is rapidly settled, with an excess of silicates suspended in the fluid phase.
| tgel = kθ,i × [i]αi | (8) |
 | (9) |
| k 298.15K | α Si | α Al | α Na |
|---|---|---|---|
| 9.0 | 3.1 | −1.7 | −1.6 |
Some experiments were also performed for a few chemical formulations at three different temperatures. Interestingly, increasing the temperature (over a range 15 ≤ θ ≤ 35°) only accelerates the kinetics of gelation without modifying the viscoelastic moduli at the end of the reaction (see Fig. S5-A, ESI†).
Variation of the gelation time tgel with temperature (see Fig. S5-B, ESI†) shows an Arrhenius relationship of the form: (10)
 | (10) |
The partial orders of the reaction listed in Table 1 will be discussed further below when we consider the aging process and the stoichiometry of the precipitated zeolite (Section 3.4.2.2).
3.3 Rheological behavior of the soft gel
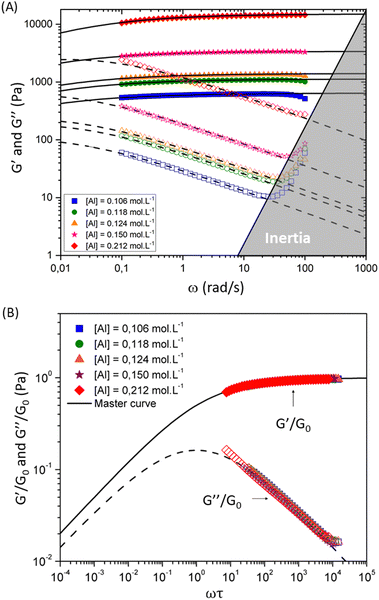 | ||
| Fig. 5 Viscoelastic moduli for hydrogel samples with varying [Al] concentrations and fixed concentration of [Si] = 1.125 mol L−1 and [Na] = 1.31 mol L−1. Filled and open symbols show the measured values of storage and loss moduli respectively. Solid and dashed lines show the fits of the FMG model (eqn (1) and (2)) for the storage and loss moduli respectively. The lower panel shows the dimensionless master curve for these samples. Dimensionless values of the reduced viscoelastic moduli G′/G0 and G′′/G0 respectively are plotted as a function of the reduced frequency ωτ. Solid and dashed lines show fits to the dimensionless form of the FMG model (eqn (1) and (2)). | ||
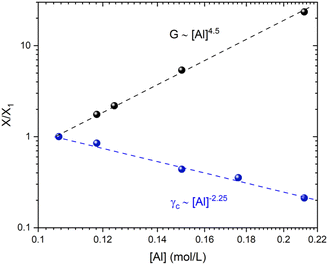
The horizontal axis corresponds to the re-scaled dimensionless frequency ωτ, where τ is the characteristic relaxation time of the gel. The vertical axis shows the viscoelastic moduli scaled by the stiffness of the elastic network G0. Finally, for this set of experimental data, the evolution of the three FMG parameters as a function of aluminum content are shown in Fig. S6 of the ESI.† The value of the power law exponent remains constant, indicating that the underlying percolation network, which is set at the gelation point, is geometrically self-similar between different chemical formulations in this set of samples. The two remaining fitting parameters  evolve in a power-law manner with the [Al] concentration, suggesting that in these geometrically self-similar networks the corresponding scales for energy storage and dissipation and the associated time and length scales all evolve with increases in the effective volume fraction of particles.55,56,73 The same behavior is observed for another two sets of experiments where the chemical formulations were changed. For a stoichiometrically unbalanced set (unbalanced means that before mixing of both solutions, the concentration of sodium is different in the silicate and aluminate solution. On the contrary for a stoichiometrically balanced set in which the silicate and aluminate solutions have the same concentration of sodium), the Al and Na content vary simultaneously, which consequently increases the value of the power law exponent α = 0.45. The other model parameters evolve in a similar manner with [Al] concentration but exhibit different scaling exponents that are discussed later and in the ESI† (see Fig. S7–S11).
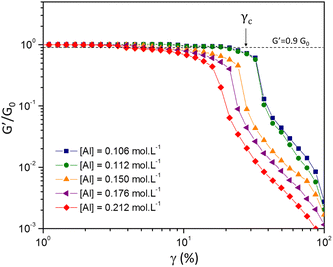
| G0 ∝ ϕμ | (11) |
| γc ∝ ϕ−ν | (12) |
Shih and coworkers55 assumed that the structure of the mature gel is composed of fractal clusters that aggregate together and form a space-spanning network. Their proposed model considers two distinct regimes: the strong link regime, where the interfloc stiffness is greater than the intrafloc one, and the opposite regime, which is accordingly named the weak link regime. In the case of the strong link regime, the model predicts that for a network in 3D space the power-law exponents μ and ν are connected to structural parameters df and x via the relationships:
 | (13) |
 | (14) |
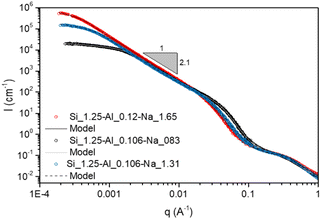 | ||
| Fig. 8 USAXS data for aluminosilicate gels. The scattering data for the stoichiometrically balanced and unbalanced gels are shown with red and blue symbols respectively. Solid and dashed lines show fits from the scattering model (given in [Keshavarz et al., Proc. Natl. Acad. Sci. U. S. A., 2021, 118 (15), e2022339118] and in the ESI†). The fitting parameters are given in Table S1 of the ESI.† | ||
3.4 Aging of the soft gel
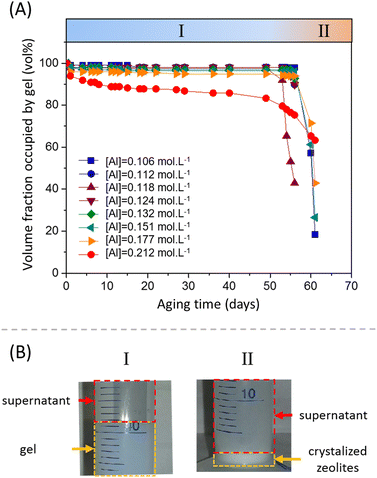
For various aluminum contents, the volume fraction occupied by the gel (in vol%) as a function of the aging time at 40 °C is plotted in Fig. 9A. For compositions ranging from [Al] = 0.106 to 0.177 mol L−1, the volume fraction of the gel slightly decreases during the first five days, until a stable local plateau value is reached. Then, the volume fraction remains constant for more than 50 days. The volume fraction of the gel at the plateau depends of the formulation and decreases with increasing aluminate content. At the highest concentration of [Al] = 0.212 mol L−1, no intermediate plateau was observed and the volume fraction of the gel slowly but continuously decreased during the aging process. However, varying the sodium content did not seem to have an influence on the volume fraction of the shrunken gel obtained (Fig. S13 of the ESI†). Regardless of the Na concentration, the shrunken gel occupied 97 vol% of the total volume.
The observation of a clear supernatant solution exuded from the gel is a typical sign of a syneretic phenomenon. As pointed out by Scherer,75 syneresis in inorganic gels is generally attributed to condensation reactions that cause a progressive contraction of the solid phase, squeezing the liquid phase out of the gel. However, the role of this phenomenon in the precipitation of zeolites has not been reported in the literature. Itani et al.31 discussed the important role of sodium hydroxide on the zeolite microstructure and on the precipitation rate but do not address the effect of syneresis. This is not entirely surprising, because zeolites are often synthesised from hydrogels in an autoclave, meaning that a lot of amorphous aluminosilicate species are present in the system and suspended in the liquid phase but without any mechanical strength, rendering visualization of the water flux difficult. The release of liquid by syneresis causes a gradual shrinkage and de-watering of the gel, which is consistent with the slow decrease of the viscous modulus G′′ observed in Fig. 3 for t > 1000 s.
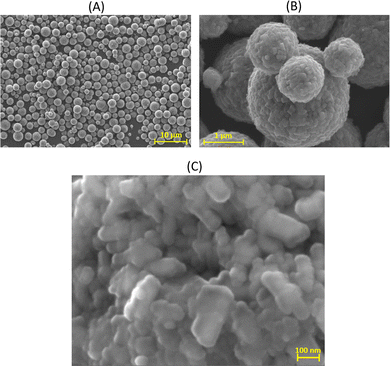
3.4.2.1 Morphology. At longer aging time (>50 days), a fast destructuration of the gel is observed (region II of Fig. 9A). The volume fraction occupied by the gel phase drops to values around 20–40% in 1 or 2 days, and the system becomes an inhomogeneous mixture composed of solid white precipitates and an amorphous gel. The nucleation and growth of zeolites starts and, at the end of the process, we observe a sediment layer of white particles at the bottom of the tube (see Fig. 9B.II). These particles were filtered, dried at 200 °C and characterized by HR-SEM, which showed that the zeolitic particles have a typical spherical shape, with a diameter of 1–2 μm (Fig. 10A). The zeolites are composed of aggregated nano-particles, with individual diameters around 100–200 nm (Fig. 10B and C). A similar microstructure was observed by Kumar et al.76 for SSZ-13 chabazite-type aluminosilicate zeolite. As these authors suggest, crystallization by particle attachment52 seems to be the dominant mechanism, leading to the formation of spheroidal, highly roughened crystals. The size of the nano-grains is consistent with the scattering data obtained on the amorphous gels (Fig. 8 and Table S3 of the ESI†), from which a radius of gyration around 150 nm was determined. As suggested in our previous paper,16 the space-filling structure formed right at the gel point of the amorphous gel is close to the structure of the solid particles and this is confirmed by the direct microscopic observation of the zeolites.
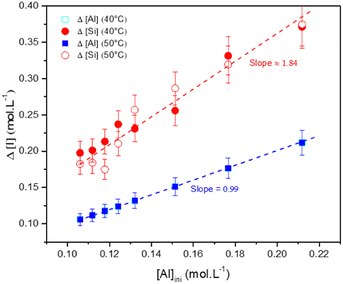
3.4.2.2 Zeolite characterization. The elemental composition of the particles (in terms of stoichiometry) was estimated by measuring the Si, Al and Na concentrations, before the gelation and after the destabilization of the gel, for the various formulations. The concentration differences Δ[Al], Δ[Si] and Δ[Na] were calculated from the initial concentrations [i]ini and the equilibrium concentrations [i]eq measured in the supernatant after denaturation of the gel (Δ[i] = [i]ini − [i]eq). These changes Δ[Al] and Δ[Si] are shown as a function of the aluminum concentration in Fig. 11. These differences correspond to the amounts of aluminum and silicon that react to form the precipitated material. The change in Δ[Na] is not shown because the data perfectly overlay with the Δ[Al] data. Regardless of the temperature of the aging experiments, the changes in Δ[Al] (and Δ[Na]) and Δ[Si] increase with increasing the initial concentration [Al]ini. The aging temperature has no significant influence on Δ[Al] (or Δ[Na]) and Δ[Si] evolutions. The slopes of these changes in ion concentrations Δ[Al] (or Δ[Na]) and Δ[Si] are shown on the plot and equal to 0.99 (or 0.99) and 1.84, respectively. Thus, the change in Δ[Al] appears to be equal to [Al]ini, meaning that the aluminates entirely react with silicates. The two-fold increase in the slope for Δ[Si] results suggest that two silicates react with one aluminate. The sodium follows the aluminum concentration, meaning that charge compensation takes place in the gel.
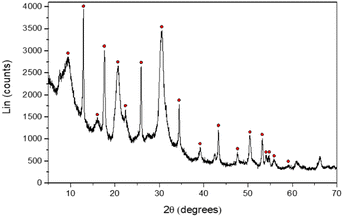
Furthermore, XRD patterns of the recovered powder highlighted primarily a chabazite-type structure, regardless of the concentration of aluminum or sodium, with the chemical formula: Na2Al2Si4O12·6H2O (Fig. 12 and Fig. S14 and S15 in the ESI†). For the aging experiments at 50 °C, a similar microstructure is observed but the composition is a mixture of chabazite, faujasite and gmelinite (Fig. S16 and S17 in the ESI†). These crystals correspond to other zeolites with different numbers of water hydration molecules in their crystalline structures (Na2Al2Si4O12·nH2O, see the ESI†). Nevertheless, the stoichiometry of the precipitated zeolite (two Si atoms for each Al atom) is very close to the ratio Δ[Si]/Δ[Al] of the remaining chemicals in the solution (∼1.84). Moreover, one should note that Δ[Si]/Δ[Al] ∼ 1.84 (Fig. 11), which is also consistent with the ratio of the chemical elements partial orders |αSi/αAl | ∼ 1.82 (Table 1) determined by means of eqn (9). Similarly, the |αNa/αAl| ratio is determined to be equal to 0.94, which is very similar to the ratio found in the supernatant (Δ[Na]/Δ[Al]) or in the zeolite, meaning that the cation compensates the negative charge of the aluminum in the amorphous or zeolite framework. This result, which needs further independent investigation, suggests that the zeolite stoichiometry is determined at the early stages of gelation (t ≪ tgel), i.e. the discrete aluminosilicate building blocks are initially formed to establish the native structure of the gel network. When combined with our earlier study of these systems,16 we now have a number of convergent observations pointing at the strong correlation between the morphology and the texture of the amorphous gel network that is initially established at short times (on the order of tgel) and of the precipitated crystals obtained on much longer time scales (dependent on the aging temperature).
4 Conclusions
Monolithic optically clear homogeneous aluminosilicate gels were investigated in alkali solutions and characterized from their early age to the final crystallisation of zeolites. We first identified the range of chemical compositions that allow generation of a homogeneous hydrogel, through the determination of ternary diagrams for four different levels of water contents (given by the ratio ). The importance of the gel preparation (the concentration of each constituent, the mixing temperature and even the balance of the concentrations in the two solutions before mixing) was determined in order to avoid production of inhomogeneous gels. After identification of the homogeneous zone in the ternary diagram, the influence of the molar concentration of each constituent (Al, Si and Na) was studied, through systematic variation of each component, from kinetic, rheological and structural points of view as well as through consideration of the syneretic aging process. The rate of gelation and the evolution on the viscoelastic properties over a range of temperatures were then investigated through a multiparametric study, allowing us to deconvolve the effect of each chemical element involved in the overall gelation reaction. We determined that the time to gelation is faster at high temperature and follows an Arrhenius law with an activation energy of Ea = 64 ± 10 kJ mol−1. The gelation time tgel, determined from the crossover between the elastic G′ and the viscous G′′ contributions to the complex modulus, could be modeled using an empirical rate law and the partial orders of the hydrogel reaction (αSi = 3.1, αAl = −1.7 and αNa = −1.6) were derived.
Measurement of the viscoelastic spectra of the mature gels reveals the influence of each chemical element, especially the aluminum and sodium cations, which play the role of bond-maker and bond-breaker respectively. The frequency dependency of the viscoelastic moduli are self-similar and have a number of common characteristics regardless of the chemical formulation. There is a clear plateau modulus at high frequencies in the elastic response and a power law decrease in the loss modulus. These frequency-dependent responses are also well described by the theoretical predictions of a very simple three parameter (α,  and G0) Fractional Maxwell Gel Model (FMG). The structural parameter of the model, α, characterizing the frequency dependence of the viscoelastic spectrum is very well correlated to the fractal dimension measured in these gels by USAXS as discussed elsewhere.16 Indeed, Muthukumar77 has suggested that the structural parameter df, namely the fractal dimension of the underlying network, can be connected to the relaxation exponent α in fractional models α = 3(5 − 2df)/2(5 − df). Using the values of the fitted model parameters, particularly the elastic modulus G0 and the relaxation time τ of the gel (calculated from the three model parameters via the relationship
  ), all the mechanical spectra can be scaled onto a master curve by using the elasticity and the relaxation time as vertical and horizontal shifting parameters respectively.
By studying the yielding of the gels at larger deformation amplitudes, the Shih et al.55 model could be applied to two distinct sets of chemical formulations. This model is ideally suited for describing our fractal colloidal gels that have aggregated according to a Reaction Limited Cluster Aggregation (RLCA) mechanism. By carefully observing the evolution of the gel elastic modulus and the critical strain for yielding the gels as a function of the aluminum content (keeping Si and Na constant), we obtain distinctive positive and negative power law scaling exponents respectively. These exponents are consistent with the strong-link regime described by Shih et al.55 and are consistent with the values of the fractal dimension of the clusters obtained at the mesoscale by USAXS. This strong-link behavior indicates that the interfloc stiffness is stronger than the intrafloc connections. By modifying the chemical formulation, especially the sodium content, we are able to decrease the two power-law exponents and tune the mechanical properties until the stiffness of the connections between the flocs and within each individual flocs starts to become comparable.
Our study of the characteristics of these gels aging showed that at early times the gelled structures exhibit shrinkage concomitant with the release of liquid at the surface due to syneresis. At longer times a destabilization of the hydrogel occurs between 20 days and several months, depending on the temperature storage. This destabilization is due to the in situ crystallization of zeolites as chabazite or other zeolitic structural forms, depending on the aging temperature. Electron microscopy shows the precipitated zeolitic particles are composed of aggregated nano-particles, suggesting a mechanism of precipitation by crystallized particle attachment.
Finally, we note that the stoichiometry of the precipitated zeolites is not only consistent with the residual concentration of the supernatant but surprisingly, it is also very close to the partial order of reaction of the chemical elements determined by rheological measurements in the neighborhood of the critical gel point. This suggests a strong correlation between (i) the rheomechanical properties and fractal structural characteristics of the initial amorphous gel network established at the instant of gelation, and (ii) the final precipitated crystals.
Data availability
Please note that the data supporting this article have been included as part of the ESI.†Conflicts of interest
There are no conflicts to declare.Acknowledgements
The authors acknowledge The French National Research Agency (ANR) for financial support of the DYNAMISTE project (ANR-15-CE07-0013). The authors want to thank Olivier Grauby from Cinam Marseille and Pascal Antonucci from the CEA, DES, ISEC, DPME for their assistance for HRSEM and XRD, respectively. The authors also wish to acknowledge the MISTI-France program for promoting collaborative research and exchange.Notes and references
- M. E. Davis, Nature, 2002, 417, 813–821 CrossRef CAS PubMed
.
- Y. Li and J. Yu, Nat. Rev. Mater., 2021, 6, 1156–1174 CrossRef CAS
.
- P. Duxson, A. Fernández-Jiménez, J. L. Provis, G. C. Lukey, A. Palomo and J. S. J. van Deventer, J. Mater. Sci., 2007, 42, 2917–2933 CrossRef CAS
.
- Z. Zhang, J. L. Provis, A. Reid and H. Wang, Constr. Build. Mater., 2014, 56, 113–127 CrossRef
.
- S. Wang and Y. Peng, Chem. Eng. J., 2010, 156, 11–24 CrossRef CAS
.
-
R. P. Townsend and E. N. Coker, Studies in Surface Science and Catalysis, Elsevier, 2001, vol. 137, pp. 467–524 Search PubMed
.
- W. Zhang, S. Li, J. Wei, Q. Zhang, R. Liu, X. Zhang and H. Yin, Carbonates Evaporites, 2018, 33, 211–222 CrossRef CAS
.
-
S. Kazemian and A. Prasad, Grouting and Deep Mixing 2012, New Orleans, Louisiana, United States, 2012, pp. 1701–1710 Search PubMed
.
- V. Cantarel, F. Nouaille, A. Rooses, D. Lambertin, A. Poulesquen and F. Frizon, J. Nucl. Mater., 2015, 464, 16–19 CrossRef CAS
.
- S. Petlitckaia, Y. Barré, T. Piallat, O. Grauby, D. Ferry and A. Poulesquen, J. Cleaner Prod., 2020, 269, 122400 CrossRef CAS
.
- A. Rooses, P. Steins, A. Dannoux-Papin, D. Lambertin, A. Poulesquen and F. Frizon, Appl. Clay Sci., 2013, 73, 86–92 CrossRef CAS
.
- L. Frances, M. Douilly, M. Grivet, D. Ducret and M. Théobald, J. Phys. Chem. C, 2015, 119, 28462–28469 CrossRef CAS
.
- T. Hijikata, T. Koyama, Y. Aikyo, S. Shimura and M. Kawanishi, J. Nuclear Sci. Technol., 2021, 58, 1079–1098 CrossRef CAS
.
- J. Davidovits, J. Therm. Anal. Calorim., 1991, 37, 1633–1656 CrossRef CAS
.
- J. Aupoil, J.-B. Champenois, J.-B. d'Espinose de Lacaillerie and A. Poulesquen, Cem. Concr. Res., 2019, 115, 426–432 CrossRef CAS
.
- B. Keshavarz, D. G. Rodrigues, J.-B. Champenois, M. G. Frith, J. Ilavsky, M. Geri, T. Divoux, G. H. McKinley and A. Poulesquen, Proc. Natl. Acad. Sci. U. S. A., 2021, 118, e2022339118 CrossRef CAS PubMed
.
- P. Steins, A. Poulesquen, O. Diat and F. Frizon, Langmuir, 2012, 28, 8502–8510 CrossRef CAS PubMed
.
- M. F. Alnahhal, T. Kim and A. Hajimohammadi, Cem. Concr. Res., 2021, 144, 106441 CrossRef CAS
.
- X. Dai, S. Aydn, M. Y. Yardmc, K. Lesage and G. De Schutter, Cem. Concr. Res., 2020, 138, 106253 CrossRef CAS
.
- I. Krznarić, T. Antonić and B. Subotić, Zeolites, 1997, 19, 29–40 CrossRef
.
- V. Valtchev and L. Tosheva, Chem. Rev., 2013, 113, 6734–6760 CrossRef CAS PubMed
.
- P. Rożek, M. Król and W. Mozgawa, J. Cleaner Prod., 2019, 230, 557–579 CrossRef
.
- P. Steins, A. Poulesquen, O. Diat and F. Frizon, Langmuir, 2012, 28, 8502–8510 CrossRef CAS PubMed
.
- J. L. Bell, P. Sarin, J. L. Provis, R. P. Haggerty, P. E. Driemeyer, P. J. Chupas, J. S. J. van Deventer and W. M. Kriven, Chem. Mater., 2008, 20, 4768–4776 CrossRef CAS
.
- A. Poulesquen, F. Frizon and D. Lambertin, J. Non-Cryst. Solids, 2011, 357, 3565–3571 CrossRef CAS
.
- J. Rouyer and A. Poulesquen, J. Am. Ceram. Soc., 2015, 98, 1580–1587 CrossRef CAS
.
- J. W. Phair, J. C. Schulz, L. P. Aldridge and J. D. Smith, J. Am. Ceram. Soc., 2004, 87, 129–137 CrossRef CAS
.
- J. Mills, P. Mondal and N. J. Wagner, Cem. Concr. Res., 2022, 151, 106618 CrossRef CAS
.
- S. Yu, S. Kwon and K. Na, J. Sol-Gel Sci. Technol., 2021, 98, 411–421 CrossRef
.
- H. Shen, H. Maekawa, J. Kawamura, Y. Matsumoto, T. Yamamura, Y. Kawakita, K. Shibata and M. Kawai, Solid State Ionics 16: Proceedings of the 16th International Conference on Solid State Ionics (SSI-16), Part I, 2008, vol. 179, pp. 1133–1137 Search PubMed.
- L. Itani, Y. Liu, W. Zhang, K. N. Bozhilov, L. Delmotte and V. Valtchev, J. Am. Chem. Soc., 2009, 131, 10127–10139 CrossRef CAS PubMed
.
- S. Mintova, N. H. Olson, V. Valtchev and T. Bein, Science, 1999, 283, 958–960 CrossRef CAS PubMed
.
- V. P. Valtchev and K. N. Bozhilov, J. Am. Chem. Soc., 2005, 127, 16171–16177 CrossRef CAS PubMed
.
- C. Kosanović, S. Bosnar, B. Subotić, V. Svetličić, T. Mišić, G. Dražić and K. Havancsák, Microporous Mesoporous Mater., 2008, 110, 177–185 CrossRef
.
- C. Kosanović, S. Bosnar, B. Subotić, V. Svetličić, T. Mišić, G. Dražić and K. Havancsák, Microporous Mesoporous Mater., 2008, 110, 177–185 CrossRef
.
- A. I. Lupulescu and J. D. Rimer, Science, 2014, 344, 729–732 CrossRef CAS PubMed
.
- P.-P. E. A. de Moor, T. P. M. Beelen, R. A. van Santen, K. Tsuji and M. E. Davis, Chem. Mater., 1999, 11, 36–43 CrossRef CAS
.
- M. Ogura, Y. Kawazu, H. Takahashi and T. Okubo, Chem. Mater., 2003, 15, 2661–2667 CrossRef CAS
.
- M. Smaihi, O. Barida and V. Valtchev, Eur. J. Inorg. Chem., 2003, 4370–4377 CrossRef CAS
.
- A. Aerts, L. R. A. Follens, E. Biermans, S. Bals, G. Van Tendeloo, B. Loppinet, C. E. A. Kirschhock and J. A. Martens, Phys. Chem. Chem. Phys., 2011, 13, 4318 RSC
.
- X. Zhao, R. Liu, H. Zhang, Y. Shang, Y. Song, C. Liu, T. Wang, Y. Gong and Z. Li, J. Appl. Crystallogr., 2017, 50, 231–239 CrossRef CAS
.
- T. M. Davis, T. O. Drews, H. Ramanan, C. He, J. Dong, H. Schnablegger, M. A. Katsoulakis, E. Kokkoli, A. V. McCormick, R. L. Penn and M. Tsapatsis, Nat. Mater., 2006, 5, 400–408 CrossRef CAS PubMed
.
- W. Fan, M. Ogura, G. Sankar and T. Okubo, Chem. Mater., 2007, 19, 1906–1917 CrossRef CAS
.
- W. H. Dokter, H. F. van Garderen, T. P. M. Beelen, R. A. van Santen and W. Bras, Angew. Chem., Int. Ed. Engl., 1995, 34, 73–75 CrossRef CAS
.
- M. D. Oleksiak and J. D. Rimer, Rev. Chem. Eng., 2014, 30, 1–49 CAS
.
- N. Ren, B. Subotić, J. Bronić, Y. Tang, M. Dutour Sikirić, T. Mišić, V. Svetličić, S. Bosnar and T. Antonić Jelić, Chem. Mater., 2012, 24, 1726–1737 CrossRef CAS
.
- M. Kumar, R. Li and J. D. Rimer, Chem. Mater., 2016, 28, 1714–1727 CrossRef CAS
.
- R. Li, A. Chawla, N. Linares, J. G. Sutjianto, K. W. Chapman, J. G. Martínez and J. D. Rimer, Ind. Eng. Chem. Res., 2018, 57, 8460–8471 CrossRef CAS
.
- J. Aupoil, J.-B. Champenois, J.-B. d'Espinose de Lacaillerie and A. Poulesquen, Cem. Concr. Res., 2019, 115, 426–432 CrossRef CAS
.
- R. Dupuis, D. Gomes Rodrigues, J.-B. Champenois, R. J.-M. Pellenq and A. Poulesquen, J. Phys.: Mater., 2020, 3, 014012 CAS
.
- R. Jain, A. J. Mallette and J. D. Rimer, J. Am. Chem. Soc., 2021, 143, 21446–21460 CrossRef CAS PubMed
.
- J. J. De Yoreo, P. U. P. A. Gilbert, N. A. J. M. Sommerdijk, R. L. Penn, S. Whitelam, D. Joester, H. Zhang, J. D. Rimer, A. Navrotsky, J. F. Banfield, A. F. Wallace, F. M. Michel, F. C. Meldrum, H. Colfen and P. M. Dove, Science, 2015, 349, aaa6760 CrossRef PubMed
.
- E. Zaccarelli, J. Phys.: Condens. Matter, 2007, 19, 323101 CrossRef
.
- M. Y. Lin, H. M. Lindsay, D. A. Weitz, R. C. Ball, R. Klein and P. Meakin, Phys. Rev. A: At., Mol., Opt. Phys., 1990, 41, 2005–2020 CrossRef CAS PubMed
.
- W.-H. Shih, W. Y. Shih, S.-I. Kim, J. Liu and I. A. Aksay, Phys. Rev. A: At., Mol., Opt. Phys., 1990, 42, 4772–4779 CrossRef CAS PubMed
.
- H. Wu and M. Morbidelli, Langmuir, 2001, 17, 1030–1036 CrossRef CAS
.
- M. Geri, B. Keshavarz, T. Divoux, C. Clasen, D. J. Curtis and G. H. McKinley, Phys. Rev. X, 2018, 8, 041042 CAS
.
- J. D. J. Rathinaraj, G. H. McKinley and B. Keshavarz, Fractal Fractional, 2021, 5, 174 CrossRef
.
- J. E. Martin and D. Adolf, Annu. Rev. Phys. Chem., 1991, 42, 311–339 CrossRef CAS
.
- A. Jaishankar and G. H. McKinley, Proc. R. Soc. London, Ser. A, 2013, 469, 20120284 Search PubMed
.
- H. H. Winter and F. Chambon, J. Rheology, 1986, 30, 367–382 CrossRef CAS
.
- J. Ilavsky, F. Zhang, A. J. Allen, L. E. Levine, P. R. Jemian and G. G. Long, Metall. Mater. Trans. A, 2013, 44, 68–76 CrossRef CAS
.
- J. Ilavsky, F. Zhang, R. N. Andrews, I. Kuzmenko, P. R. Jemian, L. E. Levine and A. J. Allen, J. Appl. Crystallogr., 2018, 51, 867–882 CrossRef CAS PubMed
.
- J. Ilavsky, J. Appl. Crystallogr., 2012, 45, 324–328 CrossRef CAS
.
- J. Ilavsky and P. R. Jemian, J. Appl. Crystallogr., 2009, 42, 347–353 CrossRef CAS
.
- A. Palčić, B. Subotić, V. Valtchev and J. Bronić, CrystEngComm, 2013, 15, 5784 RSC
.
- S. D. Kinrade and T. W. Swaddle, Inorg. Chem., 1988, 27, 4253–4259 CrossRef CAS
.
- I. L. Svensson, S. Sjöberg and L.-O. Öhman, J. Chem. Soc., Faraday Trans. 1, 1986, 82, 3635 RSC
.
-
C. J. Brinker and G. W. Scherer, Sol-Gel Science: The Physics and Chemistry of Sol-Gel Processing, Elsevier, 1990 Search PubMed
.
- J. Šefcík and A. McCormick, Microporous Mater., 1997, 10, 173–179 CrossRef
.
- S. M. Fielding, P. Sollich and M. E. Cates, J. Rheology, 2000, 44, 323–369 CrossRef CAS
.
- R. Dupuis, S. H. Hahn, A. C. T. van Duin, R. J.-M. Pellenq and A. Poulesquen, Phys. Chem. Chem. Phys., 2022, 24, 9229–9235 RSC
.
- R. Buscall, P. D. A. Mills, J. W. Goodwin and D. W. Lawson, J. Chem. Soc., Faraday Trans. 1, 1988, 84, 4249 RSC
.
- V. P. Valtchev, L. Tosheva and K. N. Bozhilov, Langmuir, 2005, 21, 10724–10729 CrossRef CAS PubMed
.
- G. W. Scherer, J. Non-Cryst. Solids, 1989, 108, 18–27 CrossRef CAS
.
- M. Kumar, H. Luo, Y. Román-Leshkov and J. D. Rimer, J. Am. Chem. Soc., 2015, 137, 13007–13017 CrossRef CAS PubMed
.
- M. Muthukumar, Macromolecules, 1989, 22, 4656–4658 CrossRef CAS
.
Footnote |
| † Electronic supplementary information (ESI) available. See DOI: https://doi.org/10.1039/d4sm00181h |
| This journal is © The Royal Society of Chemistry 2024 |

