 Open Access Article
Creative Commons Attribution 3.0 Unported Licence
Impact of coating particles on liquid marble lifetime: reactor engineering approach to evaporation†
Joshua
Saczek
a,
Koren
Murphy
a,
Vladimir
Zivkovic
a,
Aditya
Putranto
b and
Stevin S.
Pramana
 *a
*a
aSchool of Engineering, Newcastle University, Newcastle upon Tyne, NE1 7RU, UK. E-mail: stevin.pramana@newcastle.ac.uk
bSchool of Chemistry and Chemical Engineering, University of Surrey, Guildford GU2 7XH, UK
First published on 8th July 2024
Abstract
Liquid marbles are soft matter objects characterised by a liquid droplet enclosed within a hydrophobic particle coating, preventing wetting. This distinctive structure serves as active sites for solid–liquid–gas reactions. However, the impact the chosen coating material has on liquid marble stability, particularly regarding the number of coating layers and material wetting, remains uncertain. There is a need for a modelling approach to predict the overall lifetime considering these coating characteristics. This study reveals that for PTFE liquid marbles evaporating at ambient temperature, smaller coating particles (250 nm) extend their lifetime by forming a multilayered coating. Conversely, using larger particle sizes (200 μm) results in the formation of monolayer liquid marbles with shorter lifetimes than their equivalent naked droplets. Additionally, a higher number of particle layers and a larger contact angle generally enhance the liquid marble's lifetime. For multilayered liquid marbles comprised of smaller particles (250 nm), the particle contact angle is found to have a more significant impact than the number of layers on lifetime extension, whereas the opposite holds true for larger particle sizes (20 μm). A modelling approach using the reactor engineering method for liquid marble evaporation demonstrates excellent agreement with experimental results, yielding an R2 of 0.996. The implementation of this specific model, capable of assessing lifetime across various physical modifications, will enhance our understanding of liquid marble properties before their application in biomedical, microreactor, and green technologies.
1. Introduction
The liquid marble (LM) phenomenon, initially reported in 2001 by Aussillous and Quéré,1 describes a water droplet coated with hydrophobic powders. This encapsulated droplet behaves as a non-wetting soft solid, reducing adhesion to solid surfaces. The versatile behaviours exhibited by LMs have facilitated their integration into commonplace applications like microreactors, bioreactors, and bioassays, as well as innovative technologies such as water remediation, cell mimicry, and unconventional computing.2–10 Understanding the physical barriers separating the internal liquid droplet from the external environment enables the customisation of LM properties for specific scenarios, delivering targeted functionalities. LM lifetime is significantly influenced by the coating material; thus, it is critical for this parameter to be understood and managed accordingly as it directly impacts LM stability. The naturally porous LM shell allows gas exchange, whilst beneficial for liquid–gas phase reactions, precise control of water vapor loss through evaporation from the liquid droplet requires careful engineering.11–17 Insights from this work could then be applied to “dry water”, a similar phenomenon to LMs but a magnitude smaller in size, commonly used in firefighting and the transportation and storage of hazardous materials.18,19 In this paper LM lifetime refers to complete evaporation; it is pivotal that constant terminology is used as literature frequently describes it in various contexts, often at early stages as buckling or collapse.7,12,13,20–23 Since buckling can occur early in drying, considering this as the endpoints may not capture the full evaporation profile. Total evaporation allows comparison with the reactor engineering approach (REA) to drying. Key coating characteristics, including particle size, wetting angle, fluorine content, and the number of layers are discussed.Experimental results are directly compared to evaporative modelling via the REA for drying, assessing the applicability of this approach. While LM evaporation has been predominantly explored experimentally, any computational approaches have often relied on diffusion-based modelling.11,24 The REA is commonly employed to model the drying process of various substances, from liquid droplets like milk to solids, where evaporation is considered as an “activation” process where an energy barrier must be overcome.25–29 Utilising this semi-empirical drying model enables the prediction of the evaporation profile and overall lifetime of sessile drop LMs coated in various powders with diverse properties, including particle material, size, and wetting characteristics.
2. Materials and methods
Polytetrafluoroethylene (PTFE) powders (200 μm, 1 μm), iron(III) oxide (Fe2O3), methanol and hexadecyltrimethoxysilane (HDTMS) were purchased from Sigma Aldrich. PTFE 20 μm, PTFE 0.25 μm, perfluorodecyltrimethyoxysilane (PFDTMS) and silanamine (fumed SiO2; 1,1,1-trimethyl-N-(trimethylsilyl)) were purchased from Alfa Aesar, Polysciences, Manchester Organics and Cabot, respectively. The coating powders were used as received and without any further chemical treatment. Deionised water (DI) was produced at Newcastle University with a resistivity of 18.2 MΩ cm.2.1. Particle size distribution
Depending on the size of the particles present, either a light (VHX-970F Keyence Digital Microscope for observing particles in micron scale or greater) or a scanning electron microscope (SEM, JSM-IT510 for particles in nanometre scale) was used to assess particle size distribution and aspect ratio. An image processing software, ImageJ, utilising the particle counter function was used to analyse the obtained images.292.2. Particle contact angle
The apparent contact angles were measured using a sessile drop method (Fig. S1, ESI†).2,30–32 Pellets of each particle type were formed using uniaxial compression via a hydraulic hand press (SPX Power Team SPM256C) at 2500 psi for 10 min. Next, a 10 μL sessile drop of the liquid to be examined was placed on the surface of the pellet. An image of the side profile of the droplet on the pellet was taken (RS Pro Polarized USB Microscope with 200× magnification). The contact angles were found using a DropSnake plugin in ImageJ.33 The observation was repeated 5 times for each particle type.2.3. (Super)Hydrophobic particle formation
To investigate highly hydrophobic particles, we adhered to the protocol outlined by Grbic et al.34 for the synthesis of hydrophobised iron nanoparticles. Hydrophobic coatings of two varying degrees were achieved using HDTMS (technical grade ≥85%) and PFDTMS (97%). 400 mg of Fe2O3 nanoparticles (>50 nm) were introduced into a solution comprising 200 mL of methanol (Fischer analytical grade, ≥99.9%) along with 2 mL of either HDTMS or PFDTMS. This mixture underwent stirring in a round-bottom flask, employing a magnetic stirrer set at 200 rpm (Stuart US152 Hot Stirrer) for 24 hours. Following the stirring process, the resultant mixture was transferred into five 50 mL scintillation vials. To retain the now coated magnetic Fe2O3 particles, a magnet was positioned at the vial's base, facilitating the rinsing of the solution with DI. This rinsing procedure was repeated three times to ensure thorough washing of the particles, which were subsequently stored in DI.2.4. Liquid marble formation
LMs were synthesised following established procedures as detailed in prior publications.8,12,35–40 A soda watch glass was coated with particle powders, subsequently, a 10 μL droplet of DI water was dispensed onto the powder-coated surface using a mechanical pipette. The droplet volume was subject to variation, with a maximum volume of 100 μL explored in this study. Achieving complete encapsulation of the droplet involved manual agitation of the watch glass for 60 seconds, ensuring a uniform powder coating (Fig. S2, observed under a light microscope, ESI†). In standard experiments the powder bed remained uncompressed, and the agitation duration was set at 60 seconds. However, for investigations into coating thickness, compressed powder beds were utilised, accompanied by a reduced agitation time of 10 seconds.2.5. Coating mass and number of layers
To ascertain whether enhancements in lifetime for multilayer LMs are contingent upon the number of layers, a comparison was conducted involving LMs composed of the same powder but different thicknesses. To manipulate the thickness of the coating, a water droplet underwent rolling on either compressed or non-compressed powder beds for durations of either 10 or 60 seconds, resulting in various thicknesses. The compressed powder beds were created through uniaxial compression, accomplished using a hydraulic hand press (SPX Power Team SPM256C) at 2500 psi for 10 minutes, ultimately forming a pellet. The determination of layer thickness and subsequent calculation of the number of layers were executed employing methodologies established by McEleney et al.40 and Chandan et al.41 These methods involved utilising the observed droplet diameter and density to calculate the unknown coating properties.2.6. Evaporation rate and lifetime
A LM was transferred onto a weighing boat and subsequently placed on an analytical balance (A&D HR-250AZ). Weight measurements were systematically recorded at 10-minute intervals until complete evaporation was observed, with the final time documented. Concurrently, during the evaporation experiments, the buckling times of the LM were noted. Buckling is defined as the moment when the upper surface of the LM is no longer convex. This is determined when the upper curvature is lost, and the smoothed surface becomes either flat or exhibits an internal angle greater than 180 degrees (Fig. S3, ESI†).42,43 To complement these measurements, images of the LM profile were captured at the same time intervals. This enables the documentation of changes in surface area and volume over the course of the evaporation process at ambient conditions (T = 18.5 ± 0.4 °C, relative humidity = 18.8 ± 2.3%).3. Results and discussion
3.1. Impact of coating
The selection of the appropriate coating particle is critical in ensuring a LM will form and remain stable for a useable amount of time with controlled wetting properties.1 Therefore, it is imperative to use oleophobic particles for an internal oil droplet and hydrophobic particles for an internal water droplet. For the case of water droplets, the addition of the hydrophobic particles to the droplet causes the particles to coat its exterior, preventing the internal liquid from contacting the external surface/environment. This behaviour is reminiscent of aphids in nature; these insects coat excreted honeydew with a powdery hydrophobic wax, creating a LM and thereby avoiding infection or drowning.44 The impact of particle size and hydrophobicity on LM lifetime was investigated using PTFE particles of four different sizes and eight particles with varying hydrophobicity, respectively (Table 1 and Table S1 also provides information on buckling times, ESI†). Hydrophobicity levels are described in terms of contact angle (θc) and categorised into three broad groups: hydrophilic (θc < 90°), hydrophobic (θc > 90°), and superhydrophobic (θc > 145–150°).45,46 As illustrated in Table 1, each contact angle obtained from the powder bed experiments surpasses those associated with equivalent solid surfaces. This phenomenon is attributed to the observed wetting occurring in the Cassie–Baxter regime rather than the Wenzel regime, owing to the presence of air pockets between the phobic particles.47,48| MP | Water contact angle literature/°![[thin space (1/6-em)]](https://www.rsc.org/images/entities/char_2009.gif) 49,50 49,50 |
Water contact angle powder (this study)/° | Experimentally determined particle diameter/μm | Particle diameter (for reference in text)/μm |
|---|---|---|---|---|
| PP | 101.1 | 111.2 ± 2.8 | 49.0 ± 3.6 | 50 |
| LDPE | 98.1 | 115.7 ± 3.2 | 55.1 ± 2.9 | 50 |
| PS | 86.9 | 93.1 ± 4.0 | 51.3 ± 2.5 | 50 |
| PVC | 87.6 | 88.1 ± 1.7 | 52.3 ± 4.5 | 50 |
| PTFE | 114.5 | 130.2 ± 3.1 | 0.27 ± 0.08 | 0.25 |
| 128.4 ± 1.8 | 1.2 ± 0.4 | 1 | ||
| 127.1 ± 3.3 | 19.7 ± 1.1 | 20 | ||
| 126.9 ± 4.0 | 195.1 ± 2.5 | 200 | ||
| Fe/HDTMS | — | 141.4 ± 3.0 | 0.25 ± 0.10 | 0.25 |
| Fe/PFDTMS | — | 156.6 ± 2.1 | 0.27 ± 0.09 | 0.25 |
| Untreated Fe2O3 | 29.0–74.0 | 68.8 ± 4.4 | 0.059 ± 0.010 | 0.05 |
| Fumed SiO2 | — | 160.8 ± 1.6 | 0.23 ± 0.059 | 0.25 |
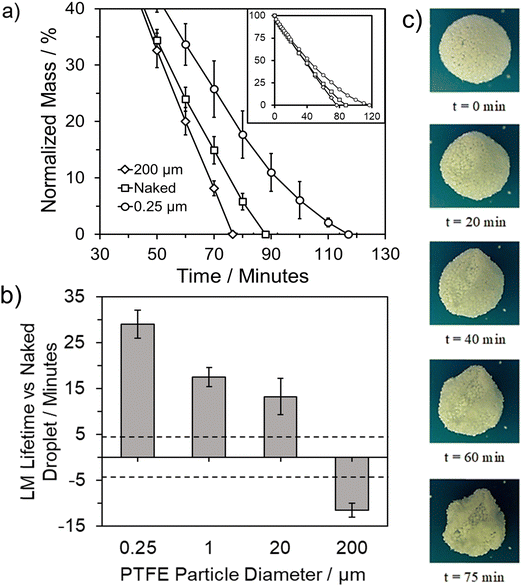
This is particularly noticeable with nanoparticle PTFE, extending the lifetime by approximately 30 minutes compared to the two microparticle PTFEs achieving a ∼15 minute extension. This phenomenon is attributed to the degree of particle coating coverage on the liquid droplet surface, with smaller coating particles providing a higher degree of surface coverage.40,54,55 Smaller particles also enable tighter packing and a greater number of particle layers.11,56–58 Additionally, unlike fine particles, larger particles tend to protrude more into the air phase rather than the liquid phase, resulting in lower surface coverage.39 In general, the overall reduction in evaporation depends on the volume of the droplet, packing density, and the number of layers present. However, when the same coating material is utilised, it underscores the significance of coating particle size in determining LM lifetime (Fig. 1c).11,51
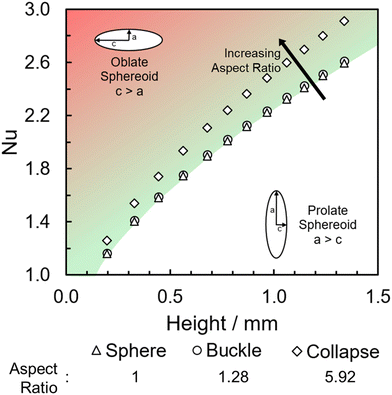
LMs in this work were only analysed if they formed stable structures, ensuring collapse shortly after formation was avoided. When collapse, the complete loss of a uniform spherical structure, occurred it was for a relatively short period of time at the end of a stable LMs lifetime (Fig. S3, ESI†). Change in shape of the LM over time will impact the surface area to volume ratio and in turn the area of the internal droplet available to evaporation. In these instances, the earlier buckling occurs the shorter the LMs overall lifetime, indicating that regardless of the presence of the concaved surface the evaporative resistance still remains dependent on the properties of the particle layer (Table S1 and Fig. S4, ESI†). In general, the change in shape when buckling occurs only slightly impacts the surface area to volume ratio, with an increase of just 3% from 2.24 (sphere) to 2.30 (buckle). This suggests that while the shape change does affect the evaporation rate, the impact can be considered minimal when compared to coating composition (Fig. S5, ESI†). Upon consideration as to how the Nusselt number, the balance between conductive and convective heat transfer, changes with LM shape we can see that when buckling occurs these forces remain unchanged when compared to a spherical LM (Fig. 2). When compared to total collapse and the formation of a “puddle” the Nusselt number is noticeably larger, suggesting a greater impact from convective heat transfer. As previously mentioned, collapse occurs towards the end of LM lifetime, at these smaller LM sizes the impact the different shapes have upon the Nusselt number is much less pronounced – almost negligible (Fig. 2). From this, Nu also becomes close to 1 suggesting that the heat transfer occurring is largely due to conduction, as supported by an initial and final Biot number of 1.34 and 1.06, respectively.
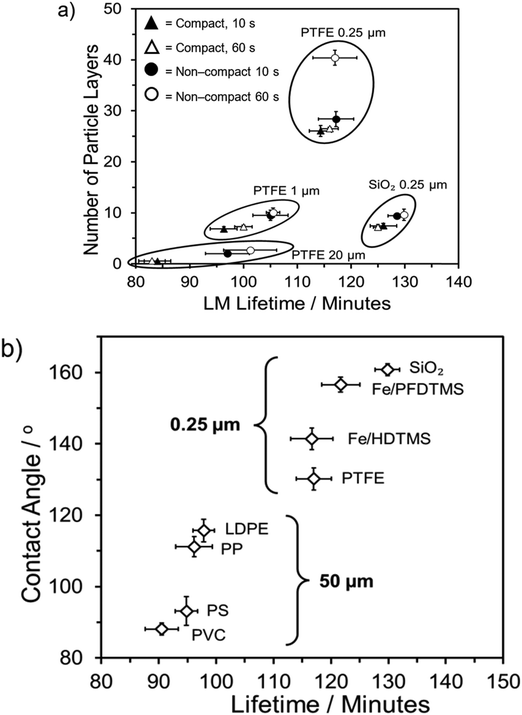
Analysis of Fig. 3a indicates that LMs formed from the two largest powders (PTFE 1 and 20 μm) exhibit the most significant benefits in terms of increasing the number of coating layers. LMs formed on the compressed PTFE 20 μm powder bed formed as monolayer LMs. In contrast, for the two 0.25 μm powders, the lifetime changed to a much lesser degree, with a 7 and 23 minute increase observed for 0.25 μm and 20 μm PTFE, respectively. Upon consideration of the fumed silica, the number of layers insignificantly changed across the four different formation methods, owing to the ease with which silica particles adhered to the water droplet's exterior. Comparatively, the 0.25 μm PTFE particles displayed a considerably wider range of particle layers due to the presence of agglomerates on the LM surface, inherently increasing the total coating particle mass. Despite forming fewer layers than the PTFE 0.25 μm particles, the fumed silica particles exhibited a longer lifetime. This observation suggests that while the lifetime depends on the number of multilayers, other particle characteristics such as packing density and hydrophobicity contribute to the variation in lifetime.
When considering each pre-specified group individually, it is evident that the less hydrophobic group is not as positively influenced by an increase in contact angle as the more hydrophobic group (Fig. 3b). Among the common plastics, the PVC-LM exhibited a contact angle of 88.1 ± 1.7°, categorising it as a weakly hydrophilic coating particle. The ability to still form a LM is attributed to the particles existing in a metastable state with the droplet surface. This metastability denotes a condition where it would be energetically unfavourable for the particles to move from the droplet surface into the bulk liquid, with graphite particles observed to form stable LMs.12,57,60 However, the PVC-LM's lifetime is considerably lower than the other three LMs in this group due to early collapse. The remaining three LMs exhibit relatively similar lifetimes, with an improvement of only ∼4 minutes for a ∼23° increase in contact angle, from the PS to LDPE-LM.
In contrast, there is a more prominent improvement in lifetime with contact angle in the higher hydrophobicity group (Fig. 3b). The fumed SiO2-LM (160.8 ± 1.6°) has a ∼15-minute longer lifetime than the PTFE-LM (130.2 ± 3.1°). The difference between the two groups is primarily attributed to the variation in particle sizes. As discussed earlier, the use of nanoscale powders allows for a higher degree of coating particle density and droplet surface coverage.
3.2. The reactor engineering approach (REA) to liquid marble evaporation
The REA to drying, initially proposed by Chen in 1996 as a semi-empirical model, represents a middle-ground strategy. In this approach, two competing “reactions,” namely evaporation and condensation, coexist.61 Positioned between empirical and mechanistic models, the basis of REA offers a balanced perspective. Empirical models, despite their relative simplicity in mathematical formulation, often fall short in providing a thorough explanation of the physics of drying and are typically restricted to specific drying conditions. On the other hand, mechanistic models, derived from fundamental phenomena, lack precise dynamic measurements and can be overly intricate, featuring numerous independent parameters that necessitate extensive experimental determination and validation.27 The strength of the REA method lies in its ability to streamline mathematical formulation, requiring only a handful of experimental parameters for observation and fitting. This characteristic enables the development of a simple, accurate, and robust model for systems that would otherwise be considered complex. REA has demonstrated its applicability in various forms of drying, particularly in the food industry, where investigations into milk droplets and vegetables have been conducted.25–29,62 Furthermore, its utility extends across different industrial applications, including the use of spray dryers and waste treatment. REA excels in modelling variable conditions involving inconsistent temperatures and intermittent drying processes.63,64 | (1) |
 | (2) |
 | (3) |
 | (4) |
 | (5) |
 | (6) |
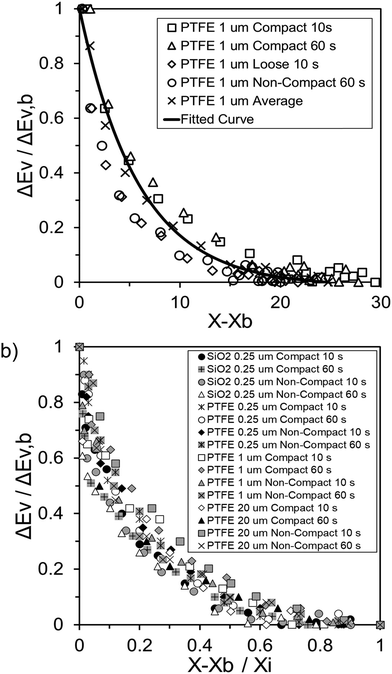
Fig. 4 highlights the process on how REA was applied, and the form of the equations obtained for LM drying. Due to the various types of LM coatings employed, different ΔEv/ΔEv,bvs. X − Xb plots were obtained. To allow for direct comparison between LMs, normalisation of the X − Xb variable can be achieved through the use of the initial moisture content on a dry basis ((X − Xb)/Xi). Fig. 5a shows the normalised activation energy and fitted curve for LMs coated with 1 μm PTFE powder, with the resulting correlation:
 | (7) |
 | (8) |
The relative activation energy is intricately linked to transport properties, akin to diffusivity in the diffusion model, solely dependent on materials, facilitating the description of barriers and system physics.24,72 In the initial stages of the process, the relative energy tends to be 0 due to the predominant presence of free water evaporation. As free water depletes, the evaporation of bound water commences, requiring higher relative energy, given its internal attachment to the LM structure. This increased energy demand correlates with decreasing water availability. Ultimately, as equilibrium is achieved, the equilibrium free moisture content (Xb) is attained, signalling the conclusion of the drying process.
Throughout the application of the REA to diverse systems, the resultant activation energy equations have demonstrated significant variability (Table 2). Various mathematical functions, including polynomial, exponential, and logarithmic operations, have been employed for fitting the REA models. In this study, the final equation utilises an exponential function, determined to offer the most optimal fit to the data. Notably, when characterising the evaporation of LMs in terms of energy and moisture, a quadratic fit, exemplified by the mango equation in Table 2, did not align well with the data. It yielded inferior values for R2, sum square error (SSE), and root mean square error (RMSE).
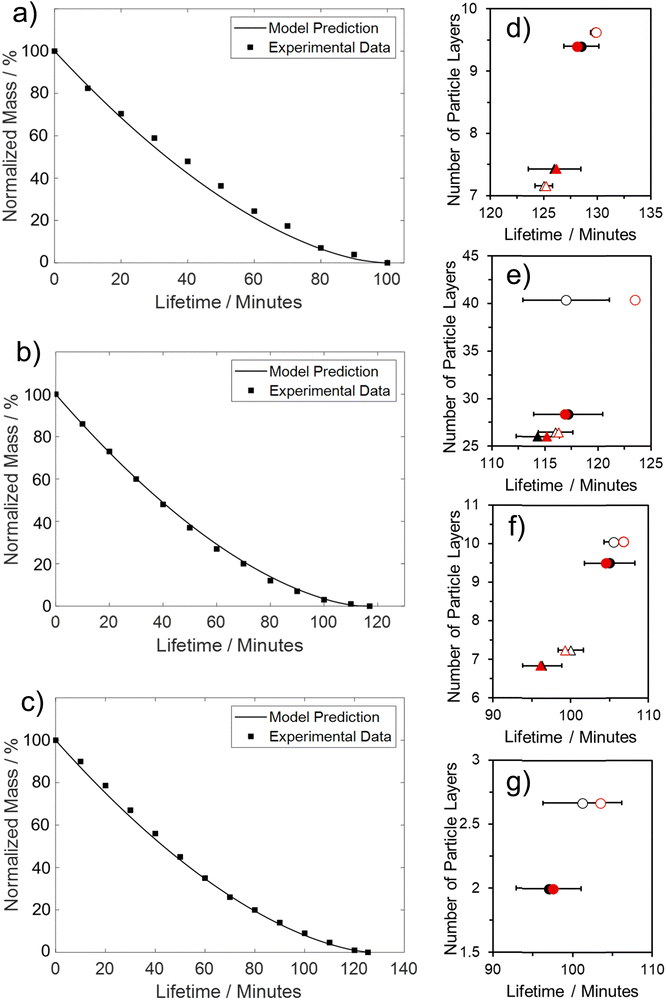
Table 2 reveals that the fitted equations exhibited notable similarities to those associated with the drying of milk droplets, with the incorporation of an additional condition. Employing this approach (Fig. 6) allows for a reliable estimation of the droplet's surface characteristics, particularly vapor concentration. Fig. 7 presents a comparison between the experimental LM evaporation results and the developed REA model in terms of the drying profile evolution and overall lifetime. This was achieved via back calculations of eqn (8) and (10) using MATLAB ordinary differential equation (ODE) solver, ode23s.73 Ode23s was chosen as it can undertake more work per step to get to the solution of the ODEs. When ode45 was used for comparison, complex imaginary numbers propagated the solution. Therefore, using ode23s was preferential as these imaginary numbers did not form due to the additional steps. For each of the modelled results, a fitted correction factor (Cf,LM) is added to account for the coating powders characteristics:
 | (9) |
 | (10) |
Overall, both criteria were generally met, with the model demonstrating excellent agreement with both the final value of LM lifetime and the associated evaporation profile. This alignment is evident for both 0.25 μm PTFE and SiO2 (60 s compressed, see Fig. 7b and c), where the model accurately captures both the constant and falling rate periods. The linear section concludes after approximately 60% of the initial liquid mass has been lost. The model also exhibits a satisfactory fit with 1 μm PTFE (60 s compressed, see Fig. 7a), accurately identifying the start of the non-linear phase of evaporation. However, there is a slight underprediction of the steepness during the constant falling rate period.
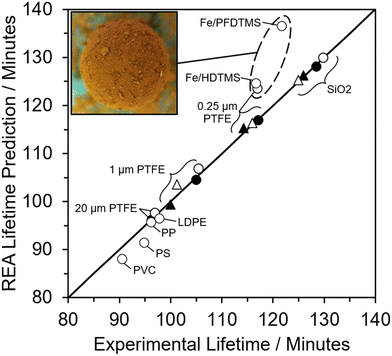
When the REA model was employed to evaluate the overall lifetime of the LMs, it demonstrated excellent agreement with experimentally determined lifetimes. This is evident from the predicted values falling within the experimental standard deviations. Instances where model values deviate more significantly from experimental results were observed for PTFE LMs rolled for 60 s in the non-compressed powder bed. This discrepancy arises primarily from uneven coverage on these LMs, leading to an overestimation of LM lifetime. Specifically, for the 0.25 μm PTFE LM, large aggregates of particles attached to the powder coating resulting in a greater particle mass, leading to an overestimation of the number of particle layers. This observation is illustrated in Fig. 8, where all experimentally investigated LMs closely align with the respective predicted results. However, a cluster of three LMs deviates from the y = x line, each exhibiting numerous particle aggregates on their surface, as depicted in the inset of Fig. 8 with prominent iron oxide groupings. The additional mass from particle aggregates compromises the accuracy of the model by overpredicting the number of insulating particle layers and, consequently, the overall lifetime. It is suggested that LMs should be rolled on a uniform (compressed) powder bed devoid of particle aggregates to obtain a more accurate overall lifetime estimation.
The model's precision in determining the maximum lifetime and evaporation rate is enhanced through the incorporation of the correction factor (eqn (9)). This factor, dependent on both the number of coating layers and particle contact angle, accommodates variations in surface area. Notably, in studies employing the REA, the degree of material wetting is less frequently documented. The ‘real’ determination of surface area across multiple coating layers poses a challenge in drying studies and remains an underexplored aspect. Given its significance as a governing factor in the formation of stable LMs, the consideration of contact angle becomes pivotal. An inverse relationship has been proposed between particle hydrophobicity and buckling time, and the degree of particle extrusion from the water interface must also be considered, directly influencing the available surface area of the liquid droplet.12 Furthermore, the number of coating layers is a critical parameter influencing the barrier to evaporation.52,53 To adequately represent these factors with appropriate weighting, eqn (10) assumes a specific form that incorporates the correction factor. A comparative analysis with existing studies employed for LM lifetime predictions reveals the robustness of the results obtained in this study. Out of the 14 predictions, 13 fall within the standard deviation of experimental results (Fig. 7d–g). Consequently, the REA not only offers an excellent estimation of the final lifetime but also provides a comprehensive representation of the drying curve—the evolution of liquid mass over time.
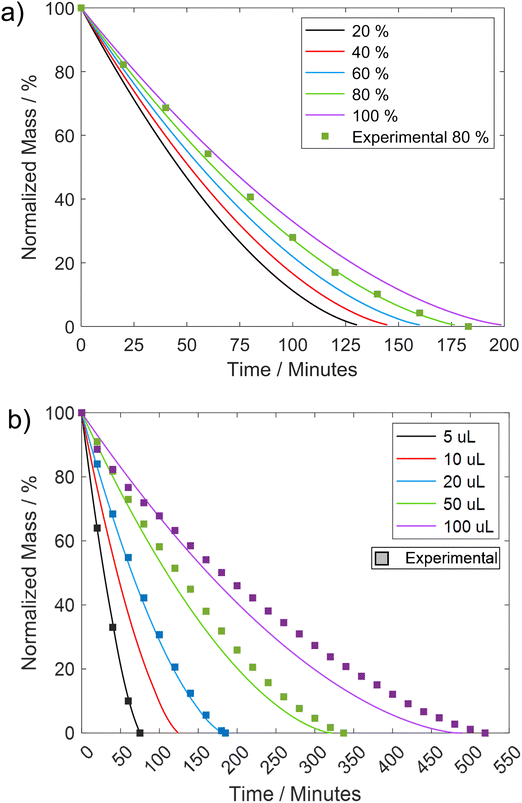
As discussed in the literature, variations in certain fluid parameters can influence the lifetime of LM, with two key factors being the relative humidity of the external environment and the volume of the liquid droplet.51 Multiple studies have indicated that an increase in relative humidity tends to enhance the lifetime of LMs.17,24,56,57 For instance, research by Tosun and Erbil56 demonstrated that elevating humidity from 36% to 74% resulted in a remarkable 140% increase in the lifetime of a ∼10 μL water droplet coated with 5–6 μm PTFE. When comparing the variation in relative humidity with the REA model, an increase from 20% to 80% corresponds to approximately a 36% improvement in lifetime (Fig. 9a).
The developed model also facilitates straightforward exploration of initial droplet volume variations, showcasing that a 100 μL droplet (a magnitude increase) achieves a lifetime of approximately 450 minutes (Fig. 9b). Subsequent drying experiments conducted at varying humidity levels and volumes corroborated the REA model's capability to consistently generate accurate predictions. However, in instances of droplet volume variation, deviations started to emerge as the droplet volume increased. This divergence was likely attributed to the droplet no longer maintaining a spherical shape, elongating lengthwise under the influence of gravity. Consequently, this change in shape resulted in a different surface area-to-volume ratio available for evaporation.
4. Conclusion
Throughout this study, it has been established that particle characteristics, the number of coating layers, and the degree of wetting collectively influence the overall lifetime of LM. The extension of droplet lifetime reached a maximum of 42% when a 0.25 μm fumed-silica LM was employed. The LMs with the longest lifetimes were comprised of small, highly hydrophobic particles capable of multilayer packing. Conversely, water droplets coated with larger particles formed monolayer LMs, which provide little evaporative resistance. Furthermore, they suffer from a “speeding-up” effect, attributed to monolayer incompressibility, droplet elongation, and a locally curved liquid interface between coating particles. These factors cause a 200 μm PTFE LM to exhibit a lifetime shorter than its equivalent naked droplet (11.5% less). The study demonstrated the variability in the number of particle layers, depending on the state of the powder bed and the duration of water droplet agitation. Droplets rolled on compressed beds consistently resulted in fewer particle layers, irrespective of the duration. Prolonged rolling increased the likelihood of particle aggregates attaching to the LM's surface, elevating the total mass, and leading to overestimations of the number of layers, as observed in the case of 0.25 μm PTFE. It was found that for multilayered LMs coated with fine particles (1, 0.25 μm), the contact angle of the particles improved lifetime to a greater extent than the number of layers present. On the other hand, when multilayers of coarse particles are used (2, 20 μm) the opposite is true, with the number of layers having a greater impact on lifetime, showcasing a nuanced interplay between particle characteristics and coating layers.This study has also successfully demonstrated the application of the reaction engineering approach (REA) for drying in the evaporation of 10 μL multilayer LMs. A general model for ΔEv/ΔEv,bvs. X − Xb/Xi can be effectively applied for multilayer LMs, as they follow the same evaporation profile when compared using normalised moisture content (R2 = 0.996). The model incorporates a correction factor (Cf,LM = 1/N0.031 − θ0.107 + 1), accounting for the number of particle layers and the contact angle of the particles. Across all four powder types at four different thicknesses, the developed model exhibited excellent agreement with the experimental values within the standard deviations. It is important to note that the models' limitations were observed for LMs with uneven particle coatings, particularly in the form of particle aggregates, where the increased mass would overpredict the number of coating layers. Overall, the model demonstrated an excellent fit for LMs rolled on a compressed powder bed for 60 s, with 0.25 μm, 1 μm, and 0.25 μm SiO2 achieving R2 values of 0.999, 0.997, and 0.997, respectively. The utilisation of such a model offers a valuable tool for providing a general indicator of LM lifetimes for customised coatings, eliminating the need for extensive trials, and optimising operational times.
Author contributions
JS, main author, was responsible for conceptualising the experimental design, conducting all physical and computation experiments outlined within this work as well as writing, reviewing and editing the manuscript. KM, was responsible for the development of the MATLAB code used for the modelling of liquid marble evaporation via the reactor engineering approach to drying, including any discussion where the modelling is considered. AP was involved in the discussion of the REA modelling. VZ and SSP were involved in the experimental design conceptualisation, supervision, revision to the manuscript and inclusion of additional relevant information (text) throughout the manuscript.Data availability
The data supporting this article have been included as part of the ESI.†Conflicts of interest
The authors declare that the research was conducted in the absence of any commercial or financial relationships that could be construed as a potential conflict of interest.Acknowledgements
These authors acknowledge financial assistance from the EPSRC DTP studentship (Reference: EJU/140100433).References
- P. Aussillous and D. Quere, Nature, 2001, 411, 924–927 CrossRef CAS PubMed.
- G. Alp, E. Alp and N. Aydogan, Colloids Surf., A, 2020, 585, 124051 CrossRef CAS.
- T. Arbatan, L. Li, J. Tian and W. Shen, Adv. Healthcare Mater., 2012, 1, 80–83 CrossRef CAS.
- T. C. Draper, N. Phillips, R. Weerasekera, R. Mayne, C. Fullarton, B. P. J. de Lacy Costello and A. Adamatzky, Lab Chip, 2020, 20, 136–146 RSC.
- A. M. Fernandes, M. Paulis, J. Yuan and D. Mecerreyes, Part. Part. Syst. Charact., 2016, 33, 734–739 CrossRef CAS.
- C. Gabbott, E. Mele and T. Sun, J. Biotechnol., 2020, 323, 82–91 CrossRef CAS.
- N.-K. Nguyen, C. H. Ooi, P. Singha, J. Jin, K. R. Sreejith, H.-P. Phan and N.-T. Nguyen, Processes, 2020, 8, 793 CrossRef CAS.
- J. Tian, T. Arbatan, X. Li and W. Shen, Chem. Eng. J., 2010, 165, 347–353 CrossRef CAS.
- J. Tian, N. Fu, X. D. Chen and W. Shen, Colloids Surf., B, 2013, 106, 187–190 CrossRef CAS.
- Y. Xue, H. Wang, Y. Zhao, L. Dai, L. Feng, X. Wang and T. Lin, Adv. Mater., 2010, 22, 4814–4818 CrossRef CAS PubMed.
- B. Laborie, F. Lachaussée, E. Lorenceau and F. Rouyer, Soft Matter, 2013, 9, 4822–4830 RSC.
- U. Cengiz and H. Y. Erbil, Soft Matter, 2013, 9, 8980–8991 RSC.
- K. Ueno, S. Hamasaki, E. J. Wanless, Y. Nakamura and S. Fujii, Langmuir, 2014, 30, 3051–3059 CrossRef CAS PubMed.
- Y. Asaumi, M. Rey, N. Vogel, Y. Nakamura and S. Fujii, Langmuir, 2020, 36, 2695–2706 CrossRef CAS.
- D. Matsukuma, H. Watanabe, M. Minn, A. Fujimoto, T. Shinohara, H. Jinnai and A. Takahara, RSC Adv., 2013, 3, 7862–7866 RSC.
- S. Yukioka, J. Fujiwara, M. Okada, S. Fujii, Y. Nakamura and S.-I. Yusa, Langmuir, 2020, 36, 6971–6976 CrossRef CAS PubMed.
- X. Lin, W. Ma, L. Chen, L. Huang, H. Wu and A. Takahara, RSC Adv., 2019, 9, 34465–34471 RSC.
- B. P. Binks, A. Johnson and J. A. Rodrigues, Soft Matter, 2010, 6, 126–135 RSC.
- M. Hu, M. Tian, J. He and Y. He, Colloids Surf., A, 2012, 414, 216–219 CrossRef CAS.
- E. Bormashenko, P. K. E. Roy, S. Shoval and I. Legchenkova, Condens. Matter, 2020, 5, 62 CrossRef CAS.
- Y. Feng, G. Yao, J. Xu, L. Wang and G. Liu, J. Colloid Interface Sci., 2023, 629, 644–653 CrossRef CAS.
- G. McHale and M. I. Newton, Soft Matter, 2015, 11, 2530–2546 RSC.
- F. Geyer, Y. Asaumi, D. Vollmer, H.-J. Butt, Y. Nakamura and S. Fujii, Adv. Funct. Mater., 2019, 29, 1808826 CrossRef.
- K. R. Sreejith, C. H. Ooi, D. V. Dao and N.-T. Nguyen, RSC Adv., 2018, 8, 15436–15443 RSC.
- X. D. Chen and S. X. Q. Lin, AIChE J., 2005, 51, 1790–1799 CrossRef CAS.
- S. Yang, T. Liu, N. Fu, J. Xiao, A. Putranto and X. D. Chen, J. Food Eng., 2021, 305, 110613 CrossRef.
- X. D. Chen and A. Putranto, Modelling Drying Processes: A Reactor Engineering Approach, Cambridge University Press, Cambridge, UK, 2013 Search PubMed.
- S. X. Q. Lin and X. D. Chen, Dry. Technol., 2006, 24, 1329–1334 CrossRef CAS.
- C. A. Schneider, W. S. Rasband and K. W. Eliceiri, Nat. Methods, 2012, 9, 671–675 CrossRef CAS PubMed.
- F. Pita and A. Castilho, Waste Manage., 2017, 60, 91–99 CrossRef CAS PubMed.
- K. Lin, R. Chen, L. Zhang, W. Shen and D. Zang, Adv. Mater. Interfaces, 2019, 6, 1900369 CrossRef.
- P. Singha, S. Swaminathan, A. S. Yadav and S. N. Varanakkottu, Langmuir, 2019, 35, 4566–4576 CrossRef CAS.
- A. F. Stalder, G. Kulik, D. Sage, L. Barbieri and P. Hoffmann, Colloids Surf., A, 2006, 286, 92–103 CrossRef CAS.
- J. Grbic, B. Nguyen, E. Guo, J. B. You, D. Sinton and C. M. Rochman, Environ. Sci. Technol. Lett., 2019, 6, 68–72 CrossRef CAS.
- Y. Zhao, Z. Xu, H. Niu, X. Wang and T. Lin, Adv. Funct. Mater., 2015, 25, 437–444 CrossRef CAS.
- A. Rendos, N. Alsharif, B. L. Kim and K. A. Brown, Soft Matter, 2017, 13, 8903–8909 RSC.
- S. Asare-Asher, J. N. Connor and R. Sedev, J. Colloid Interface Sci., 2015, 449, 341–346 CrossRef CAS.
- M. I. Newton, D. L. Herbertson, S. J. Elliott, N. J. Shirtcliffe and G. McHale, J. Phys. D: Appl. Phys., 2006, 40, 20–24 CrossRef.
- T. H. Nguyen, K. Hapgood and W. Shen, Chem. Eng. J., 2010, 162, 396–405 CrossRef CAS.
- P. McEleney, G. M. Walker, I. A. Larmour and S. E. J. Bell, Chem. Eng. J., 2009, 147, 373–382 CrossRef CAS.
- S. Chandan, S. Ramakrishna, K. Sunitha, M. S. Chandran, K. S. S. Kumar and D. Mathew, J. Mater. Chem. A, 2017, 5, 22813–22823 RSC.
- A. Gray, Modern Differential Geometry of Curves and Surfaces with Mathematica, CRC Press, Inc., Florida, US, 1996 Search PubMed.
- K. Tapp, Differential Geometry of Curves and Surfaces, Springer International Publishing, New York, US, 2016 Search PubMed.
- N. Pike, D. Richard, W. Foster and L. Mahadevan, Proc. Biol. Sci., 2002, 269, 1211–1215 CrossRef PubMed.
- L. Feng, S. Li, Y. Li, H. Li, L. Zhang, J. Zhai, Y. Song, B. Liu, L. Jiang and D. Zhu, Adv. Mater., 2002, 14, 1857–1860 CrossRef CAS.
- K.-Y. Law, J. Phys. Chem. Lett., 2014, 5, 686–688 CrossRef CAS PubMed.
- A. B. D. Cassie and S. Baxter, Trans. Faraday Soc., 1944, 40, 546–551 RSC.
- R. N. Wenzel, Ind. Eng. Chem., 1936, 28, 988–994 CrossRef CAS.
- G. Wypych, Handbook of Polymers, Elsevier Science, London, UK, 2016 Search PubMed.
- S. M. Iveson, S. Holt and S. Biggs, Colloids Surf., A, 2000, 166, 203–214 CrossRef CAS.
- J. Saczek, X. Yao, V. Zivkovic, M. Mamlouk, D. Wang, S. S. Pramana and S. Wang, Adv. Funct. Mater., 2021, 31, 2011198 CrossRef CAS.
- S. Ogawa, H. Watanabe, L. Wang, H. Jinnai, T. J. McCarthy and A. Takahara, Langmuir, 2014, 30, 9071–9075 CrossRef CAS.
- S. Mahmoudi Salehabad, S. Azizian and S. Fujii, Langmuir, 2019, 35, 8950–8960 CrossRef CAS PubMed.
- A. T. Tyowua, Solid particles at fluid interfaces : emulsions, liquid marbles, dry oil powders and oil foams, Degree of Doctor of Philosophy The University of Hull, 2014 Search PubMed.
- N. Eshtiaghi and K. P. Hapgood, Powder Technol., 2012, 223, 65–76 CrossRef CAS.
- A. Tosun and H. Y. Erbil, Appl. Surf. Sci., 2009, 256, 1278–1283 CrossRef CAS.
- M. Dandan and H. Y. Erbil, Langmuir, 2009, 25, 8362–8367 CrossRef CAS.
- C. P. Whitby, X. Bian and R. Sedev, Colloids Surf., A, 2013, 436, 639–646 CrossRef CAS.
- X. Li, H. Shi, Y. Wang, H. Wang, J. Huang and M. Duan, Soft Matter, 2020, 16, 4512–4519 RSC.
- N. Janardan, M. V. Panchagnula and E. Bormashenko, Sadhana-Acad. P. Eng. S., 2015, 40, 653–671 CrossRef CAS.
- X. D. Chen and G. Z. Xie, Food Bioprod. Process., 1997, 75, 213–222 CrossRef.
- S. X. Qi Lin and X. D. Chen, Dry. Technol., 2005, 23, 1395–1406 CrossRef.
- K. C. Patel, X. D. Chen, S. X. Q. Lin and B. Adhikari, AIChE J., 2009, 55, 217–231 CrossRef CAS.
- A. Putranto and X. D. Chen, Proc. Chem., 2014, 9, 77–87 CrossRef CAS.
- A. Putranto and X. D. Chen, Chem. Eng. Process., 2013, 70, 169–183 CrossRef CAS.
- X. D. Chen and X. Peng, Dry. Technol., 2005, 23, 83–103 CrossRef.
- S. X. Qi Lin and X. D. Chen, Chem. Eng. Res. Des., 2002, 80, 401–410 CrossRef.
- R. B. Keey, Drying of loose and particulate materials, Hemisphere Publishing Corporation, New York, NY, 1992 Search PubMed.
- A. Putranto, Z. Xiao, X. D. Chen and P. A. Webley, Ind. Eng. Chem. Res., 2011, 50, 1089–1098 CrossRef CAS.
- S. X. Q. Lin and X. D. Chen, Chem. Eng. Process., 2007, 46, 437–443 CrossRef CAS.
- R. Younsi, D. Kocaefe, S. Poncsak and Y. Kocaefe, AIChE J., 2006, 52, 2340–2349 CrossRef CAS.
- P. S. Bhosale and M. V. Panchagnula, Langmuir, 2010, 26, 10745–10749 CrossRef CAS PubMed.
- MATLAB (R2022b), The MathWorks Inc., Natick, Massachusetts, 2022 Search PubMed.
Footnote |
| † Electronic supplementary information (ESI) available. See DOI: https://doi.org/10.1039/d4sm00478g |
| This journal is © The Royal Society of Chemistry 2024 |

