 Open Access Article
Relationship between π–A isotherms and single microgel/microgel array structures revealed via the direct visualization of microgels at the air/water interface†
Takahisa
Kawamoto
 ab,
Haruka
Minato
 ab and
Daisuke
Suzuki
 *ab
*ab
aGraduate School of Environmental, Life, Natural Science and Technology, Okayama University, 3-1-1 Tsushimanaka, Kita-ku, Okayama, 700-8530, Japan. E-mail: d_suzuki@okayama-u.ac.jp
bGraduate School of Textile Science & Technology, Shinshu University, 3-15-1 Tokida, Ueda, Nagano 386-8567, Japan
First published on 15th July 2024
Abstract
The structures of single microgels and microgel arrays formed at the air/water interface were visualized directly, and their structures correlated with π–A isotherms in order to understand the compression behavior of soft and deformable microgels at this interface. Large microgels (ca. 4 μm) were synthesized so that these can be clearly visualized at the air/water interface, even under high compression, and a series of microgel compression experiments were directly evaluated using a Langmuir trough equipped with a fluorescence microscope. The experiments revealed that upon compressing the microgel arrays at the interface voids disappeared and colloidal crystallinity increased. However, the colloidal crystallinity decreased when the microgel arrays were strongly compressed. In addition, when the structures were observed at higher magnification, it became clear that the single microgel structures, when visualized from above, changed from circular to polygonal upon compressing the microgel array. The results of this study can be expected to improve the understanding of the compression behavior of microgel arrays adsorbed at the air/water interface and will thus be useful for the creation of new functional microgel stabilizers with potential applications in e.g., bubbles and emulsions.
Introduction
Recently, colloidal particles have received significant attention, especially due to their utility as particulate interfacial stabilizers for air/water and oil/water interfaces, given that they exhibit better adsorption properties than surfactants of low molecular weight.1,2 In addition, it is easy to adjust the surface characteristics and control the size of colloidal particles, which allows a precise tuning of the adsorption energy at the interface. To date, colloidal particles have been applied as particulate interfacial stabilizers in several fields, including pharmaceuticals, cosmetics, paints, food and agricultural science, as well as environmental technology.2–6 Hydrogel nano/microparticles (nanogels/microgels) are a type of colloidal particles that are, unlike rigid colloidal particles made from e.g., polystyrene and silica, soft and deformable. These properties arise because nanogels/microgels consist of a three-dimensionally cross-linked network of well-hydrated polymer chains, and thus, they are highly swollen in water, which usually accounts for more than 90% of their volume.7–13 Accordingly, nanogels/microgels are colloidally stable and biocompatible. In addition, nanogels/microgels show stimuli-responsive properties and a rapid response to a variety of stimuli.14,15 Therefore, nanogels/microgels are also excellent particulate stabilizers for emulsions and foams.16–22The microgels of poly(N-isopropyl acrylamide), henceforth denoted as pNIPAm, have been widely studied given that they can be synthesized in uniform size and with well-controlled properties, both of which are factors that make them useful as a material for proofs of concept.12,15,23 In particular, pNIPAm-based microgels are excellent models of particulate stabilizers, considering that pNIPAm monomers, single chains, and their nanogels/microgels exhibit surface activity, and thus they spontaneously adsorb to air/water24,25 or oil/water interfaces.26–28
Since the surface activities of pNIPAm-based microgels were first studied by utilizing a pendant-drop method at the air/water interface,29 tremendous efforts have been committed to understanding the detailed interfacial behavior of microgels adsorbed at air/water and oil/water interfaces using various techniques, e.g., neutron-reflectivity measurements, small-angle light scattering (SALS), cryo–scanning electron microscopy (SEM), freeze-fracture shadow-casting cryo-SEM, transmission X-ray microscopy, and simulations.30–35 In particular, the Langmuir–Blodgett (LB) technique has been widely used to examine the compression behavior of microgels adsorbed at interfaces as well as for preparing 2D colloidal crystals on a substrate as Langmuir films.24,36 Although the temperature responsiveness, deformability, and array structures of microgels at interfaces have been extensively investigated using advanced observation technologies,35,37 visualizing individual microgels and microgel-array structures at the fluid interfaces during compression is still a challenge, and thus extremely important. Visualizing individual microgels is difficult is mostly due to the low resolution on account of the low polymer density and the sub-micron-size of microgels.38,39 To the best of our knowledge, in most studies on compressed microgel monolayers at the fluid interface, the array structures are evaluated using SEM and atomic-force-microscopy (AFM) images of the microgels after transferring them onto a solid substrate.
In this context, our group has investigated the self-organization of microgels and soft deformable particles during the evaporation of water from sessile droplets.40–46 Microgels spontaneously adsorb and gradually order at the air/water interface of a dilute dispersion droplet, whereby the center-to-center distances of the microgels decrease due to the decrease in the interfacial area.40 Furthermore, the ordered structures of the microgel monolayers that are formed at the air/water interface remain on a solid substrate after evaporation.40 The effect of the size, shape, degree of cross-linking, chemical species, and charge density of the microgels and other colloidal particles on this self-organization process has been examined.41–44 Through a series of studies, we found that the microgel arrays at the air/water interface and on the solid substrates, before and after drying of the sessile droplets, are not always the same. In particular, the array structures of poly(acrylamide)-based microgels and highly charged poly(NIPAm-co-acrylic acid)-based microgels on the solid substrates become disordered due to capillary forces during the evaporation of water, even though ordered structures are formed at the air/water interface. This behavior is similar to that of rigid colloidal particles such as polystyrene particles.41,47 Hence, we concluded that the direct visualization of microgels adsorbed at the fluid interface is crucial for understanding the relationship between the structure and properties (or function) of microgels/microgel arrays and can be expected to be useful to further improve microgels as particulate interfacial stabilizers.
Very recently, we have succeeded in visualizing and quantifying the compression behavior of microgels at the air/water interface by combining a Langmuir trough with a fluorescence-microscopy system,48 which revealed that the deformed microgels uniformly assemble into hexagonal array structures during compression at the air/water interface, regardless of the crosslinking density of the microgels. Subsequently, the array structures of the highly crosslinked microgels were found to be disordered after drying and deposition on solid substrates. Although we have demonstrated the importance of the direct visualization of microgel arrays at air/water interfaces during compression, it is still unclear how the structures of single microgels/microgel arrays are changed during compression at the interface, given that single microgels in a highly compressed state could not be recognized using our visualization technique.48
In this study, we report the synthesis of micron-sized microgels that are large enough to be directly observed at the air/water interface. These microgels were used to gain a deeper understanding of the relationship between the structure and properties (or function) of microgel arrays at the air/water interface. In particular, structural changes in single microgels as well as in microgel arrays were visualized and analyzed during compression and the results correlated with the π–A isotherms.
Experimental
Materials
N-Isopropyl acrylamide (NIPAm, 98%), N,N′-methylenebis(acrylamide) (BIS, 97%), potassium peroxodisulfate (KPS, 95%), disodium hydrogen phosphate (Na2HPO4, 99.5%), anhydrous sodium dihydrogen phosphate (KH2PO4, 99%), potassium chloride (KCl, 99.5%), 1-ethyl-3-(3-dimethylaminopropyl)-carbodiimide hydrochloride (WSC, 98%), hydrochloric acid solution (HClaq), hydroxide solution (NaOHaq), sodium chloride (NaCl, 99%), methanol (MeOH, 99.8%), and ethanol (EtOH, 99.5%) were purchased from FUJIFILM Wako Pure Chemical Corporation (Japan) and used as received. Acrylic acid (AAc, 99%) was purchased from Sigma-Aldrich and used as received. 5-Aminofluorescein (isomer I) was purchased from TCI (Japan) and used as received. Water for all reactions, including the preparation of solutions and dispersions, was distilled and then ion-exchanged (EYELA, SA-2100E1) prior to use. Glass substrates (Neo Micro Cover Glass, Matsunami Glass Ind., Ltd.) were used following cleaning with ethanol and pure water.Microgel synthesis
Micron-sized microgels were synthesized via a modified aqueous free-radical precipitation polymerization (Scheme 1).49 First, a monomer solution (NIPAm: 0.9505 g; AAc: 0.1081 g; crosslinker BIS: 0. 0154 g; water: 99 mL) was poured into a four-necked round-bottom flask (300 mL) and heated to 40 °C under stirring (250 rpm). After removing the dissolved oxygen in the monomer solution by sparging with nitrogen gas for at least 30 min, the initiator (KPS, 0.055 g) dissolved in 1 mL of water was added. Immediately, the temperature was gradually increased from 40 °C to 60 °C at a rate of 1 °C/3 min. When the polymerization temperature reached 60 °C after 1 h, the monomer solution (NIPAm: 5.038 g; AAc: 1.405 g; BIS: 0.1503 g; NaCl: 0.0380 g (10 mM)) was supplied to the reaction solution in the flask at a rate of 200 μL min−1 using a syringe pump. After 5 h, the supply was stopped and the solution was stirred at 60 °C for 2 h and then the dispersion was cooled to room temperature to terminate the polymerization. The obtained microgel dispersion was centrifuged/redispersed twice using a Beckmann centrifuge (AvantiJ-26SXP, Beckmann Coulter) at 50![[thin space (1/6-em)]](https://www.rsc.org/images/entities/char_2009.gif) 000 G centrifugal force (RCF) in pure water with dialysis against pure water for a week.
000 G centrifugal force (RCF) in pure water with dialysis against pure water for a week.
 | ||
| Scheme 1 Synthesis of micron-sized microgels via a modified aqueous precipitation polymerization and the subsequent fluorescent labelling of the microgels. | ||
Microgel labelling
To observe the microgels using fluorescence microscopy, a fluorescent dye, 5-aminofluorescein (isomer I), was chemically bonded to the AAc-derived carboxy groups of the microgels via a carbodiimide reaction.48 For that purpose, the microgels were first dispersed in phosphate-buffered saline (PBS) solution (137 mM NaCl, 2.68 mM KCl, 2 mM KH2PO4, 10 mM Na2HPO4), the pH of which was adjusted to 7.4 using an aqueous solution of HCl. Next, 5-aminofluoresane (0.2605 g) and WSC (0.1438 g) were added in an amount corresponding to a 1 molar fraction of the carboxy groups in the dispersion. The mixture was stirred with a magnetic stirrer under shaded conditions. After ca. 18 h, the reaction solution was purified three times by centrifugation/redispersion with methanol to remove the unreacted fluorescent dye using an RCF of 70![[thin space (1/6-em)]](https://www.rsc.org/images/entities/char_2009.gif) 000 g and five times with pure water to exchange the remaining solvent.
000 g and five times with pure water to exchange the remaining solvent.
Optical/fluorescence microscopy characterization
The intrinsic viscosity [η] of the microgels at 25 °C was evaluated from the viscosity of diluted dispersions measured with an Ubbelohde viscometer.50 As is customary when dealing with microgels, the apparent volume fraction of the microgels (Φeff; Φeff = c[η]/2.5) was employed as a simple measure of the degree of packing. The critical concentration, C*, is the concentration where Φeff = 1. The microgels were transferred into rectangular Vitrotube borosilicate capillaries (0.1 × 2.0 mm) by capillary force. The diameters of the microgels were measured using optical/fluorescence microscopy (BX53, Olympus) to quantify the center-to-center distance between the microgels packed at C*.Characterization of the microgel surface using electrophoresis
The electrophoretic mobility, μ, of each microgel was measured via electrophoretic light scattering (ELS) using a Zetasizer NanoZS (Malvern, Zetasizer software v.4.20). A dilute dispersion was prepared, and the ionic strength was adjusted using NaCl. The samples were allowed to stand at the target temperature for 10 min to equilibrate their temperature, and the μ value under an applied potential of 40 V was obtained using the laser Dropper method (scattering angle: 173°, 20 independent measurements were averaged). Three obtained μ values were further averaged to improve the data reliability.Atomic-force-microscopy characterization
The morphology of the microgels on a solid substrate was examined using AFM (AFM5200S, Hitachi High-Tech Corporation), after transferring the microgel arrays from the air/water interface onto glass substrates. To prepare the samples, the microgels were adsorbed at the air/water interface of a water-filled Petri dish or the Langmuir trough after a particulate dispersion (water![[thin space (1/6-em)]](https://www.rsc.org/images/entities/char_2009.gif) :
:![[thin space (1/6-em)]](https://www.rsc.org/images/entities/char_2009.gif) ethanol = 1
ethanol = 1![[thin space (1/6-em)]](https://www.rsc.org/images/entities/char_2009.gif) :
:![[thin space (1/6-em)]](https://www.rsc.org/images/entities/char_2009.gif) 1) was spread at the air/water interface.
1) was spread at the air/water interface.
Characterization of the microgels compressed at the air/water interface
Compression isotherms at the air/water interface were evaluated using a Langmuir trough (trough dimensions: 140 mm × 680 mm; compressible area: 924 cm2; Kyowa Interface Science Co., Ltd) equipped with a Wilhelmy plate, a chiller set to 25 °C, and a fluorescence-microscopy system (lamp: HBO-100; excitation: 450–490 nm; emission: 510 nm; Axio Scope. A1, Zeiss). Images and movies of the compressed microgels were recorded using a CCD camera (Image X Earth Type S-2.0M Ver. 3.1.3, Kikuchi Optical Co, Ltd).48 The surface pressure, π (mN m−1) of the air/water interface was determined via the Wilhelmy method. First, a blank measurement was performed after filling the trough with water adjusted to an ionic strength of 1 mM with aqueous NaCl or water adjusted to an ionic strength of 1 mM. Next, microgels dispersed in a mixture of water and ethanol (1![[thin space (1/6-em)]](https://www.rsc.org/images/entities/char_2009.gif) :
:![[thin space (1/6-em)]](https://www.rsc.org/images/entities/char_2009.gif) 1, v/v) were spread over the whole area of the air/water interface using a micropipette. After 30 min, the evaluation of the compression isotherm at the air/water interface was initiated by moving the equipped trough barrier at a constant speed of 10 cm2 min−1 while directly observing the adsorbed microgels at the air/water interface. Simultaneously, the dipper with the glass substrate (Neo Micro Cover Glass, Matsunami Glass Ind., Ltd), was raised with a speed of 1 cm min−1 at a vertical angle so that the microgel arrays formed at the interface on to the glass substrates.
1, v/v) were spread over the whole area of the air/water interface using a micropipette. After 30 min, the evaluation of the compression isotherm at the air/water interface was initiated by moving the equipped trough barrier at a constant speed of 10 cm2 min−1 while directly observing the adsorbed microgels at the air/water interface. Simultaneously, the dipper with the glass substrate (Neo Micro Cover Glass, Matsunami Glass Ind., Ltd), was raised with a speed of 1 cm min−1 at a vertical angle so that the microgel arrays formed at the interface on to the glass substrates.
Image analysis
Microscope images of the microgels were analyzed using ImageJ (Version 2.0.0) and Python to elucidate the array structures and shapes of the microgels. The following eqn (1) was used to evaluate the hexagonal order parameter: | (1) |
| Circularity = 4π(area/perimeter2) | (2) |
Thus, the closer the shape is to a circle, the closer the circularity value is to 1.
Results and discussion
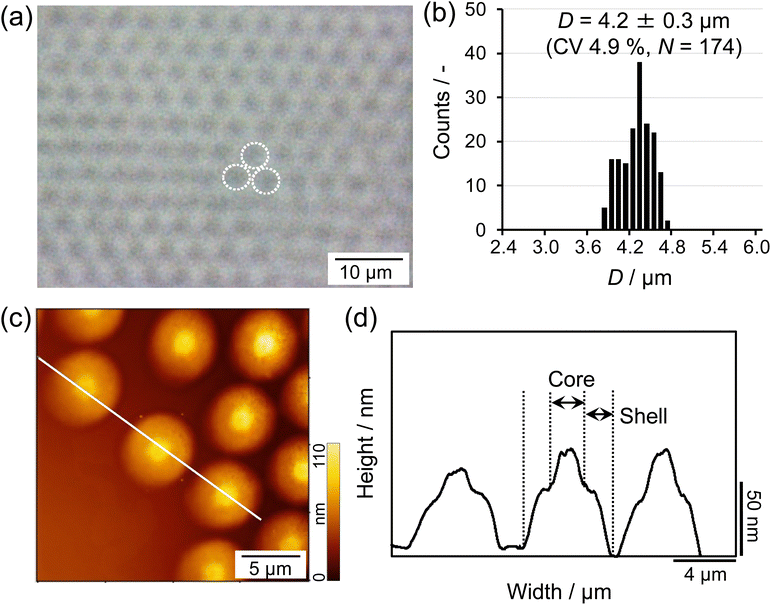
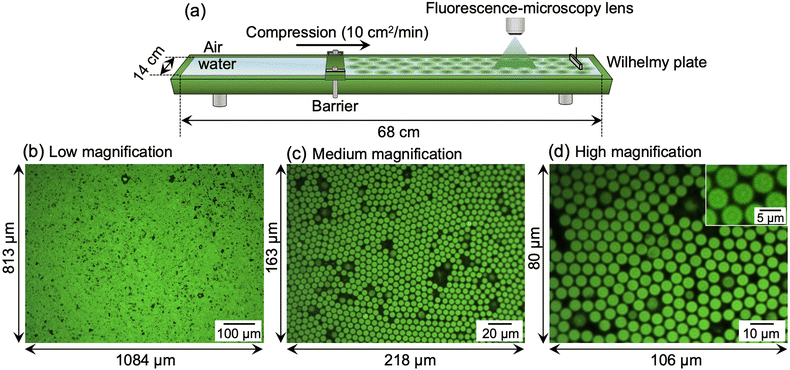
First, in order to obtain the larger microgels that facilitate clear visualization at the air/water interface via fluorescence microscopy, a modified precipitation polymerization method that combines a temperature-programmed method and feeding method was used for the microgel synthesis (Scheme 1).49 Thus, the crosslinked charged poly(NIPAm-co-AAc) microgels were synthesized and fluorescent dyes were covalently bonded to the carboxyl groups of the AAc moieties. The size of the obtained microgels was found to be 4.2 ± 0.3 μm (CV 4.9%, N = 174) in a 3D packed state at the critical concentration (C*; ϕeff = 1) (Fig. 1a and b). The AFM height image and its cross-section profile showed that the microgels clearly possess core–shell structures on the solid substrate (Fig. 1c and d), which is similar to the findings in our previous report.48 Subsequently, the microgels were fluorescently labeled via a carbodiimide reaction using carboxy groups as the attachment point for the fluorescent dye. The labeled microgels showed properties and structures similar to the unlabeled microgels in terms of size (before: 4.2 ± 0.3 μm; after: 4.3 ± 0.2 μm), electrophoretic mobility (before: −1.47 × 10⁻⁸ m2 V−1 s−1; after: −1.82 × 10⁻⁸ m2 V−1 s−1), and core–shell structure (Fig. 1 and Fig. S1, ESI†), indicating that the structure and properties of the microgels were not changed significantly by the modification.Next, a Langmuir trough equipped with a fluorescence microscope was assembled to simultaneously determine the π–A isotherm and the structure of the single microgels/microgel arrays at the air/water interface (Fig. 2a). The microscope was used to visualize the labeled microgels at the air/water interface. Here, the visualizable total area was 881![[thin space (1/6-em)]](https://www.rsc.org/images/entities/char_2009.gif) 292 μm2 (1084 μm × 813 μm) at low magnification, 35
292 μm2 (1084 μm × 813 μm) at low magnification, 35![[thin space (1/6-em)]](https://www.rsc.org/images/entities/char_2009.gif) 534 μm2 (218 μm × 163 μm) at medium magnification, and 8480 μm2 (106 μm × 80 μm) at high magnification (Fig. 2b–d).
534 μm2 (218 μm × 163 μm) at medium magnification, and 8480 μm2 (106 μm × 80 μm) at high magnification (Fig. 2b–d).
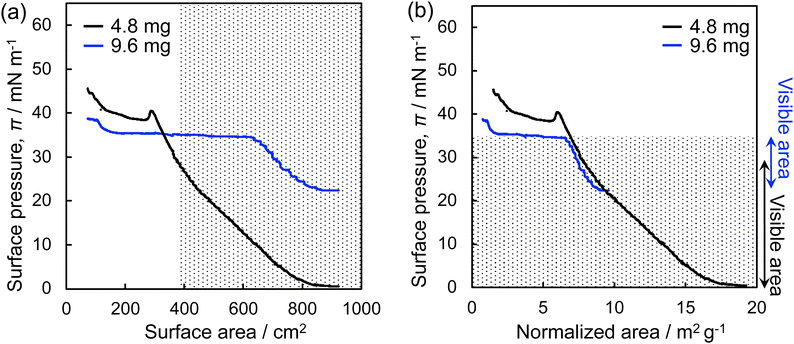
Fig. 3 shows the π–A isotherms of the microgels, which were obtained by plotting the surface pressure, π, measured with a Wilhelmy plate during compression, versus the air/water interface area where the microgels were adsorbed (Fig. 3a). Additionally, π was plotted against the particle-specific area per weight (Fig. 3b). Here, it should be noted that the observable area is limited (>ca. 400 cm2) given that the position of the microscope lens was fixed. When a lower amount of microgel (4.8 mg) was added to the air/water interface of the Langmuir trough, the π value gradually increased during compression, from ca. 0 mN m−1 to 40.4 mN m−1, followed by a decrease, which indicates the destruction of the microgel monolayer film (Fig. 3a). It was only possible to monitor the interface, where the microgels are adsorbed, at π values ranging from ca. 0 mN m−1 to ca. 30 mN m−1 (i.e., the observable area > ca. 400 cm2). Therefore, the amount of microgel added to the interface was subsequently increased from 4.8 mg to 9.6 mg to facilitate observation of the highly compressed microgels at higher π values. Thus, the π value gradually increased from 22.4 mN m−1 to 34.5 mN m−1, and then the π value remained constant at ca. 35 mN m−1 during compression (Fig. 3a). There is a slight difference in the π values between these two curves, which is probably due to the different structures of the single microgels and microgel arrays at the interface (Fig. 3b). By combining the results acquired from these two π–A isotherms, the microgel arrays which show π values between ca. 0 mN m−1 and 34 mN m−1 were directly visualized, as shown by the dotted area in Fig. 3.
Fig. 4 shows the images of the microgel arrays visualized at the air/water interface when fluorescence microscopy was conducted with a medium magnification lens. It is worth noting that, similar to our previous study,48 the microgels adsorbed at the interface could not be quantified due to the frequently changing structure of the microgel arrays before compression at ca. 0 mN m−1 (Movie S1, ESI†). Once the array structure and its focus became settled as the barrier was moved, the interfacial area, where the microgels were adsorbed, decreased. The images shown in Fig. 4a, b and Fig. S2 and S3 (ESI†) clearly confirm that the voids disappear upon compressing the microgel arrays at the interface. Moreover, the arrays exhibited a hexagonal-ordered structure, which was attributed to the rearrangement of the microgels during compression due to the repulsive interactions between the charged microgels at the air/water interface.43 In addition, the hexagonal-order parameter, Ψ6, was analyzed to quantitatively evaluate the crystallinity of the microgel arrays (Fig. 4c). It should be noted here that Ψ6 was analyzed by excluding the neighboring microgels with void areas. The Ψ6 value remained fairly constant at ca. 0.8 at lower π values (0 ≤ π ≤ 25 mN m−1), indicating that the microgel arrays exhibit high crystallinity. The Ψ6 value gradually decreased until ca. 0.6 after further compression (25 ≤ π ≤ 34 mN m−1) (Fig. 4c). In contrast, the nearest neighbor distance, DNND, between the neighboring microgels decreased linearly with increasing π, regardless of the crystallinity of the microgel arrays (Fig. 4d). In summary, it has been revealed that the microgel arrays show high colloidal crystallinity, even near π ca. 0 mN m−1, and that the disappearance of the voids leads to more homogeneous microgel arrays, whereas high compression of the microgel arrays leads to less ordered structures.
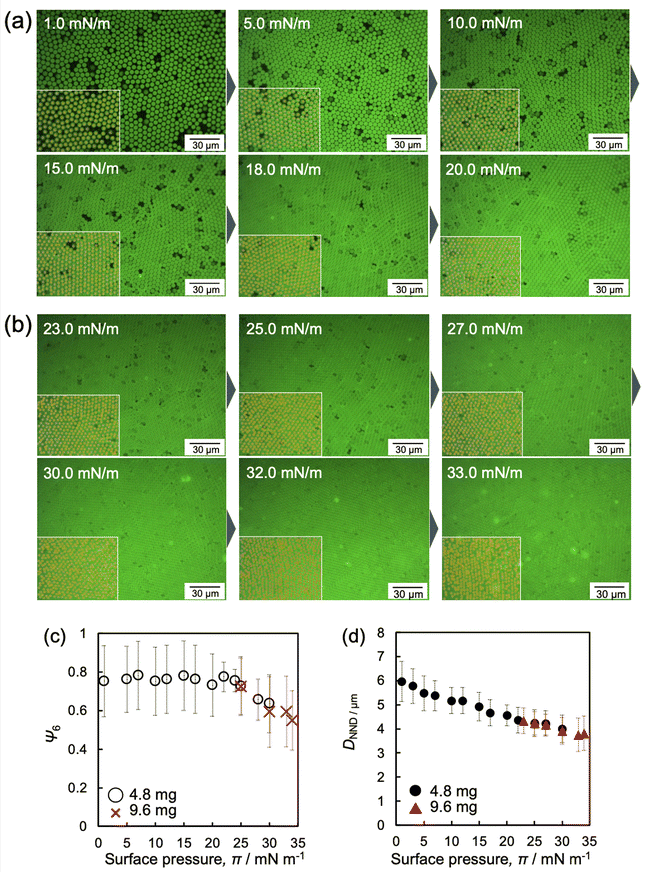 | ||
| Fig. 4 Representative fluorescence-microscopy images of the microgel array at the air/water interface during compression when (a) 4.8 mg and (b) 9.6 mg of microgels were added. These images were obtained with a medium-magnification lens. All images are shown in Fig. S2 and S3 (ESI†). (c) Hexagonal-order parameter, Ψ6, and (d) the nearest-neighbor distances, DNND, calculated from the fluorescence-microscopy images of the microgels adsorbed at the air/water interface (Fig. 4, 5 and Fig. S2, and S3, ESI†), as a function of π. Inset images with yellow plots indicate the part of analyzed positions of microgels. It should be noted here that Ψ6 was analyzed by excluding microgels that neighbor voids or are at the edge of the images to focus on the structural arrangement of neighboring microgels. | ||
In the highly compressed state (e.g., 33 mN m−1; see the enlarged image in Fig. S4, ESI†), the hexagonal-close-packed array structure of the microgels gradually changes. The fluorescence-microscopy images taken with a high-magnification lens show the changes more clearly (Fig. 5 and Fig. S5–S8, ESI†). Even though similarly structured two-dimensional arrays of particles, excluding the hexagonal structure, have already been reported for solid core-hydrogel shell particles adsorbed at the air/water interface during compression,51,52 to the best of our knowledge, this is the first time this has been demonstrated in situ in a microgel array adsorbed at an interface. The changes in array structure are probably caused by the core–shell structure of the microgels, which have a dense core and a low-density shell layer (Fig. 1c and d), and because the high interfacial stability of the microgels at the air/water interface enables compression without desorption into the subphase.51,52 The overlapping amphiphilic deformable shell layer at the interface seems to be crucial for the change in the two-dimensional array structures of the microgels,51,52 and is the reason why three-dimensional core–shell particles do not exhibit this behavior. Therefore, the shell layers of the micron-sized charged microgels experience electrostatic repulsion that is sufficiently weak to allow interpenetration with other shell layers at the air/water interface.
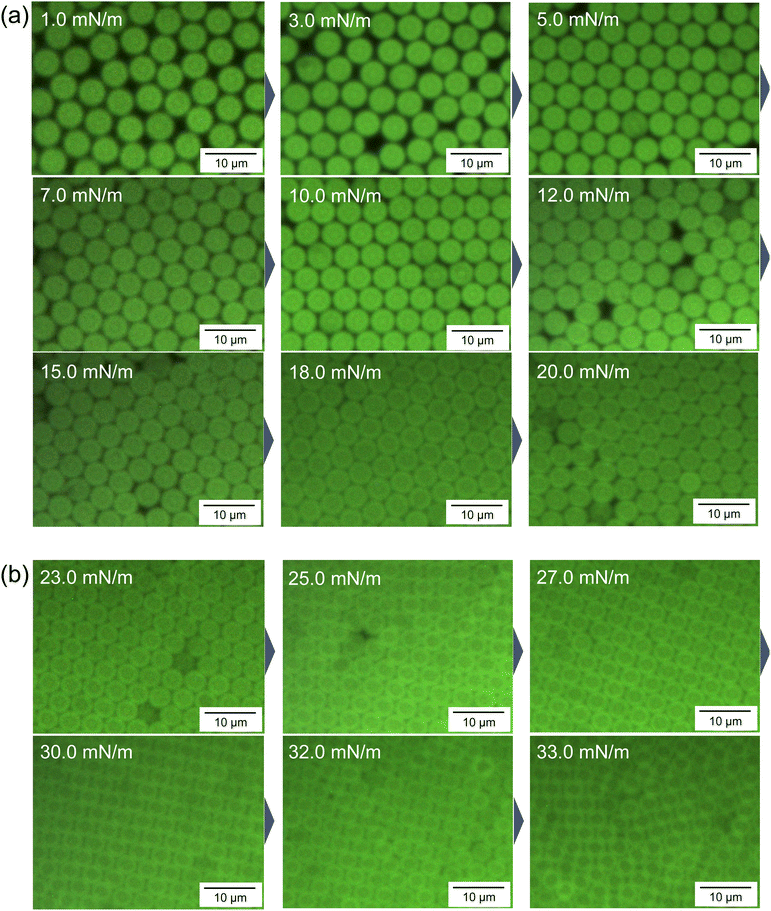 | ||
| Fig. 5 Representative fluorescence-microscopy images of the microgels adsorbed at the air/water interface during the compression of (a) 4.8 mg and (b) 9.6 mg of the microgels. These images were obtained with a high-magnification lens and trimmed. The full series of images at each π value are shown in Fig. S7 and S8 (ESI†). | ||
In this study, micron-sized microgels were used to evaluate individual microgel structures, however, high-magnification fluorescence-microscopy images showed that the structure of highly compressed microgels is still unclear at higher π values because the particle–particle interface cannot be distinguished (Fig. 5 and Fig. S4 and S8, ESI†). Therefore, non-labeled microgels were mixed with the labeled microgels to determine the structure of the single microgels (Fig. 6a). The fluorescence microscopy images of the mixture revealed the shape of each labeled microgel at the interface due to the presence of the invisible non-labeled microgels (Fig. 6b, c and Fig. S9 and S10, ESI†). The change of the compressed microgel shape was calculated quantitatively using the circularity parameter. The closer the shape is to a circle, the closer the value of the circularity parameter is to 1. The parameter during compression was found to be a constant value of ca. 0.9, i.e., very close to circular, until the π value reaches 26 mN m−1. At this point, the parameter then gradually decreased to ca. 0.7 as the π value further increased (26 ≤ π ≤ 34 mN m−1) (Fig. 6d). The measured DNND shows that the microgels were compressed and deformed at the air/water interface, even at lower π values (Fig. 4d). However, the shape of the single microgels was visually unchanged (e.g., 0 ≤ π ≤ 26 mN m−1) (Fig. 6). In our previous work, we mentioned that microgels that adsorb at the air/water interface are in contact with each other.42,49 Here, fluorescence-microscopy images showed that the invisible spaces between the neighboring microgels gradually disappear as the π value increased (Fig. 5). Hence, it should be noted that the circularity parameter results do not exclude the deformation of the invisible outer shell layer during compression (0 ≤ π ≤ 26 mN m−1), which is beyond the detection limit of fluorescence microscopy.
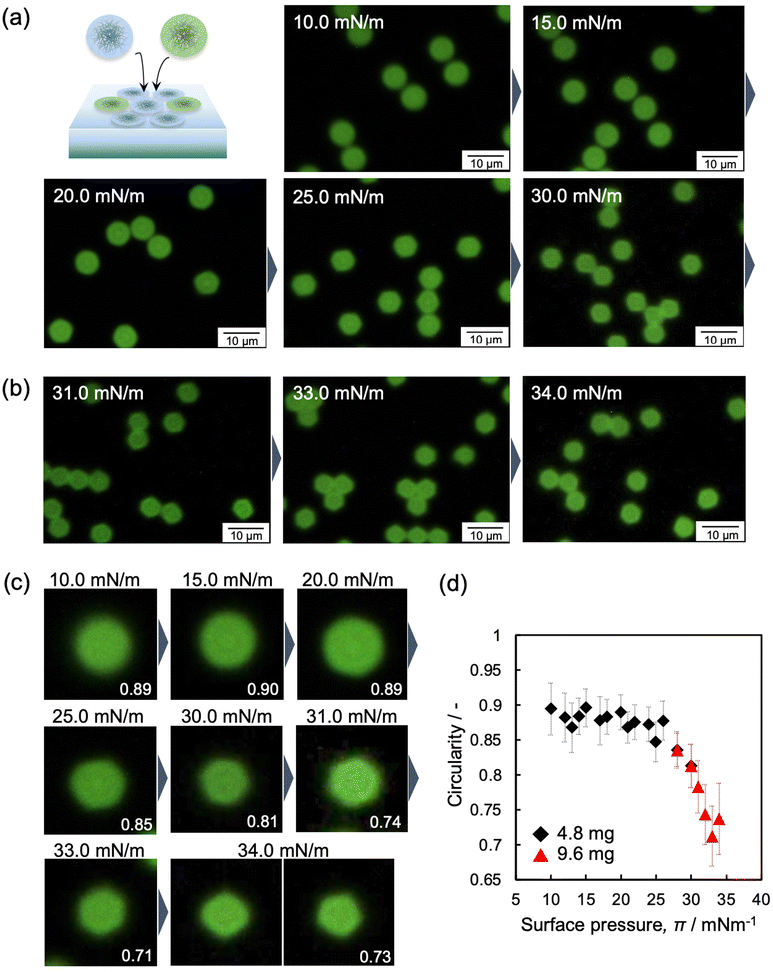 | ||
| Fig. 6 Fluorescence-microscopy images of the mixture of labelled and non-labelled microgels, where the total amount added was (a) 4.8 mg and (b) 9.6 mg, at the air/water interface during compression. These pictures were obtained with a high-magnification lens and trimmed. The full series of images at each π value are shown in Fig. S9 and S10 (ESI†). (d) Correlation between the circularity of the microgels and surface pressure, π. | ||
Furthermore, the highly compressed microgels adopt a hexagonal structure (Fig. 6c; >30 mN m−1), as evidenced by AFM images of the microgels arrays (Fig. S11, ESI†). It should be noted here that the microgels were observed under conditions where the observation range is limited (20 μm × 20 μm) after the transfer from the air/water interface to the solid substrate. In contrast to the highly crosslinked microgels,48 the array structures were not disrupted after transfer from the air/water interface to the solid substrate, as seen in the AFM image of the microgels on a solid substrate shown in Fig. 1c. It is also worth noting here that a fluorescence-microscopy image of the highly compressed microgels demonstrated the presence of pentagonal as well as hexagonal structures, at 34 mN m−1 (Fig. 6c), associating that this polygonal microgel structure is affected by a decrease in the crystallinity, Ψ6 (Fig. 4c).
To date, the visualization of the 2D hexagonal structure of compressed and deformed microgels at fluid interfaces has been conducted by using the interface of sessile dispersion droplets,49,53,54 different from the three-dimensionally compressed microgels in colloidal crystals.55,56 However, the results of such analyses have been limited to observation conditions where the compression could not be controlled, that is, the structural changes of the individual microgels/microgel arrays packed at the interface during compression has not been well understood. Moreover, it has been discussed in previous reports that, based on analysis via AFM/SEM after transfer to a solid substrate, compressed microgels at the fluid interface have clearly divided some regions where the microgel array structure changes.24 Such research cannot exclude artifacts from the drying process.47,57
In this study, directly monitoring the microgels adsorbed at the interface revealed the compression behavior of single microgels and microgel arrays as a function of the interfacial property, π (Scheme 2). While the microgel size, i.e., DNND, decreased continuously as a function of π, the crystallinity of the array structures and the microgel shapes in the low- and high-compression states were significantly different. Thus, to better understand the interfacial properties, the surface elasticity relating to the compression modulus, EG = −dπ/dLn![[thin space (1/6-em)]](https://www.rsc.org/images/entities/char_2009.gif) A, where A is the particle-specific area per weight,58,59 was calculated. The modulus increased at a π value between ca. 0 and 7 mN m−1 (Scheme 2), due to the increase in the density of the adsorbed polymer microgel segments at the air/water interface,59 thus seeming to be correlated with a decrease in DNND. It has previously been mentioned that at π values above the maximum compression-modulus value the decrease in the modulus is caused by the desorption of some segments. However, our results could not clearly confirm this because the observation could only be conducted from above. In addition, the modulus began to increase again at 23 mN m−1 with an associated decrease in the crystallinity, the hexagonal order parameter Ψ6, of the microgel arrays (Scheme 2), which suggests that the interpenetration between microgels, i.e., the low-density shell layers, causes an increase in the surface elasticity.
A, where A is the particle-specific area per weight,58,59 was calculated. The modulus increased at a π value between ca. 0 and 7 mN m−1 (Scheme 2), due to the increase in the density of the adsorbed polymer microgel segments at the air/water interface,59 thus seeming to be correlated with a decrease in DNND. It has previously been mentioned that at π values above the maximum compression-modulus value the decrease in the modulus is caused by the desorption of some segments. However, our results could not clearly confirm this because the observation could only be conducted from above. In addition, the modulus began to increase again at 23 mN m−1 with an associated decrease in the crystallinity, the hexagonal order parameter Ψ6, of the microgel arrays (Scheme 2), which suggests that the interpenetration between microgels, i.e., the low-density shell layers, causes an increase in the surface elasticity.
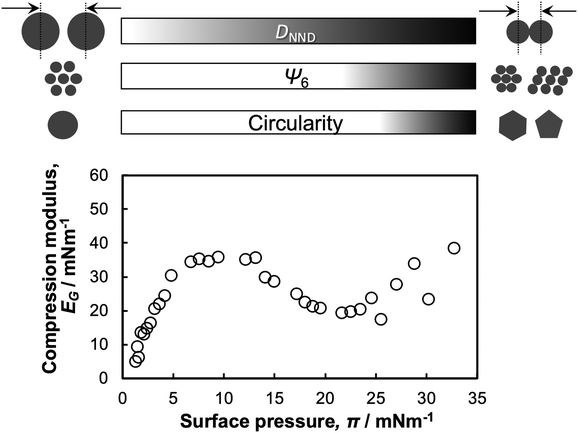 | ||
| Scheme 2 Schematic illustration of the correlation between the structure of the single microgels/microgel arrays at the air/water interface and the π–A isotherm during compression. | ||
The microgel compression process at the interface involves complex changes in the structures at the single microgel/microgel array scale which need to be understood. Even though it is also important to understand the three-dimensional structure of individual microgels deformed at interfaces by combining advanced observation technologies, e.g., neutron reflectivity measurements,34 SALS,35 and high-speed AFM,15,60–62 we strongly advocate the utility of our evaluation method, which allows the direct visualization of interfaces as well as monitoring of interfacial properties in real-time.
Our findings not only help to further understand the compression behavior of microgels at the interface, but will also lead to applications in materials that utilize interfaces, such as foams and emulsions, and to nano/microstructure construction techniques that tune the two- and three-dimensional structures of soft deformable particles.63,64
Conclusions
Large microgels (ca. 4 μm at the interface), which were synthesized via a modified precipitation-polymerization method, allowed correlating the structures of single microgels and microgel arrays adsorbed at the air/water interface to their π–A isotherms using a Langmuir trough equipped with a fluorescence microscope. The direct visualization of the microgel monolayer at the interface revealed that the microgel arrays became more homogeneous by the disappearance of voids and developed high colloidal crystallinity. In addition, high compression of the microgel arrays led to less ordered structures, which caused the single microgels to become polygonal. The presence of non-labeled microgels in the microscopy samples allowed us to clearly see that the structure of the labeled microgels changed from circular to polygonal during compression. The compression behavior of two-dimensional microgel arrays is a complex process that involves various factors such as deformability, charge density, and the core–shell structures. Thus, it has been difficult to clearly separate ranges where the structure of a single microgel/microgel array and their properties (or function) change. However, our new experimental techniques and findings are applicable to the creation of new functional microgel stabilizers with potential applications in bubbles and emulsions, and are expected to be helpful to further our understanding of the compression behavior of microgels.Author contributions
T. K. wrote the draft of the manuscript. H. M. and D. S. modified the manuscript. T. K. synthesized the microgels and evaluated the compression behavior of the microgels with the LB trough. H. M. contributed to some of the microgel-characterization experiments and discussion related to the entire paper. D. S. designed and supervised the overall study.Data availability
The data supporting this article have been included as part of the ESI.†Conflicts of interest
There are no conflicts to declare.Acknowledgements
D. S. gratefully acknowledges a CREST grant-in-aid (JPMJCR21L2) from the Japan Science and Technology Agency (JST). D. S. gratefully acknowledges the Iketani Science & Technology Foundation (0351083-A). D. S. gratefully acknowledges a Grant-in-Aid for Scientific Research (B) (24K01550) and H. M. gratefully acknowledges a Grant-in-Aid for Scientific Research (C) (22K05208) from the Japan Society for the Promotion of Science (JSPS).Notes and references
- B. P. Binks and R. Murakami, Nat. Mater., 2006, 5, 865 CrossRef CAS PubMed.
- J. Wu and G.-H. Ma, Small, 2016, 12, 4633 CrossRef CAS PubMed.
- J. Tang, P. J. Quinlan and K. C. Tam, Soft Matter, 2015, 11, 3512 RSC.
- S. Fujii, Polym. J., 2019, 51, 1081 CrossRef CAS.
- A. Sarkar, S. Zhang, M. Holmes and R. Ettelaie, Adv. Colloid Int. Sci., 2019, 263, 195 CrossRef CAS.
- D. Dedoverts, Q. Li, L. Leclercq, V. Nardello-Rataj, J. Leng, S. Zhao and M. Pera-Titus, Angew. Chem., Int. Ed., 2022, 61, e202107537 CrossRef.
- R. Pelton, Adv. Colloid Interface Sci., 2000, 85, 1 CrossRef CAS.
- S. Nayak and L. A. Lyon, Angew. Chem., Int. Ed., 2005, 44, 7686 CrossRef CAS.
- M. Ballauff and Y. Lu, Polymer, 2007, 48, 1815 CrossRef CAS.
- F. A. Plamper and W. Richtering, Acc. Chem. Res., 2017, 50, 131 CrossRef CAS.
- D. Suzuki, K. Horigome, T. Kureha, S. Matsui and T. Watanabe, Polym. J., 2017, 49, 695 CrossRef CAS.
- M. Karg, A. Pich, T. Hellweg, T. Hoare, L. A. Lyon, J. J. Crassous, D. Suzuki, R. A. Gumerov, S. Schneider, I. I. Potemkin and W. Richtering, Langmuir, 2019, 35, 6231 CrossRef CAS.
- Y. Nishizawa, K. Honda and D. Suzuki, Chem. Lett., 2021, 50, 1226 CrossRef CAS.
- T. Tanaka and D. J. Fillmore, J. Chem. Phys., 1979, 70, 1214 CrossRef CAS.
- Y. Nishizawa, S. Matsui, K. Urayama, T. Kureha, M. Shibayama, T. Uchihashi and D. Suzuki, Angew. Chem., Int. Ed., 2019, 58, 8809 CrossRef CAS.
- T. Ngai, S. H. Behrens and H. Auweter, Chem. Commun., 2005, 331 RSC.
- D. Suzuki, S. Tsuji and H. Kawaguchi, J. Am. Chem. Soc., 2007, 26, 8088 CrossRef.
- A. Maestro, D. Jones, C. Sánchez de Rojas Candela, E. Guzman, M. H. G. Duits and P. Cicuta, Langmuir, 2018, 34, 7067 CrossRef CAS PubMed.
- T. Watanabe, M. Takizawa, H. Jiang, T. Ngai and D. Suzuki, Chem. Commun., 2019, 55, 5990 RSC.
- M.-H. Kwok, G. Sun and T. Ngai, Langmuir, 2019, 35, 4205 CrossRef CAS PubMed.
- M. Kühnhammer, K. Gräff, E. Loran, O. Soltwedel, O. Löhmann, H. Frielinghaus and R. V. Klitzing, Soft Matter, 2022, 18, 9249 RSC.
- L. Waldmann, D. Nguyenc, S. Arbault, T. Nicolai, L Benyahia and V. Ravaine, J. Colloid Interface Sci., 2024, 653, 581 CrossRef CAS PubMed.
- R. H. Pelton and P. Chibante, Colloids Surf., 1986, 20, 247 CrossRef CAS.
- M. Rey, M. A. Fernandez-Rodriguez, M. Karg, L. Isa and N. Vogel, Acc. Chem. Res., 2020, 53, 414 CrossRef CAS.
- D. Feller and M. Karg, Soft Matter, 2022, 18, 6301 RSC.
- W. Richtering, Langmuir, 2012, 28, 17218 CrossRef CAS PubMed.
- M. A. Fernandez-Rodriguez, A. Martín-Molina and J. Maldonado-Valderrama, Adv. Colloid Interface Sci., 2021, 288, 102350 CrossRef CAS.
- S. Stock and R. V. Klitzing, Curr. Opin. Colloid Interface Sci., 2022, 58, 101561 CrossRef CAS.
- J. Zhang and R. Pelton, Langmuir, 1999, 15, 8032 CrossRef CAS.
- M. Destribats, V. Lapeyre, M. Wolfs, E. Sellier, F. Leal-Calderon, V. Ravaine and V. Schmitt, Soft Matter, 2011, 7, 7689 RSC.
- K. Geisel, K. Henzler, P. Guttmann and W. Richtering, Langmuir, 2015, 31, 83 CrossRef CAS PubMed.
- M.-H. Kwok and T. Ngai, J. Colloid Interface Sci., 2016, 461, 409 CrossRef CAS PubMed.
- N. V. Bushuev, R. A. Gumerov, S. Bochenek, A. Pich, W. Richtering and I. I. Potemkin, ACS Appl. Mater. Interfaces, 2020, 12, 19903 CrossRef CAS.
- S. Bochenek, F. Camerin, E. Zaccarelli, A. Maestro, M. M. Schmidt, W. Richtering and A. Scotti, Nat. Commun., 2022, 13, 3744 CrossRef CAS PubMed.
- K. Kuk, V. Abgarjan, L. Gregel, Y. Zhou, V. C. Fadanelli, I. Buttinoni and M. Karg, Soft Matter, 2023, 19, 175 RSC.
- F. Grillo, M. A. Fernandez-Rodriguez, M. Antonopoulou, D. Gerber and L. Isa, Nature, 2020, 582, 219 CrossRef CAS PubMed.
- Y. Gerelli, F. Camerin, S. Bochenek, M. M. Schmidt, A. Maestro, W. Richtering, E. Zaccarelli and A. Scotti, Soft Matter, 2024, 20, 3653 RSC.
- M. Rey, X. Hou, J. S. J. Tang and N. Vogel, Soft Matter, 2017, 13, 8717 RSC.
- Y. Yang, J. Maldonado-Valderrama and A. Martín-Molina, J. Mol. Liq., 2020, 303, 112678 CrossRef CAS.
- K. Horigome and D. Suzuki, Langmuir, 2012, 28, 12962 CrossRef CAS.
- D. Suzuki and K. Horigome, J. Phys. Chem. B, 2013, 117, 9073 CrossRef CAS.
- M. Takizawa, Y. Sazuka, K. Horigome, Y. Sakurai, S. Matsui, H. Minato, T. Kureha and D. Suzuki, Langmuir, 2018, 34, 4515 CrossRef CAS.
- H. Minato, M. Takizawa, S. Hiroshige and D. Suzuki, Langmuir, 2019, 35, 10412 CrossRef CAS PubMed.
- K. Honda, Y. Sazuka, K. Iizuka, S. Matsui, T. Uchihashi, T. Kureha, M. Shibayama, T. Watanabe and D. Suzuki, Angew. Chem., Int. Ed., 2019, 58, 7294 CrossRef CAS PubMed.
- Y. Sasaki, S. Hiroshige, M. Takizawa, Y. Nishizawa, T. Uchihashi, H. Minato and D. Suzuki, RSC Adv., 2021, 11, 14562 RSC.
- H. Minato, Y. Sasaki, K. Honda, T. Watanabe and D. Suzuki, Adv. Mater. Interfaces, 2022, 9, 2200879 CrossRef CAS.
- D. Suzuki, Langmuir, 2023, 39, 7525 CrossRef CAS.
- T. Kawamoto, K. Yanagi, Y. Nishizawa, H. Minato and D. Suzuki, Chem. Commun., 2023, 59, 13289 RSC.
- H. Minato, M. Murai, T. Watanabe, S. Matsui, M. Takizawa, T. Kureha and D. Suzuki, Chem. Commun., 2018, 54, 932 RSC.
- K. Urayama, T. Saeki, S. Cong, S. Uratani, T. Takigawa, M. Murai and D. Suzuki, Soft Matter, 2014, 10, 9486 RSC.
- S. Ciarella, M. Rey, J. Harrer, N. Holstein, M. Ickler, H. Löwen, N. Vogel and L. M. C. Janssen, Langmuir, 2021, 37, 5364 CrossRef CAS PubMed.
- J. Menath, J. Eatson, R. Brilmayer, A. Andrieu-Brunsenc, D. M. A. Buzza and N. Vogel, Proc. Natl. Acad. Sci. U. S. A., 2021, 52, e2113394118 CrossRef PubMed.
- J. Vialetto, S. N. Ramakrishna and L. Isa, Sci. Adv., 2022, 8, 45 Search PubMed.
- J. Vialetto, F. Camerin, S. N. Ramakrishna, E. Zaccarelli and L. Isa, Adv. Sci., 2023, 10, 2303404 CrossRef CAS.
- G. M. Conley, P. Aebischer, S. Nöjd, P. Schurtenberger and F. Scheffold, Sci. Adv., 2017, 3, e1700969 CrossRef PubMed.
- G. M. Conley, C. Zhang, P. Aebischer, J. L. Harden and F. Scheffold, Nat. Commun., 2019, 10, 2436 CrossRef PubMed.
- M. Rey, T. Yu, K. Bley, K. Landfester, D. M. A. Buzza and N. Vogel, Langmuir, 2018, 34, 9990 CrossRef CAS PubMed.
- F. Pinaud, K. Geisel, P. Masse, B. Catargi, L. Isa, W. Richtering, V. Ravaine and V. Schmitt, Soft Matter, 2014, 10, 6963 RSC.
- C. Picard, P. Garrigue, M. C. Tatry, V. Lapeyre, S. Ravaine, V. Schmitt and V. Ravaine, Langmuir, 2017, 33, 7968 CrossRef CAS.
- H. Minato, Y. Nishizawa, T. Uchihashi and D. Suzuki, Polym. J., 2020, 52, 1137 CrossRef CAS.
- Y. Nishizawa, H. Minato, T. Inui, I. Saito, T. Kureha, M. Shibayama, T. Uchihashi and D. Suzuki, RSC Adv., 2021, 11, 13130 RSC.
- Y. Nishizawa, H. Yokoi, T. Uchihashi and D. Suzuki, Soft Matter, 2023, 19, 5068 RSC.
- T. Watanabe, H. Minato, Y. Sasaki, S. Hiroshige, H. Suzuki, N. Matsuki, K. Sano, T. Wakiya, Y. Nishizawa, T. Uchihashi, M. Shibayama, T. Takata, T. Kureha and D. Suzuki, Green Chem., 2023, 25, 3418 RSC.
- Y. Sasaki, Y. Nishizawa, T. Watanabe, T. Kureha, K. Uenishi, K. Nakazono, T. Takata and D. Suzuki, Langmuir, 2023, 39, 9262 CrossRef CAS.
Footnote |
| † Electronic supplementary information (ESI) available. See DOI: https://doi.org/10.1039/d4sm00640b |
| This journal is © The Royal Society of Chemistry 2024 |

