 Open Access Article
Effects of structural variation in electrospray systems on spray characteristics
Ji Yeop
Kim
,
Sang ji
Lee
,
Mun Hee
Lee
,
Jun Yeop
Kim
and
Jung Goo
Hong
 *
*
School of Mechanical Engineering, Kyungpook National University, Bukgu, Daegu 41566, Republic of Korea. E-mail: jghong70@knu.ac.kr
First published on 12th August 2024
Abstract
Electrospraying is a method of atomizing fluids using a high voltage potential difference. Since the atomization of electrostatic atomization does not directly charge the nozzle but only uses the potential difference, various equipment structures are possible. In the case of this study, 12 different equipment structures of nozzle, ring electrode, and substrate were configured, and data on atomization characteristics of electrospray, such as spray modes applied voltage, coating area, coating current, spray velocity, and factors used in industrial processes, were verified. Data are provided for the generation process using uniform and continuous electrospray.
1. Introduction
Electrospray is a method of atomising fluids using high voltage as an auxiliary spray mechanism. Unlike conventional spray systems using pressure and auxiliary air, it can continuously produce fine, uniform droplets.1,2As electrospray is performed using a potential difference (high voltage), the system configuration is simple. This enables spraying experiments to be conducted under various conditions in terms of physical properties, including high viscosity. Thus, the electrospray configuration can be extended to other spray systems as well.3 Although electrospray is strongly affected by temperature and humidity, it requires less energy than other spray systems because the spraying is performed under low flow conditions and primarily at room temperature and atmospheric pressure.4 Since an electric field is formed during the spray, the size and movement of the droplets can be controlled by adjusting the electric field through the external environment, which allows the system to be highly responsive.5
Electrospray systems are used in diverse industrial applications due to their ability to continuously produce uniform droplets.6 These applications include drugs (microencapsulated biological cells7), combustion, propellants (small-scale combustors8,9), coatings (micro-structured films10 and nano-polymer films11), textile processing (alternating current electrospinning12), semiconductors (electrode patterning,13 quantum dot films,14 and displays15), secondary batteries (nanostructure lamination,16 lithium–sulphur batteries17), fine dust reduction,18 biomolecular mass spectrometry,19 ion feeders,20 electro hydrodynamic printing (3D structure printing,21 Ag patterning,22 and tribogenerators23), face-to-face cooling,24 aerosols (silica nanoparticle production25), and powdered food production.26
Several variable conditions affect the spray mode and droplet characteristics in electrospray. These can be divided into two main categories: fluid properties and experimental parameters. Fluid properties include density, viscosity, conductivity, permittivity, and surface tension. Most studies have experimentally investigated the effect of spray conditions on a single property, such as variations in mixture properties due to stirring27 and the effects of high viscosity and high conductivity.28 Experimental parameters include nozzle-to-substrate distance (NTS), nozzle diameter, applied voltage, and flow rate.29–31 Because electrospray involves different spray modes depending on the applied voltage (potential difference) and flow rate, most studies have focused on identifying the spray modes32 and droplet characteristics,33 providing limited data on other experimental parameters.30
However, electrospray systems can adopt various equipment configurations depending on the application requirements. These include multiple-array structures,34 substrate-free structures,35,36 structures with different nozzle geometries (coaxial or two-fluid),37 structures with different substrate geometries,38 structures with rings,39–41 multi-ring structures,42,43 and cross-flow.44 While the characteristics of such electrospray configurations have been studied individually, comparative analysis of structural variation has focused only on the presence and absence of rings.45 In addition, the spray mode and droplet characteristics represent basic data for electrospray, while droplet size and distribution can be analysed to elucidate the mass transfer, chemical reactions, and chemical characterisation in various applications.46 Based on previous studies, the increasing use of electrospray across industries suggests that equipment structure diversification and characterization are necessary to ensure system scalability. In particular, compared to other atomization systems, electrostatic spraying exhibits different atomization characteristics under different equipment structures. Furthermore, despite the recent expansion of electrostatic atomization applications, it has structurally limited atomization conditions.47 Experiments were conducted in this study to evaluate the effects of applied voltage, droplet size, coating area, current, and velocity on the spray mode with variations in equipment structure, namely the presence or absence of a ring, the location of the applied voltage charge (positive or negative pole), the presence or absence of a substrate, and the presence or absence of applied voltage charge. The data obtained on electrospray characteristics can be used to determine the equipment structures for different industrial applications.
2. Method
2.1 Materials
The working fluid used in the experiment was ethanol (94%), which is non-toxic and has a relatively high viscosity compared with other organic compounds with similar molecular weights. Its properties are listed in Table 1. Ethanol is an organic, polar, and quantum solvent. Due to its high dielectric constant and hydroxy group (–OH), it is highly hydrophilic.48| Solution | Density (kg m−3) | Conductivity (μS m−1) | Viscosity (mPa s) | Surface tension (mN m−1) | Dielectric constant |
|---|---|---|---|---|---|
| Ethanol | 789 | 0.13 | 1.1 | 22.32 | 16.2 |
In addition, ethanol is a versatile solvent that can be mixed with various other organic solvents, including glycerol and toluene.48 These properties allow ethanol to dissolve polar, hydrophilic, nonpolar, and hydrophobic compounds. Therefore, it is the most commonly used solvent for electrospray in industrial applications that often utilise mixed solutions with polymers. Ethanol was chosen as the working fluid also because of its low surface tension compared with distilled water, which allows for better spray patterns.
2.2 Experimental apparatus
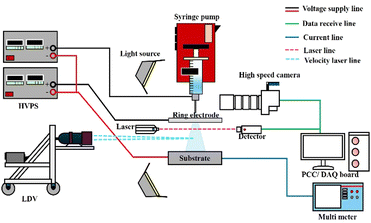
Fig. 1 shows the experimental setup along with the corresponding parameters. The apparatus consisted of three main parts: fluid supply, high-voltage application, and instrumentation. For the fluid supply, a syringe pump (NEW ERA, NE-1000) was used to maintain a flow rate of 1 mL h−1 to ensure that the spray pattern would not change. The smallest-capacity syringe (Norm-ject®, 1 ml) available was used to facilitate flow control, along with a stainless nozzle (Nano NC, 17G). A high-voltage power supply (HVPS; Korean switching, 30 kV, 15 mA) was used to electrify the nozzle, ring, and substrate, with a voltage of up to 30 kV. The equipment structure that yielded the cone jet spray mode was selected for the experimental analysis.In addition, the HVPS was used to observe the spray modes up to the corona discharge region, where the air insulation breaks down. With regard to the instrumentation, a high-speed camera (Phantom camera, VEO E310L) was used to capture the spray modes with LED light sources.6
The spray mode was analysed in real time using the Phantom Camera Control (PCC) software program. The coating area was stained red with Rose Bengal (Alfa Aesar) for solution analysis. Specifically, under each condition, the substrate was sprayed in a stable cone jet mode for 1 min. Then, the coating area and characteristics were identified using an optical microscope (Nikon, Eclipse LV150L). Finally, the images, such as those of the coating area, were analysed using PCC. The Sauter mean diameter (SMD) was determined using the line-of-sight method (Malvern/MLXA-A12-635-5); specifically, the size of the droplets passing between the laser and the detector was measured in real time based on the degree of diffraction. The data were calculated as the average from 30 experiments.49,50 The SMD was measured at an NTS of 35 mm point, and the data were acquired in real time on the computer's data acquisition (DAQ) board. The current was recorded using a multi meter (Tektronix, DMM6500), and the data were monitored in real time using customised software to detect the current values and noise over time.51
A laser Doppler velocimeter (LDV; SPECTRA-PHYSICS LASER, 277-604, 177-G0232) was used to measure the spray velocity, and a velocity measurement program (DANTEC DYNAMICS, BSA-P60) was used to set the experimental conditions and range. At least 2000 data points were acquired to average the velocity. The measurement position was adjusted using a three-axis feeding device. The velocity was measured at an NTS of 40 mm. Furthermore, the SMD and velocity were measured simultaneously at the distance closest to the substrate (40 mm) to confirm the deposition rate. The aluminium substrate (50 × 50 mm) was directly machined into a circular shape and charged for the experiment. The heights of the substrate and ring electrode were adjusted using support jacks (Labkom, KA11-95) to vary the experimental parameters and equipment structure. The heights were measured using electronic vernier callipers (SHAHE, 5110-300). The specifications of the experimental devices are presented in Table 2, with specific information about the parameters, measurements, models, and ranges with resolutions.
| Parameter | Measurement | Model | Range (resolution) |
|---|---|---|---|
| Flow rate | Syringe pump | NE-1000 | 5.119 μL h−1–372.5 mL h−1 (0.001 μL h−1) |
| Applied voltage | DC power supply | B150 | 0–30 kV (0.01 kV) |
| Ring diameter | Electronic vernier callipers | 5110-300 | 10–40 mm (0.01 mm) |
| Length [nozzle-to-ring (NTR), NTS] | Electronic vernier callipers | 5110-300 | 20–45 mm (0.01 mm) |
| SMD and SMD standard deviation | Simple droplet sizing system | MLXA-A12-635-5 | 8–450 μm (0.1 μm) |
| Current | Multi meter | DMM6500 | 10 pA–10.1 A (10 pA) |
| Coating area | Optical microscope | LV150L | 10× −100× |
| Velocity | LDV | SPECTRA-PHYSICS LASER (277-604,177-G0232) | 0–10 m s−1 (0.01 m s−1) |
2.3 Experimental conditions
Table 3 lists the experimental conditions used in this study. The flow rate was fixed at 1 mL h−1 because the spray mode changes with variations in flow rate. The inner diameter of the ring was set as 10 and 40 mm to compare the spray characteristics with and without the ring and thereby confirm the dependence of the spray characteristics on the ring parameters. For the same reason, voltages 0 and 7 kV were applied to the ring. Moreover, the distance between the nozzle and the ring (NTR) was set as 20 mm, which corresponds to the largest NTS (45 mm) at which the spray image was clearly visible and was unaffected by the SMD measurements. This is because a larger NTR ensures better droplet size reduction and distribution. The outer diameter of the nozzle was set to 1.47 mm as this is the closest to the diameter of 17G nozzles (1 mm). Additionally, 18 voltages in the range of 3.36–17.29 kV were applied to the nozzle, which yielded a stable cone jet spray mode. Since electrospray is dominantly affected by temperature and humidity, the temperature and relative humidity were set to normal values of 25 °C and 40 ± 10%, respectively, and were checked frequently.| Parameter | Values |
|---|---|
| Flow rate (mL h−1) | 1 |
| Ring inner diameter (mm) | 10, 40 |
| Applied ring voltage (kV) | 0, 7 |
| NTR (mm) | 20 |
| NTS (mm) | 45 |
| Nozzle outer diameter (mm) | 1.47 |
| Applied nozzle voltage (kV) | 3.36–17.29 |
| Ambient temperature (°C) | 25 |
| Relative humidity (%) | 40 ± 10 |
2.4 Equipment structures
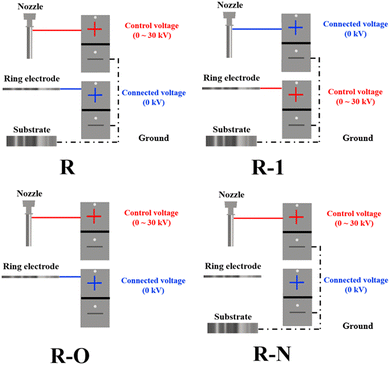
Fig. 2 summarises the equipment configurations listed in Table 4. The voltages applied to the setup are mainly categorised into the control voltage (+), connected voltage (+), and ground (−), according to the charge of the positive and negative electrodes of the HVPS and whether the applied voltage is regulated or not. The control voltage (+) is the voltage applied to the positive electrode, with the supply being regulated. The connected voltage (+) denotes the voltage applied only to the positive electrode without any regulating mechanism. The ground (−) refers to the voltage applied to the negative electrode. In Fig. 2, the control voltage is coloured red, the connected voltage is coloured blue, and the ground is coloured black.| Configuration | Substrate | Ring | Control voltage (+) | Connected voltage (+) | Ground (−) |
|---|---|---|---|---|---|
| S | Yes | No | Nozzle | Not connected | Substrate |
| S-1 | Yes | No | Substrate | Not connected | Nozzle |
| S-2 | Yes | No | Nozzle | Not connected | Not connected |
| R | Yes | 40 mm | Nozzle | Ring (0 kV) | Substrate |
| R-1 | Yes | 40 mm | Ring | Nozzle (0 kV) | Substrate |
| R-O | No | 40 mm | Nozzle | Ring (0 kV) | Not connected |
| R-N | Yes | 40 mm | Nozzle | Not connected | Ring |
| R-N-1 | Yes | 40 mm | Ring | Not connected | Nozzle |
| R-N-O | No | 40 mm | Nozzle | Not connected | Ring |
| R-N-O-1 | No | 40 mm | Ring | Not connected | Nozzle |
| R-V | Yes | 40 mm | Nozzle | Ring (7 kV) | Substrate |
| R-R | Yes | 10 mm | Nozzle | Ring (0 kV) | Substrate |
Table 4 shows the experimental conditions corresponding to the structures of the experimental setup. In this regard, 12 conditions were employed, and they are designated according to the structure. The three baseline conditions are denoted by S, R, and R-N. S represents the most commonly used configuration in electrospray, with a nozzle and substrate, while R represents the addition of a ring to the S configuration. The R-N configuration represents the connected voltage not being charged in the R configuration. Each baseline configuration had five variants—1, 2, O, V, and R. Among these, 1 denotes the structure with the charge position changed, and 2 refers to the case where the ground line is not charged. O represents the configuration without a substrate. V represents the configuration with a 7 kV voltage applied to the ring, while R denotes the configuration where the ring diameter was 10 mm.
3. Results and discussion
3.1 Spray image
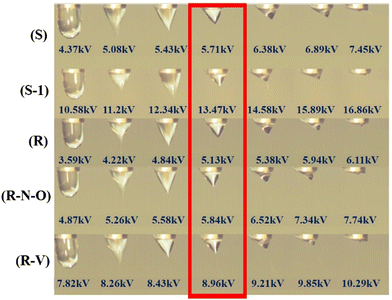
Fig. 3 shows the spray mode as a function of the applied voltage for five different equipment configurations. The spray mode can be categorised into three main types with increasing applied voltage: dripping, cone jet, and multi-jet. The experiment was conducted in the cone jet mode, which is the most stable and continuous mode in electrospray. The criterion for selecting the applied voltage was that the cone's half-angle at the nozzle tip had to be 49.3°, which represents the most stable spray condition with a consistent spray pattern. Accordingly, the required applied voltages for the S, S-1, R, R-N-O, and R-R conditions were 5.71 kV, 13.47 kV, 5.13 kV, 5.84 kV, and 8.96 kV, respectively. The different configurations yielded similar spray modes despite the differences in the applied voltage. The applied voltages for all the experimental conditions are listed in Table 5.| Configuration | Voltage (kV) | Configuration | Voltage (kV) |
|---|---|---|---|
| S | 5.71 | R-N | 5.35 |
| S-1 | 13.47 | R-N-1 | 8.51 |
| S-2 | 7.29 | R-N-O | 5.84 |
| R | 5.13 | R-N-O-1 | 8.94 |
| R-1 | 6.78 | R-V | 8.96 |
| R-O | 4.6 | R-R | 4.00 |
3.2 Coating area
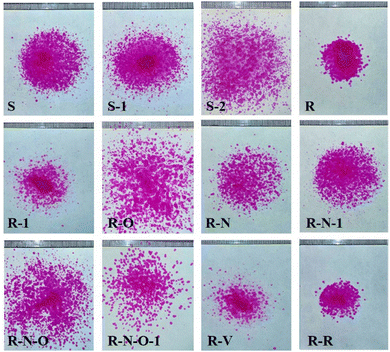
Fig. 4 presents the coating area corresponding to each configuration listed in Table 4. The voltages listed in Table 5 were applied under each condition to achieve a stable cone jet mode. Between the S and the R configurations, the latter yielded a smaller coating area due to the electric field generated by the ring.Further, among the R, R-O, R-N, and R-N-O configurations, the coating area was smaller with R and R-N. This is because the substrate is charged at the negative pole in these configurations, which causes the droplets to be surrounded by the electric field on the substrate.
Unlike in the S, R, and R-N configurations, where the nozzle was charged, the voltage was applied to the substrate in S-1 and to the ring in R-1 and R-N-1. When a high voltage is applied to the ring or substrate, the electric field is directed opposite to the spray; thus, instead of covering the large area over the substrate and ring, the electric field covers only the narrow area under the nozzle, which results in a relatively large coating area. However, the spray intensity at the centre was higher with the S-1, R-1, and R-N-1 configurations than with the S, R, and R-N configurations, respectively.
In the S-2 configuration, the substrate was present, but the ground line was not connected, while in the R-O and R-N-O configurations, the substrate was absent. In these cases, the coating area is considered to have been widened because an electric field acting in the direction of the substrate was not formed. The coating area with R-N-1 (with substrate) was about 1.51 times smaller than that with R-N-O (no substrate, charging positions reversed).
In addition, the coating area with R-1 was about 2.27 times smaller than that with R-N-O-1; this is because R-1 included the substrate and had a different ground line position.
The configuration with the smallest coating area was R-V, where a high voltage was applied to the ring. To achieve the cone jet spray mode, a high applied voltage had to be applied to the nozzle as well. Thus, a strong electric field was formed between the nozzle and the ring, which narrowed the coating area. In R-R, where the ring diameter was small, the coating area was narrowed due to the strong electric field from the inner diameter of the ring. The coating area for each equipment configuration is shown in Table 6.
| Configuration | Coating area (mm2) | Configuration | Coating area (mm2) |
|---|---|---|---|
| S | 978.28 | R-N | 1046.99 |
| S-1 | 1170.73 | R-N-1 | 1050.85 |
| S-2 | 1811.43 | R-N-O | 1587.57 |
| R | 682.22 | R-N-O-1 | 1248.85 |
| R-1 | 551.24 | R-V | 417.37 |
| R-O | 1912.75 | R-R | 453.33 |
These results show that the largest coating area was achieved with R-O, in which the substrate was absent, the voltage was applied to the nozzle, and the ring was grounded. The presence or absence of substrate had the most significant effect on the coating area, with the ground line position having the smallest effect.
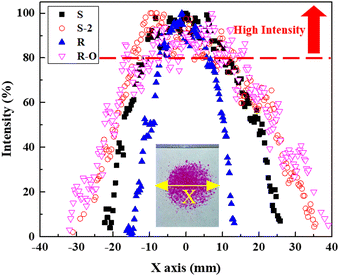
Fig. 5 presents a graph comparing the droplet distributions of the S, S-2, R, and R-O configurations. The most sprayed area for each configuration is represented by a 100% intensity, and the intensity distribution along the X-axis is compared among the aforementioned configurations.
A threshold of 80% was selected to define high intensities. Accordingly, the high-intensity areas were observed to be those influenced the most by the configuration parameters and electric field. Between the S and R configurations, the coating area was narrower with the latter due to the electric field generated by the ring; this is corroborated by the difference in spray intensities along the X-axis.
With the R-O and S-2 configurations, which yielded the largest coating areas, the increase in coating area relative to the R and S configurations was achieved due to the lack of a substrate and the uncharged structure, respectively. Additionally, in the high-intensity coating areas (>80%), the intensity difference between the respective configurations was small, resulting in a small difference in coating concentration as well. This is considered to be due to the substrate being grounded in S and R, which narrows the coating area and leads to a high coating concentration due to the electrical attraction acting on the substrate. Thus, an uncharged substrate is required for achieving a uniform and large coating area, whereas a ring is necessary for ensuring a highly concentrated coating over a small area.
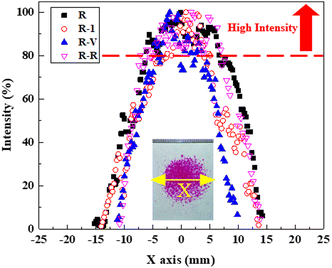
Fig. 6 presents the coating area distributions of R, R-1, R-V, and R-R. This graph shows that R-R was the configuration with the largest proportion of intensities above 80%, whereas R was the configuration with the widest coverage. Compared with those in Fig. 5, the overall coating area was narrower while the difference in coating concentration was affected much more by the parameters. Between R and R-1, the latter had a smaller total coating area; however, the higher intensities (>80%) were uniformly distributed over a larger area, and variation in concentration was lower.
With R-1, the electric field generated by the ring did not act only in the spray (downward) direction; thus, the coating area was wider than that with R. Moreover, relative to R, R-R provided a smaller overall coating area due to its smaller ring diameter, and it had a larger high-intensity area as well. The coating area is believed to have been narrowed by the electric field generated by the smaller ring, and the wider high-intensity area is attributed to the electric field between the ring and substrate. By contrast, R-V provided the narrowest coating area with the spray concentrated in the centre due to the strong electric field formed between the ring and the nozzle; however, the intensities were distributed more widely along the X-axis. Hence, for uniform coating over large areas, as required in continuous coating or film production, a smaller ring diameter (i.e., R-R) would be preferable, whereas for applications requiring highly concentrated coatings, a higher applied voltage (i.e., R-V) would be desirable.
3.3 Voltage–current
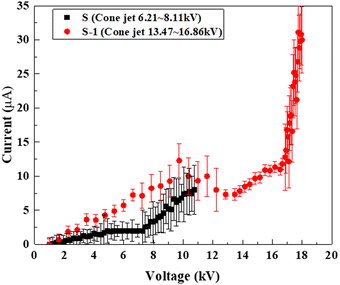
Fig. 7 presents the real-time current measured between the nozzle and the substrate as a function of the applied voltage for the S and S-1 configurations. Compared with S, S-1 required a higher applied voltage over a wider range. Because the voltage was applied to the substrate in S-1 and the charge density was lower than that in S, a higher voltage was required to achieve the cone jet spray mode in S-1.The noise increased with the current as the spray mode transitioned from dripping to micro-dripping. This can be explained as follows: In the dripping mode, the current increased with the applied voltage because no droplets were sprayed; however, in the micro-dripping mode, droplets were sprayed at a high frequency by the electric field, and thus, the noise was relatively large compared with that in the dripping mode. In the cone jet mode, the current remained constant with an increase in applied voltage; hence, less noise was generated than in the other spray modes. The continuous and uniform spray in the cone jet mode is believed to result in low noise and a constant current because the current (amount of charge) carried by the droplets is constant. After the multi-jet mode, the current increased rapidly with the applied voltage. This is due to the instability of the spray pattern, which resulted in uneven droplet size and considerable noise.
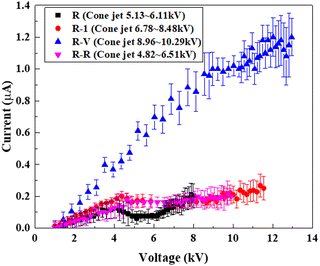
Fig. 8 shows the current measured from the R, R-1, R-V, and R-R configurations. As discussed regarding Fig. 7, the current in the cone jet mode remained constant even with an increase in the applied voltage, and minimal noise was generated.
The current was the lowest when the control voltage was applied to the ring and the connected voltage to the nozzle, i.e., the R configuration. The overall current values are smaller than those in Fig. 7, which pertains to structures without a ring. As observed from the spray modes corresponding to the applied voltages in Fig. 3, since the ring acted as a ground, the droplets lost a large amount of charge while passing through the ring; as the current was measured at the ground, after the droplet passed through the ring, it was lower than for the configurations in Fig. 7. The current in R-1 was higher than that in R because of an electric field formed between the ring and the substrate due to the application of the control voltage to the ring in the former.
In R-R, the ring diameter was smaller than that in R, and hence, the electric field was stronger; however, the difference was insignificant. Fig. 8 shows that the largest current was measured in R-V, which is due to the voltage of 7 kV applied to the ring. Thus, applying a high voltage to the nozzle and ring to achieve the cone jet spray mode generates a higher current than the configurations, even though the ring acts as a ground and resistor.
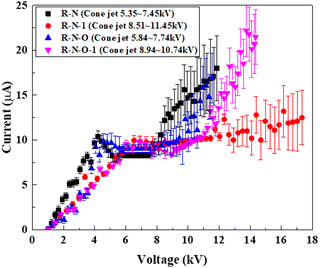
Fig. 9 shows the current measured for R-N, R-N-1, R-N-O, and R-N-O-1. The current values are observed to be higher than those in Fig. 8 due to the differences in equipment configuration (charging position and presence or absence of the substrate). As the current was measured between the ring and the nozzle, higher values were recorded relative to Fig. 7 due to the 20 mm shorter measurement distance. The variation in current with spray mode was similar to that observed in Fig. 7 and 8, i.e., the current remained constant with increasing voltage in the cone jet mode, and the noise was minimal.
In R-N and R-N-O, where the nozzle was charged, the current increased at a significantly higher rate with the applied voltage than in R-N-1 and R-N-O-1, where the ring was charged. Moreover, in R-N-O and R-N-O-1, where the substrate was absent, the current increase rate after the cone jet mode was larger. Since the currents in S and R-N are nearly 50 times larger in the cone jet mode compared with the corresponding values in Fig. 8, these configurations would be useful for the production of semiconductors and other electronic materials, which require large currents. However, R could be useful in applications requiring small currents.
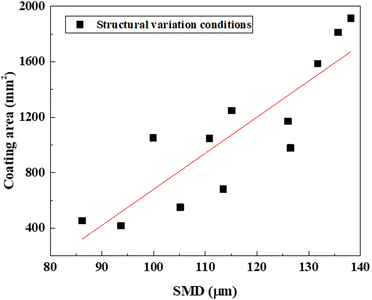
3.4 Coating area – SMD
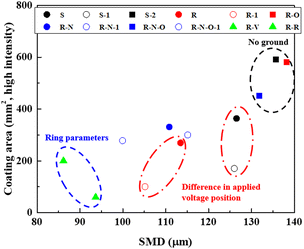
Fig. 10 shows the SMD data according to coating area to confirm the correlation between coating area and droplet size. The droplet size was compared according to the coating area of the 12 conditions used in the experiment, and it was confirmed that the SMD increased linearly with the increase of the coating area. In addition, the SMD according to the equipment structure was R-O, and R-N-O (no substrate) had large SMDs, as did S-2 (uncharged substrate). This suggests that an uncharged substrate, which experiences no attraction force, results in a large SMD and thus a large coating area. Additionally, R-V and R-R yielded a small coating area and small SMD due to the strong electric field created by the applied voltage and the smaller ring, respectively; this is consistent with the results in Fig. 6.Fig. 11 presents a graph of the high-intensity coating area as a function of SMD. Similar to the trend in Fig. 10, the high-intensity coating area increased with the SMD. However, the high-intensity coating area (>80% intensity) exhibited a different trend from the normal coating area (<80% intensity). S-1 and R-1 provided smaller high-intensity areas compared with S and R, respectively. In S-1, where a high voltage was applied to the substrate, the electric field was formed between the narrow nozzle and the large substrate, which resulted in a narrow high-intensity area with dense spraying in the centre. In R-1, where a control voltage was applied to the ring, the electric field generated by the ring caused a small area to be densely sprayed in the centre as well. R-V and R-R also produced narrow high-intensity regions. In R-V, the strong electric field formed between the nozzle and the ring accelerated the droplets in the downward (spray) direction; moreover, as in R-1, the strong electric field generated by the ring sprayed the droplets in a localised area. In R-R, the ring had a smaller diameter than that in R and thus created a stronger electric field in the spray direction; this resulted in a denser spray in the centre. For the configurations where the ground was uncharged (S-2) or absent (R-O and R-N-O), no attractive force acted on the ground; therefore, the spray was distributed uniformly over a large coating area.
The coating area depends on the intensity and direction of the electric field. A highly concentrated coating can be obtained by charging the ring electrode with a control voltage or reducing the ring diameter. By contrast, if the substrate is absent or uncharged, a uniform coating over a large area is possible.
3.5 Spray velocity
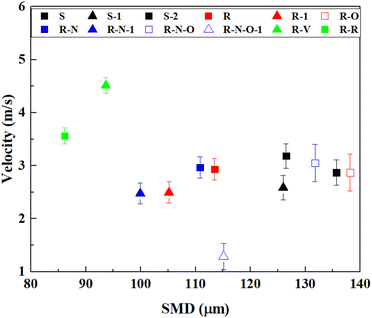
Fig. 12 presents a graph showing the Z-axis velocity as a function of SMD for the 12 equipment configurations. The measurements were recorded along the X-axis; the Y-axis was aligned with the centre of the nozzle, and the Z-axis was at an NTS of 40 mm. The experiment was conducted with the applied voltages listed in Table 5, where a stable cone jet was formed. The velocity was higher with R-V and R-R than in the other configurations, whereas the lowest velocity was recorded with R-N-O-1.Similar velocities were achieved with the other configurations within the error bars. The high voltage applied to the ring in R-V and the small ring diameter in R-R resulted in stronger electric fields than in the other configurations, which accelerated the spray towards the bottom. In R-N-O-1, the connected voltage was not applied, and no substrate was present; hence, the electric field was relatively weak, which resulted in a lower spray velocity. In addition, when the ring was charged, the velocity was reduced because the direction of the electric field between the nozzle and the ring was opposite to that of the electric field between the ring and the substrate. The spray velocity is also known to be affected by the droplet size.50
Conclusion
In this study, the results of the applied voltage, coating area, current, SMD, and spray velocity of the atomization mode, essential fundamental data for electrospraying processes, were compared and analyzed for 12 different system configurations with different parameters. Depending on the installation conditions, the configuration parameters with the greatest impact on the results were identified, which can be useful in determining the optimal system structure for a specific industrial application. The main observations were as follows:1. The closer the connected voltage or ground is to the control voltage, the spraying mode is formed by the lower applied voltage, and the higher the connected voltage, the spraying mode is formed by the higher applied voltage.
2. When there is no substrate, the coating area is relatively large, and when the voltage connected to the ring electrode is applied, the coating area is narrow, and when the ring electrode parameters are adjusted, the narrowest area is formed.
3. A small current was formed under the condition that the control voltage, connected voltage, and ground were all connected, and in the case of the cone jet mode, the increase in current was insignificant even when the applied voltage was increased, and the noise was small.
4. SMD was found to increase with a linear increase in coating area, and were found to be small under conditions where the ring parameters were controlled and large under no ground conditions.
5. The spray velocity shows less variation between experimental conditions and is dominated by the electric field strength.
Data availability
Data for this article, including image and graphs are available at Science Data Bank at https://doi.org/10.57760/sciencedb.09417, https://cstr.cn/31253.11.sciencedb.09417.Conflicts of interest
There are no conflicts to declare.Acknowledgements
This work was supported by the Human Resources Program in Energy Technology of the Korea Institute of Energy Technology Evaluation and Planning (KETEP) and was granted financial resources from the Ministry of Trade, Industry & Energy, Republic of Korea (No. 20204010600060).References
- Z. Wang, Q. Wang, B. Li, Y. Zhang, J. Wang and J. Tu, Exp. Therm. Fluid Sci., 2020, 114, 110054 CrossRef CAS.
- H. Kim, J. Kim and A. Ogata, J. Aerosol Sci., 2011, 42, 249–263 CrossRef CAS.
- T. He and J. V. Jokerst, Biomater. Sci., 2020, 8, 5555–5573 RSC.
- W. Deng and A. Gomez, Int. J. Heat Mass Transfer, 2011, 54, 2270–2275 CrossRef.
- J. Xie, A. Rezvanpour, C. Wang and J. Hua, AIChE J., 2010, 56, 2607–2621 CrossRef CAS.
- J. Y. Kim, S. J. Lee, G. Y. Baik and J. G. Hong, ACS Omega, 2021, 6, 29724–29734 CrossRef CAS PubMed.
- J. Xie and C. H. Wang, J. Colloid Interface Sci., 2007, 312, 247–255 CrossRef CAS PubMed.
- Y. Gan, Z. Jiang, H. Li, Y. Luo, X. Chen, Y. Shi, Y. Yan and Y. Yan, Sci. Rep., 2019, 9, 18791 CrossRef CAS PubMed.
- L. Yuliati, T. Seo and M. Mikami, Combust. Flame, 2012, 159, 462–464 CrossRef CAS.
- W. Li, J. Lin, X. Wang, J. Jiang, S. Guo and G. Zheng, Micromach., 2018, 9, 66 CrossRef PubMed.
- B. Rietveld, K. Kobayashi, H. Yamada and K. Matsushige, Soft Matter, 2009, 5, 593–598 RSC.
- M. Sivan, D. Madheswaran, J. Valtera, E. K. Kostakova and D. Lukas, Mater. Des., 2022, 213, 110308 CrossRef CAS.
- X. Li, G. S. Lee, S. H. Park, H. Kong, T. K. An and S. H. Kim, Org. Electron., 2018, 62, 357–365 CrossRef CAS.
- T. C. Nguyen and W. S. Choi, Sci. Rep., 2020, 10, 11075 CrossRef CAS PubMed.
- X. Yang, S. Wang, Y. Hou, Y. Wang, T. Zhang, Y. Chen, G. Chen, C. Zhong, X. Fan, X. Kong, T. Wu, Y. Lu, Y. Lin and Z. Chen, Nano Lett., 2024, 24, 3661–3669 CrossRef CAS PubMed.
- Z. Yin, D. Wang, Y. Guo, Z. Zhao, L. Li, W. Chen and Y. Duan, InfoMat, 2023, 6, e12505 CrossRef.
- M. J. Divvel, R. Zhang, Y. Zhmayev, S. Pinge, J. H. Lee, S. W. Kima and Y. L. Joo, Soft Matter, 2019, 15, 6485–6494 RSC.
- J. Kim, J. J. Kim, S. Park, J. Kim and S. J. Lee, Atmos. Pollut. Res., 2023, 14, 101711 CrossRef CAS.
- N. B. Cech and C. G. Enke, Mass Spectrom. Rev., 2002, 20, 362–387 CrossRef PubMed.
- G. J. V. Berkel and V. Kertesz, Anal. Chem., 2007, 79, 5510–5520 CrossRef PubMed.
- Y. Han and J. Dong, Procedia Manuf., 2016, 5, 1031–1042 CrossRef.
- J. Ma, J. Feng, H. Zhang, X. Hu, J. Wen, S. Wang and Y. Tian, Adv. Mater. Technol., 2023, 8, 202300080 Search PubMed.
- M. H. Memon, U. S. Amjad, A. Mir and M. Mustafa, ACS Appl. Electron. Mater., 2024, 6, 2178–2187 CrossRef CAS.
- H. Xu, J. Wang, B. Li, K. Yu, J. Tian, D. Wang and W. Zhang, Appl. Therm. Eng., 2021, 189, 116757 CrossRef CAS.
- K. Uchida, K. Higashi, K. Hishida, A. Hotta and N. Miki, Jpn. J. Appl. Phys., 2015, 54, 020302 CrossRef CAS.
- J. A. T. Hernández, P. I. T. Chávez, B. R. Wong, A. R. Chu, M. P. Jatomea, C. G. B. Urbina, N. A. R. Vázquez and F. R. Félix, J. Agric. Food Chem., 2015, 63, 4669–4707 CrossRef PubMed.
- Y. Luo, T. Ning, Y. Pei, X. Feng, S. Zhang, B. Lu and L. Wang, Appl. Surf. Sci., 2022, 571, 151081 CrossRef CAS.
- E. C. Orozco, A. Kar and R. Kumar, Sci. Rep., 2020, 10, 4405 CrossRef PubMed.
- Z. Mao, N. Hosoya and S. Maeda, Cyborg Bionic Syst., 2024, 5, 0091 CrossRef CAS PubMed.
- Y. Zhang, L. Liu, Y. Chen and J. Ouyang, J. Electrost., 2015, 74, 15–20 CrossRef.
- X. L. Gao, X. D. Bao, S. J. Pang, J. Wu, K. Luo and H. L. Yi, Phys. Fluids, 2024, 36, 033612 CrossRef CAS.
- P. Nemes, I. Marginean and A. Vertes, Anal. Chem., 2007, 79, 3105–3116 CrossRef CAS PubMed.
- Sumariyah, Kusminarto, A. Hermanto and P. Nuswantoro, J. Phys.: Conf. Ser., 2016, 776, 012100 CrossRef.
- M. A. Mosa, S. H. Kim and K. S. Kwon, J. Coat. Technol. Res., 2023, 20, 1069–1081 CrossRef CAS.
- E. Hvattum and D. Ekeberg, J. Mass Spectrom., 2002, 38, 43–49 CrossRef PubMed.
- V. T. Dau, T. K. Nguyen and D. V. Dao, Appl. Phys. Lett., 2020, 116, 023703 CrossRef CAS.
- L. Zhang, J. Huang, T. Si and R. X. Xu, Expert Rev. Med. Devices, 2012, 9, 595–612 CrossRef CAS PubMed.
- J. Liu, H. Wu, C. Zhu, W. Xiong, F. Chen, L. Xiao, J. Liu, K. Wang, H. Li, D. Ye, Y. Duan, J. Chen, H. Yang, W. Li, K. Bai, Z. Yin and H. Ding, Int. J. Extreme Manuf., 2021, 3, 045101 CrossRef.
- Y. Kuwahata, H. Takehara and R. Ichiki, AIP Adv., 2020, 10, 045107 CrossRef CAS.
- A. Parisi, D. Flagiello, A. Piscitelli and F. D. Natale, Chem. Eng. Trans., 2023, 99, 427–432 Search PubMed.
- X. Dong, Y. Zheng, B. Xin, H. Liu and L. Lin, Fibers Polym., 2020, 21, 2695–2705 CrossRef.
- S. Sumariyah, A. Hermanto and P. Nurwantoro, Appl. Mech. Mater., 2015, 771, 227–231 Search PubMed.
- S. Sumariyah, K. Kusminarto, A. Hermanto, P. Nuswantoro, Z. Muhlisin and E. Setiawati, Procedia Environ. Sci., 2015, 23, 260–265 CrossRef.
- N. Chen, Y. Gan, Y. Luo and Z. Jiang, Fuel Process. Technol., 2022, 234, 107342 CrossRef CAS.
- A. Jaworek, J. Mater. Sci., 2006, 42, 266–297 CrossRef.
- S. Kavadiya and P. Biswas, J. Aerosol Sci., 2018, 125, 182–207 CrossRef CAS.
- J. Y. Kim, S. J. Lee, M. H. Lee and J. G. Hong, ACS Omega, 2024, 9, 1125–1133 CrossRef CAS PubMed.
- J. E. Logsdon, Kirk-Othmer Encycl. Chem. Technol., 2nd edn, 2004, pp. 1–35 DOI:10.1002/0471238961.0520080112150719.a01.pub2.
- K. W. Ku, J. G. Hong and C. W. Park, Atomization Sprays, 2015, 25, 895–915 Search PubMed.
- J. Y. Kim, S. J. Lee and J. G. Hong, ACS Omega, 2022, 7, 28667–28674 Search PubMed.
- I. B. Rietveld, K. Kobayashi, H. Yamada and K. Matsushige, J. Phys. Chem. B, 2006, 110, 23351–23364 CrossRef CAS PubMed.
| This journal is © The Royal Society of Chemistry 2024 |

