 Open Access Article
Creative Commons Attribution 3.0 Unported Licence
Chemotactic behavior for a self-phoretic Janus particle near a patch source of fuel
Viviana
Mancuso
ab,
Mihail N.
Popescu
 c and
William E.
Uspal
 *ab
*ab
aDepartment of Mechanical Engineering, University of Hawai’i at Mānoa, 2540 Dole St., Holmes Hall 302, Honolulu, HI 96822, USA. E-mail: uspal@hawaii.edu
bInternational Institute for Sustainability with Knotted Chiral Meta Matter (WPI-SKCM2), Hiroshima University, 1-3-1 Kagamiyama, Higashi-Hiroshima, Hiroshima 739-8526, Japan
cDepartment of Atomic, Molecular, and Nuclear Physics, University of Seville, 41080 Seville, Spain. E-mail: mpopescu@us.es
First published on 8th October 2024
Abstract
Many biological microswimmers are capable of chemotaxis, i.e., they can sense an ambient chemical gradient and adjust their mechanism of motility to move towards or away from the source of the gradient. Synthetic active colloids endowed with chemotactic behavior hold considerable promise for targeted drug delivery and the realization of programmable and reconfigurable materials. Here, we study the chemotactic behavior of a Janus particle, which converts “fuel” molecules, released at an axisymmetric chemical patch located on a planar wall, into “product” molecules at its catalytic cap and moves by self-phoresis induced by the product. The chemotactic behavior is characterized as a function of the interplay between the rates of release (at the patch) and the consumption (at the particle) of fuel, as well as of details of the phoretic response of the particle (i.e., its phoretic mobility). Among other results, we find that, under certain conditions, the particle is attracted to a stable “hovering state” in which it aligns its axis normal to the wall and rests (positions itself) at an activity-dependent distance above the center of the patch.
1 Introduction
Synthetic microswimmers have gained significant attention in recent years due to their potential applications in various fields,1 including materials science,2 micro/nanotechnology,3 environmental remediation,4,5 and biomedicine.6,7 Among synthetic microswimmers, catalytically active Janus particles (JPs), capable of autonomous motion in response to self-generated chemical gradients, present a particularly intriguing avenue for exploration.8 These particles consume molecular “fuel” (i.e., reactant) available in the surrounding liquid solution by catalyzing a chemical reaction over a region of their surface. The free energy of the chemical reaction is used to induce the particle's mechanical motion through an interfacial molecular mechanism known as phoresis.9–11 In brief, gradients in the chemical composition of the solution along the surface of a particle, in conjunction with molecular-scale interactions between the particle surface and the various chemical species (solvent, reactant, and reaction product) present in the solution, drive hydrodynamic flow of the solution, leading to directed “swimming” motion of the particle.9,10For catalytic Janus particles, the reaction rate, and therefore the interfacial swimming actuation, depends on the local concentration of molecular fuel.8 This observation raises intriguing possibilities for controlling particle behavior. In particular, an understanding of how these particles respond to external gradients of fuel concentration may allow for realization of artificial chemotaxis, inspired by chemotaxis in biological micro-organisms. Here, one can make a suggestive analogy: in order to move towards regions with a higher concentration of nutrients or other chemoattractants, micro-organisms sense local concentrations and adjust their locomotion mechanisms accordingly. A classical example is E. coli, which can migrate towards a food source in liquid solution by temporally sampling the local nutrient concentration, and, acting on these measurements, suitably modulating a random sequence of straight line “runs” and uncontrolled “tumbling” events that randomize the bacterium's swimming direction.12 While E. coli performs temporal sampling, eukaryotic cells are large enough to directly sense chemical gradients across their body length using surface receptors.13–15 For instance, for the amoeba Dictyostelium, an asymmetric distribution of bound and unbound surface receptors can trigger polarization of internal biochemical pathways, allowing this organism to steer towards a food source.14 Neutrophils can chemotax towards an inflammation site through similar mechanisms.16,17 Although Dictyostelium and neutrophil motility usually involves contact with a solid surface, chemotaxis has also been observed for these cells when freely suspended and swimming in solution.18
Motivated by the swimming-squirming analogy between the motility of catalytic Janus particles and that of micro-organisms,19–21 many studies have considered whether such analogy extends towards an equivalent of chemotaxis of synthetic swimmers exposed to spatial gradients in the concentration of reactant. Here, we highlight a few of these studies; comprehensive reviews are provided by ref. 22 and 23. In an early work, Hong et al. studied the behavior of Pt/Au bimetallic nano-rods in the vicinity of a gel soaked with hydrogen peroxide “fuel.” The rods were observed to accumulate at the gel.24 Subsequently, Byun et al. pointed out the possibility of hydrodynamic flows sourced by the fuel patch in this set-up, and developed a framework for distinguishing advective and self-propulsive contributions to particle motion.25 Baraban et al. studied chemotactic behavior of tubular micro-jets and Pt@SiO2 Janus spheres in a microfluidic device.26 A solution containing hydrogen peroxide was continuously injected in one inlet port of the device, leading to a gradient of chemical “fuel” perpendicular to the direction of flow. The microswimmers exhibited a tendency to orient towards the region of high fuel concentration and accumulate in that region. In a similar microfluidic set-up, catalase-coated and urease-coated liposomes were observed to migrate towards and away from, respectively, regions of high substrate concentration.27 More recently, Xiao et al. used stop-flow microfluidic gradient generation to study chemotactic behavior of Cu@SiO2 Janus spheres, finding a tendency of these particles to align their cap towards higher fuel concentration.28 By stopping the flow, they could eliminate any potential contribution of surface-assisted cross-stream migration to particle motion.29 In an effort to realize chemotactic active colloids that use biocompatible fuels, Mou et al. fabricated ZnO-based Janus spheres fuelled by dissolved carbon dioxide.30 They observed these Janus particles to chemotax towards a carbon dioxide source through reorientation. Additionally, Zhou et al. studied bottle-shaped particles powered by internalized enzymatic decomposition of glucose.31 Similarly, they found that “opening” of a bottle will rotate towards a glucose source, leading to chemotactic migration.
To shed some light on mechanisms underlying experimental results, Popescu et al. presented a framework for understanding how the microscopic coupling between the orientation of a self-phoretic Janus particle and an ambient chemical gradient can lead to chemotaxis, defined to be active reorientation of the swimming direction with respect to the gradient.32 Active reorientation distinguishes chemotaxis from chemokinesis, defined as a variation of particle speed due to ambient chemical gradients.32,33 As a microscopic mechanism that induces reorientation, Popescu et al. pinpointed a crucial role for a quantitative difference in chemi-osmotic response of the catalytic and inert “faces” of the particle to a chemical gradient,32 which is the equivalent for the active particles of the classic result of Anderson concerning the electrophoresis of colloids with non-uniform zeta potential.10 The importance of a contrast in phoretic mobilities of the two “faces” for inducing alignment of the particle with an externally maintained gradient had also been noted in the context of thermophoretic Janus particles.34 Building upon the analysis by Saha et al.,35 Tătulea-Codrean and Lauga presented a comprehensive theoretical model for the motion of a self-phoretic Janus particle in a linear background reactant gradient in unconfined solution.36 They assumed that the reaction rate is proportional to the reactant concentration (i.e., first-order kinetics), considered the phoretic response to both the reactant and product gradients, and developed comprehensive analytical expressions for the translational and angular velocity of a Janus particle with arbitrary orientation with respect to the background gradient. Using these results, they considered the dispersion of a dilute suspension of such Janus particles exposed to a linear gradient in fuel. Finally, we mention that chemotaxis of chemically-powered micromotors in a fuel gradient has also been studied by means of mesoscopic particle-based simulations.37,38
Moving from the single-particle behavior to the context of suspensions, chemotaxis has been noted to play a role in phase separation, clustering, and other collective phenomena in systems of self-phoretic active colloids.39 When these particles interact through self-generated chemical gradients, the sign of chemotactic alignment, i.e., the attractive or repulsive character, determines whether these systems form finite-size clusters, or collapse into a single large cluster.40 Saha et al. distinguished four modes of response of an active colloid to an ambient chemical gradient, including chemotactic alignment, and mapped out a phase diagram of collective behaviors induced by chemotaxis.35 Chemotactic alignment can cooperate or compete with other interparticle interactions, especially activity-sourced hydrodynamic interactions.41–43 For instance, it has been shown that activity-induced fluid stirring can disrupt chemotactic pattern formation.43
Preceding theoretical studies have laid the groundwork for understanding chemotaxis of catalytic Janus particles. However, important aspects of the problem still remain to be explored. For instance, most experiments involve a spatially localized and finite-sized source of fuel (i.e., a “patch”). A patch will generate a fuel concentration field that has nonlinear dependence on spatial position. It is only far away from the patch, i.e., for distances from the patch that are much larger than the characteristic length scale of the patch, that a linearly varying field is a good approximation. However, nonlinear gradients may play a significant role in determining particle behavior, especially as the Janus particle approaches the patch. Secondly, the interplay of the characteristic sizes of the patch and particle may be important, especially as the particle approaches the patch. Thirdly, in experimental realizations, the patch is usually associated with a confining boundary, such as when the patch is the surface of another colloidal particle, or when the patch is imprinted on a planar substrate. A solid confining boundary will modify the chemical and hydrodynamic fields sourced by patch and the Janus particle, affecting particle motion. Here, we recall that even an inert planar wall can induce wall-bounded “sliding” and “hovering” states of a catalytic Janus particle.44
In this study, we investigate the motion of a Janus particle activated by a finite-sized, spatially localized patch source of “fuel” in a confining geometry. Specifically, we consider the motion of a catalytic Janus particle near a chemical patch with axisymmetric shape that continuously emits chemical fuel. The model assumes first-order chemical kinetics and therefore resolves the dependence of the catalytic activity of the particle on the local concentration of reactant and motion by self-phoresis induced solely by the product. Using first-order kinetics, the model can probe the relative significance of reaction rate (rate of fuel consumption by the particle) and fuel diffusion.45,46 Moreover, the model also explicitly considers the sizes of the particle and the patch, thus going beyond a far-field point particle and point source analysis (which is recovered in the limiting case of large distances). In large part, this study will focus on an axisymmetric configuration of the particle and patch, in which the particle center is located above the patch center, and the particle axis is aligned with the patch normal, with the general aim of understanding the conditions under which a Janus particle will navigate towards or away from the patch. Although this focus will limit our direct consideration of chemotactic reorientation, it is the logical starting point for understanding general three-dimensional motion.
In summary, our study provides foundations for understanding how a Janus particle responds to a localized, not point-like, source of fuel. The distinctive features include the consideration of a non-uniform reactant concentration field within the solution, sourced by a chemically active patch, as well as the role of confining geometry. Our main finding is that, under certain conditions, these features induce a novel “hovering” state in which the particle remains motionless at a steady height above the patch on the wall. The precise value of the hovering height depends on the dimensionless reaction rate (Damköhler number), as well as the material properties of the particle (phoretic surface mobility) and the details of the geometry (the shape of the particle, the shape of the patch, the size ratio, etc.) Depending on these parameters, the hovering state can be stable or unstable against vertical perturbations of the particle position. We also briefly investigate the stability of the hovering state against general three-dimensional (3D) motions. We show that the hovering state can indeed be stable in 3D, and attracts a particle from an arbitrary initial position and orientation that is not an axisymmetric configuration. Therefore, our study provides proof of concept that a fuel-releasing chemical patch can attract a Janus particle through chemotaxis.
2 Model
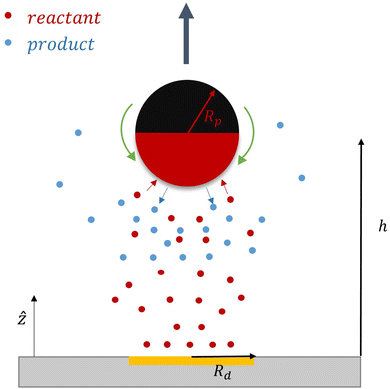
Fig. 1 schematically depicts the key components of our model. A planar wall confines the suspension containing the Janus particle to the upper half space. At a region (the patch) positioned on the planar wall, reactant molecules are released into the surrounding solution. These rapidly diffuse throughout the solution; upon contact with the catalytically active side (the red hemisphere in Fig. 1) of the Janus particle (JP), they are converted, with certain probability (encoded by the rate of the chemical catalytic reaction), into product molecules. The chemical reaction can be simplified as R → a·P, with R and P representing a generic reactant and product, respectively, and a as the stoichiometric factor; in the following we set a = 1, for simplicity. Since the reaction exclusively occurs on one side of the JP, it leads to inhomogeneities in the spatial distribution of product and reactant molecules around the JP. We assume that the motion of the JP emerges through a phoretic response solely to the gradients in the density of product molecules and further assume that this can be summarized by a phoretic actuation (active slip velocity, depicted schematically in Fig. 1 by the green arrows) of the suspension at the surface of the particle, as in the classic framework by Anderson.10 This gives rise to bulk hydrodynamic flow and motion of the particle. Under the typical assumptions of low Reynolds number flow of the solution and overdamped motion of the colloidal particle, which are very reasonable approximations in many experiments, in the absence of an external driving field acting on the particle, the force and torque induced by the interfacial flow are instantaneously balanced by translational and rotational hydrodynamic drag on the particle.From a mathematical standpoint, the model described above means determining a chemical field, which consists of the spatial distributions of reactant and product molecules, and a hydrodynamic field induced by the active actuation at the surface of the particle, as well as the overdamped motion of the particle. These points will be addressed in the next subsections. Before proceeding, here we discuss several approximations, already alluded to in the previous paragraph, which are suggested by the typical experimental studies of micrometer sized colloids in aqueous suspensions (these seem to be also the most suitable set-ups for realizations of the model system considered by us). These will allow significant simplifications of the mathematical description.
First, for systems involving suspensions with density and viscosity similar to that of water, particles with sizes typically in the order of micrometers, and flow and particle velocities typically in the order of micrometers per second, viscous forces dominate over inertia. This is quantified by the Reynolds number  , where ρ is the density of the fluid, |U| a characteristic velocity (e.g., the translational velocity of the particle), and μ is the dynamic viscosity. Using Rp ∼ 1 μm, |U| ∼ 1 μm s−1, ρ ∼ 1000 kg m−3, and μ ∼ 10−3 Pa s renders Re ∼ 10−6 ≪ 1. Accordingly, the hydrodynamics is governed by the Stokes equation, and, consistently, the motion of the particle is in the overdamped regime.
Second, by the Stokes–Einstein relation, diffusion of the molecularly sized reactant and product species in aqueous solutions is fast, implying that the transport of the reactant and product species by diffusion dominates over that by advection. This assumption is substantiated by the value of the Péclet number (Pe), which compares the time scales of diffusion and advection over a lengthscale comparable to that of the particle size: the same numbers as above render D ∼ 10−9 m2 s−1 for Å-sized molecules and thus Pe = |U|Rp/D ≈ 10−3 ≪ 1. Consequently, the advection term can be neglected in the continuity equation for the product. This is a major simplification because it effectively decouples the equations governing the chemical field from the hydrodynamics of the solution.
2.1 Chemical field
The fast diffusion of the molecular species, Pe ≪ 1, additionally justifies the assumption that, on the time scale of particle motion, the chemical field is quasi-relaxed to the steady-state distribution corresponding to the instantaneous position of the particle. Furthermore, we also assume that the molecules exhibit “ideal-gas-like” behavior, implying that the distribution of each species remains unaffected by the presence of other molecules.Given these considerations, the reactant chemical field cr is modeled by the Laplace equation,
| ∇2cr = 0, | (1a) |
– at infinity
 | (1b) |
– release of reactant molecules at the patch at the wall (the plane z = 0):
| −Dr[∇cr·ẑ]|z=0 = QK(r)|z=0, | (1c) |
– a sink at the active side, SA of the JP surface S where the conversion of reactant into product is promoted, and a reflective surface at the inert side SI of the JP surface, i.e.,
−Dr[∇cr·![[n with combining circumflex]](https://www.rsc.org/images/entities/b_char_006e_0302.gif) ]|S = −F[f(r)cr]|S. ]|S = −F[f(r)cr]|S. | (1d) |
As discussed, we consider in this study only the case of patches with axisymmetric shapes, and thus we write K(r) = K(r) (z = 0, implicitly) and define the origin of the coordinate system at the center of the patch. The solution to the diffusion problem outlined above is more conveniently expressed as the superposition of a background field produced by the patch in the absence of the JP, and a “disturbance” field, cr = cbr + cdr. The background field obeys the Laplace equation, the boundary condition at infinity, eqn (1b), and accounts for the boundary condition at the wall eqn (1c). This problem can be solved analytically using the separation of variables and the Fourier–Bessel transform,47,48 yielding the solution:
 | (2) |
where δ(ξ − ξ′) is the Dirac delta function. The boundary condition on the wall and the orthogonality relation give the Fourier–Bessel spectrum:
 | (3) |
 | (4) |
This leads to:
 | (5) |
 is due to our choice to use the particle size Rp as a characteristic length scale in the definition of C0. The combination
  gives a characteristic concentration
  sourced by a circular patch of radius Rd.
Anticipating an extension of the type of geometries analysed as a test for the theoretical far-field, point-particle predictions (see the following section), we note here that from the solution for the background reactant field sourced by a circular patch, we can easily obtain the solution for the background field sourced by, e.g., a ring-shaped patch. Specifically, the ring-shaped patch has K(r) = 1 for Ri < r < Ro, and K(r) = 0 elsewhere. Due to the linearity of Laplace's equation, we can obtain the solution for a ring-shaped patch by subtracting the background field for a circular patch of radius Rd = Ri from the background field for a circular patch of radius Rd = Ro.
In terms of the – now known – background density field cbr, the diffusion problem for the disturbance field is formulated as follows. The field cdr obeys the Laplace equation, the boundary condition at infinity, eqn (1b), and – owing to cbr already fulfilling eqn (1c) – a zero normal current (reflective) boundary condition at the wall. The concentration gradient along the direction normal to the JP surface assumes the form:
[∇cr·![[n with combining circumflex]](https://www.rsc.org/images/entities/b_char_006e_0302.gif) ]|S = [∇cbr· ]|S = [∇cbr·![[n with combining circumflex]](https://www.rsc.org/images/entities/b_char_006e_0302.gif) + ∇cdr· + ∇cdr·![[n with combining circumflex]](https://www.rsc.org/images/entities/b_char_006e_0302.gif) ]|S, ]|S, |
 | (6) |
![[r with combining tilde]](https://www.rsc.org/images/entities/b_char_0072_0303.gif) = r/Rp and
= r/Rp and ![[c with combining tilde]](https://www.rsc.org/images/entities/i_char_0063_0303.gif) = c/C0),
= c/C0), | (7) |
| Da := FRp/Dr ≡ FC0/Q. | (8) |
Turning now to the distribution of product, we recall that at the JP surface the R-molecules are converted into P-molecules. At steady state, the product chemical distribution is the solution of the Laplace equation,
| ∇2cp = 0, | (9a) |
 | (9b) |
 | (9c) |
 | (9d) |
For simplicity, in the followings we assume equal diffusion coefficients, Dp = Dr.
2.2 Fluid actuation by active phoretic slip
As discussed, the interfacial flow driven by the spatially inhomogeneous distribution of the product concentration will be accounted in our model by an active phoretic slip velocity vs, which defines the relative velocity between the particle and the fluid. For this we assume the classic expression9,10| vs(r) = −b(r)∇‖cp, | (10) |
The latter is a material-dependent parameter that describes the effective intermolecular interaction between the product and the colloid surface. The value of this parameter quantifies the strength of intermolecular forces, and the sign indicates whether these interactions are attractive (positive sign) or repulsive (negative sign). Moreover, the phoretic mobility can be either uniform or non-uniform over the particle surface. Typically, as the two sides of the Janus particle are composed of different materials, their distinct chemical properties result in separate and independent interactions with the product molecules. Consequently, the parameter “b” assumes distinct values bcb0 and bib0, on the cap and inert side, respectively. Here, bc and bi are dimensionless quantities, while b0 > 0 is a characteristic surface mobility. When considering the materials commonly utilized in the design of self-phoretic Janus particles, such as Pt and SiO2, experimental evidence suggests that the ratio bi/bc typically falls within the range of 0 to 0.3.53 This parameter holds particular significance in this problem as it can be adjusted to achieve specific motion dynamics.
Finally, we note that from the form of the slip velocity, we can define a characteristic velocity V0 ≡ b0C0/Rp. Substituting our expression for C0, we obtain
| V0 = b0Q/Dr. | (11) |
2.3 Hydrodynamic field
We assume that the flow is incompressible, giving the condition| ∇·u = 0, | (12) |
| ∇·σ = 0; | (13a) |
| u(|r| → ∞) = 0, | (13b) |
| u(r)|S = [V + Ω × (r − rp) + vs(r)]S, | (13c) |
| u(r)|z=0 = 0. | (13d) |
To close the system of equations (recall that V and Ω are unknown at this point), we consider the net force and the net torque acting on the colloid, defined as Fnet and the Tnet respectively. Since Re ≪ 1, these instantaneously vanish: Fnet ≈ 0 and Tnet ≈ 0. Both can be seen as the sum of hydrodynamic and external contributions so that: Fnet = Fh + Fext and Tnet = Th + Text. The hydrodynamic terms, Fh and Th, are exerted by the fluid on the particle. On the other hand, Fext and Text refer to external forces and torques acting on the system. In this study, we assume that there are no external forces or torques on the system. Consequently, the net force becomes:
 | (14a) |
Similarly, the net torque becomes:
 | (14b) |
At this stage, the hydrodynamic problem has been fully characterized and the analysis can be simplified by introducing the Lorentz reciprocal theorem, which connects the slip velocity and the translational and rotational velocities, leading to:54
 | (15) |
3 Results
In the following, we assume an axisymmetric configuration of the patch and the particle, as schematically illustrated for a sphere by Fig. 1. We aim to understand whether the particle will strictly move towards or away from the patch, or whether, under some conditions, the particle can have a motionless “hovering” state at a fixed height above the patch. Additionally, for hovering states, we seek to understand the dependence of the hovering height on the system parameters (Da, bi, and bc), as well as the stability of the hovering state against perturbations in the particle height.In the preceding, we did not assume any particular shape of the Janus particle. In the following, we will mainly consider spherical particles of radius Rp that are half-covered by catalyst. We will also consider prolate spheroidal particles with semi-major axis length Rp. The semi-minor axis length is quantified by the aspect ratio re as reRp, where 0 < re ≤ 1. Both spherical and prolate spheroidal particles are assumed to have axisymmetric catalyst coverage, and we will also consider the dependence of hovering on the particle shape, i.e., the value of re.
3.1 Concentration fields
As described above, the determination of the reactant and product concentration fields is independent of, and logically precedes, the determination of the particle velocity. Therefore, we first consider these fields for a particle near a wall. The background reactant field cbr is obtained by numerical integration of eqn (5). We solve for the concentration fields cdr and cp using two approaches. Semi-analytically, we solve for the fields using bipolar coordinates, as detailed in Appendix B. Numerically, we use the boundary element method (BEM).55 As discussed in Appendix B, the reason for using both these approaches is that of cross-check and validation, in a couple of cases, of the BEM. The latter is significantly faster, and it also has the crucial advantage of a straightforward generalization to more complex cases, e.g., particles of non-spherical shapes and systems lacking axial-symmetry, that will be considered in future studies. Unless explicitly mentioned, the results presented and discussed in the followings are obtained by using the BEM method.We briefly discuss the reactant background field, shown in Fig. 2 for a circular patch with Rd = Rp. In the bulk liquid near the patch (0.1 < z/Rp < 1 and |y|/Rp < 1.5), there is strong spatial variation of the concentration. In very close vicinity of the patch, z ≈ 0 and |y|/Rp < 1, the reactant field is approximately uniform in the lateral direction. At this close distance, the patch resembles a planar wall that uniformly releases reactant. Since the only length scale in determination of the background field for a circular patch is Rd, the values of the dimensionless concentration for other values of Rd can be easily inferred by rescaling of the coordinate axes and the dimensionless concentration by Rd/Rp (see the prefactor in eqn (5).)
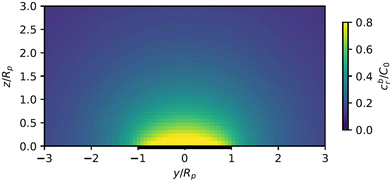 | ||
Fig. 2 Background reactant concentration ![[c with combining tilde]](https://www.rsc.org/images/entities/i_char_0063_0303.gif) br sourced by a circular patch with radius Rd = Rp. The patch is shown as a thick black line. br sourced by a circular patch with radius Rd = Rp. The patch is shown as a thick black line. | ||
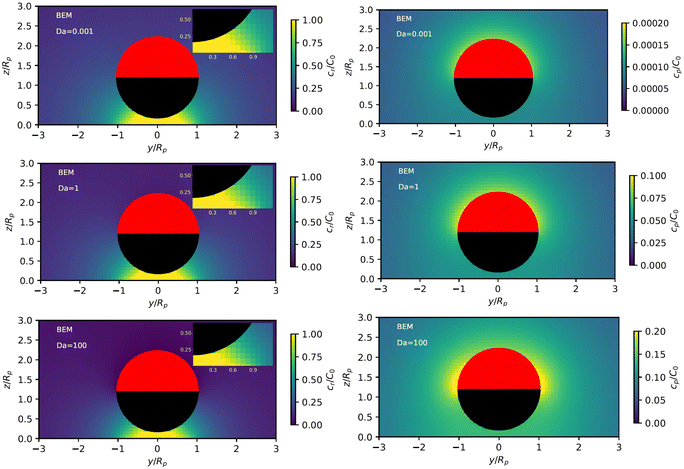
Fig. 3 shows the reactant concentration (on the left) and product concentration (on the right) for h/Rp = 1.2 and Da = 0.001, 1, 100. For the reactant, the insets (top-right corner) provide a zoomed-in view of the region between the patch and the JP, for a better visualization of the gradient. For the low value of Da, diffusion is the predominant process. A particular concentration, cr/C0 = 1 (yellow tone) reaches a distance on the wall (z = 0) equal to y/Rp = 0.8. In the vicinity of the catalytic “pole” of the particle, located at z/Rp = 2.2, the reactant concentration cr/C0 ≈ 0.15 (bluish color). At Da = 1, the two processes (reaction and diffusion) assume equal importance. At high Da, the reactant is quickly consumed by the catalytic cap, and therefore is less able to diffuse into the surrounding solution. Here, cr/C0 = 1 reaches only y/Rp = 0.5 on the wall. Moreover, the reactant concentration is nearly exhausted in the vicinity of the catalytic pole (cr/C0 ≈ 0.01, purple color.) In all cases, the results obtained numerically, with the BEM, and semi-analytically, using bipolar coordinates, show excellent quantitative agreement (see Appendix B).
In addition, Fig. 3 shows (on the right) the product concentration for the same height and values of Da. For the smallest value of Da, Da = 0.001, the concentration is highest near the catalytic pole. The maximum of the product concentration being located at the catalytic pole is a typical scenario for catalytic Janus spheres.46 Over the cap, the spatial gradient of concentration is directed from the “equator” to the pole, with a positive component in the z-direction. Over the inert region of the particle, the spatial gradient is from the pole to the equator; again, the z-component is positive. Recalling that vs(r) = −b(r)∇‖cp, we expect that the slip velocity will have a positive z-component where b is negative. Therefore, for bi < 0, the inert region would drive swimming towards the wall. (Recall from Fig. 1 that slip velocity induces translational motion in the opposite direction.) Likewise, for bc < 0, the catalytic region would also drive swimming towards the wall.
For the largest value of Da, however, we see an “inversion” effect. The concentration is highest near the “equator” of the particle. Thus, on the catalytic side, the spatial gradient of the concentration is directed from the catalytic “pole” to the “equator,” with a negative component in the z-direction. Therefore, if bc < 0, the slip velocity on the cap will be directed from the “pole” to the “equator,” and the catalytic cap would drive swimming away from the wall. On the inert side, we still have a spatial gradient from the “pole” to the “equator,” and a slip velocity in the same direction for bi < 0. Therefore, the inert side would still drive swimming towards the wall when bi < 0, as in the low Da case.
From the foregoing, it is clear that, for a given configuration of the particle and patch, the Damköhler number Da can have a profound effect on the product concentration field. Increasing Da for a particle at a given position can lead to a “concentration-inversion” effect. We can also show that, at a given value of Da, the inversion effect depends on proximity to the patch. In Fig. 4, we show the product concentration field for a sphere with Da = 100 that is far away from the patch (h/Rp = 100). The product concentration is mostly uniform over the cap, with a sharp decrease in the vicinity of the equator as one approaches the equator from the catalytic pole. Therefore, there is no inversion effect, and for bc < 0, the catalytic cap would drive swimming towards the wall.
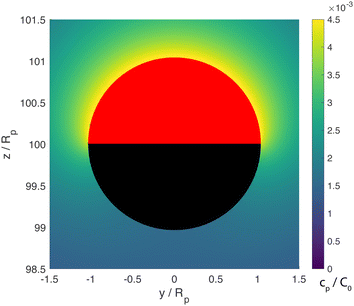 | ||
| Fig. 4 Concentration of the chemical product for a cap-up sphere located far away from the wall (h/Rp = 100) with Da = 100. The concentration is mostly uniform over the cap, with a sharp drop as one approaches the “equator” from the catalytic pole (note that the yellow region is thinner near the equator.) This variation is in contrast with the “inversion” effect seen for Da = 100 in Fig. 3. The patch size is Rd = Rp, and the concentration was computed with the BEM. | ||
Now we are in a position to qualitatively infer the existence of a “hovering” state. To simplify the following argument, suppose bi = 0, such that the inert side of the particle does not contribute to the particle velocity. For Da = 100 and bc < 0, the catalytic cap drives swimming away from the wall when the particle is at a height h/Rp = 1.2. For the same value of Da and the same bc < 0, the catalytic cap drives swimming towards the wall when h/Rp = 100. Thus, we expect that at some intermediate height 1.2 < h/Rp < 100, the velocity of the particle will be zero. The particle will exhibit motionless “hovering” at this height (although it will continuously pump the surrounding fluid.) The following section will confirm this reasoning quantitatively.
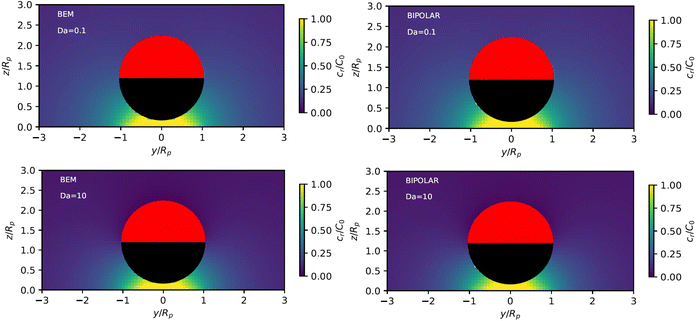
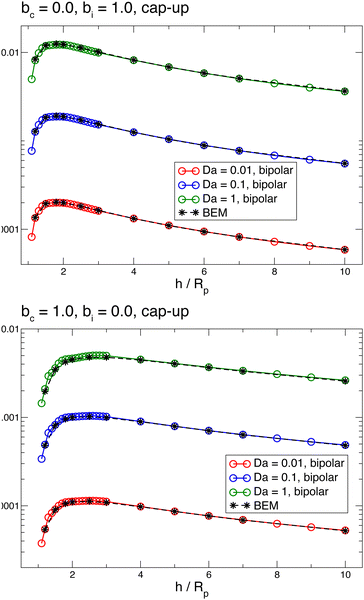
Appendix B provides a quantitative comparison of reactant concentration fields obtained with the BEM and via semi-analytical solution in bipolar coordinates (Fig. 17). We note that the agreement shown in Fig. 17 between the two methodologies provides important validation of our implementation of the boundary element method for first-order chemical kinetics. Beyond the parameters shown in the figures, the BEM can easily be extended to calculate chemical fields for very large Da numbers and/or very large distances h, as well as non-axisymmetric configurations. Moreover, the BEM straightforwardly handles other particle shapes, and is computationally significantly faster.
3.2 Particle velocity
Having characterized how the reactant and product fields depend on the particle configuration and Damköhler number, we now turn to investigating the vertical motion of the particle, i.e., motion towards or away from the patch. In Appendix B, as an additional cross-check and validation for the boundary element method, we provide a brief comparison of velocities obtained with the BEM and using bipolar coordinates. Throughout the rest of Section 3, we use the BEM to determine both the concentration fields cdr and cp, as well as to solve the necessary auxiliary hydrodynamic problems as outlined in Section 2.2.The power law behavior can be recovered in the framework of a far-field, “point-particle” theory. We model the reactant background concentration as being due to a point source located at the origin:
 | (16) |
| cbr(r) = cbr(rp) + ∇cbr|r=rp·(r − rp) + …, | (17) |
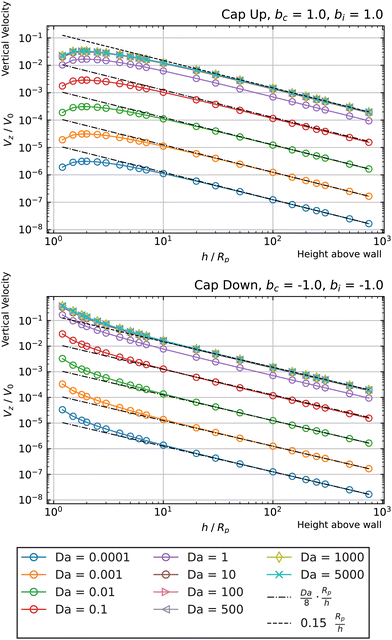
From Fig. 5, it is apparent that for low values of Da, each Vzvs. h curve is associated with its own power law. Therefore, in the far-field, point-particle framework, we first consider the scenario that Da ≪ 1. In this scenario, the consumption of the fuel by the particle is negligible, and we approximate cr(r) ≈ cbr(r). Moreover, in the limit Da → 0, we expect to recover results from zeroth order kinetics, i.e., results for a Janus particle with a boundary condition −Dp[∇cp·![[n with combining circumflex]](https://www.rsc.org/images/entities/b_char_006e_0302.gif) ] = κ on the catalytic cap, where κ = Fcbr(rp). For this boundary condition, it is known that a Janus particle in free space (unconfined solution), with its symmetry axis aligned with the z-axis, will have velocity
] = κ on the catalytic cap, where κ = Fcbr(rp). For this boundary condition, it is known that a Janus particle in free space (unconfined solution), with its symmetry axis aligned with the z-axis, will have velocity  , where Ṽfs is a dimensionless constant. Therefore, we obtain the scaling
 | (18) |
 | (19) |
The predicted scaling, plotted as dashed-dotted lines in Fig. 5, shows good agreement with the Da ≪ 1 data. In order to emphasize the universality of this scaling for Da ≪ 1, in Fig. 6 we show data for Da = 0.001 and Da = 0.01 for cap-up and cap-down spheres activated by circular patches of different sizes Rd, a cap-up prolate particle activated by a circular patch, and a cap-up sphere activated by a ring-shaped patch. We exploit our scaling to collapse the data onto a universal curve.
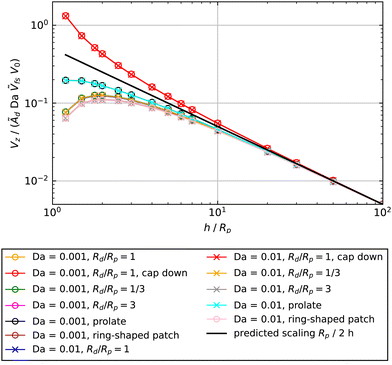 | ||
| Fig. 6 In the limit Da → 0, the velocity Vz as a function of height h can be collapsed onto a universal curve, given by eqn (19), for various particle shapes, patch sizes, and patch shapes. Except where indicated in the legend, the shape of the particle is assumed to be spherical, the configuration is assumed to be cap-up, and the shape of the patch is assumed to be circular. The surface mobility is assumed to be uniform, with the sign chosen to give a positive velocity. For the prolate particle, re = 1/3, and Ṽfs was determined numerically as Ṽfs = 0.1247. For the ring, the outer radius is Ro/Rp = 2.5 and the inner radius is Ri/Rp = 1.5. | ||
Now we turn to the opposite limit, Da → ∞. From our data in Fig. 5, it is apparent that the function Vzvs. h/Rp for different values of Da collapses onto a universal curve as Da → ∞. In other words, the far-field scaling for Vzvs. h/Rp loses dependence on Da as Da → ∞. We give arguments in Appendix A rationalizing this loss of dependence on Da. Moreover, in Appendix A, we argue that the prefactor of the scaling Vz/V0 ∼ ÃdRp/h should be the dimensionless number 0.15 for a sphere. This predicted scaling is shown on Fig. 5, and has good agreement with the numerical data.
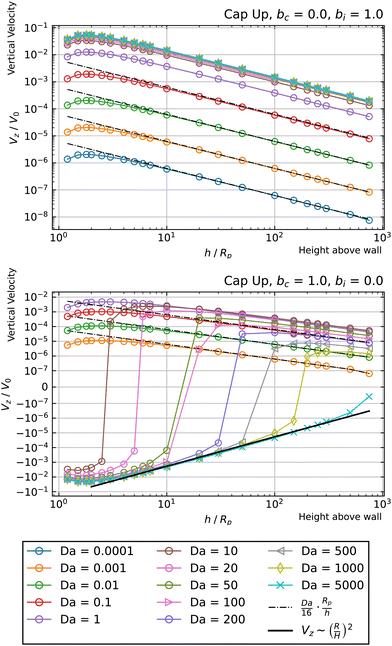
In Fig. 7, we show the results for a cap-up sphere for the cases of bc = 0, bi = 1 and bc = 1, bi = 0. In the first case (phoretic slip only on the inert side), we obtain a similar result as in the case of uniform mobility. Again, the low Da curves are described by the scaling law given in eqn (19). In this case, the value of Ṽfs appearing in the low Da scaling is Ṽfs = 1/8. We also obtain collapse for the Da ≫ 1 curves, although for higher values of Da than in the case of uniform mobility.
 | ||
| Fig. 7 Dependence of the vertical velocity Vz on the height h for a cap-up sphere with non-uniform surface mobility near a circular patch with Rd = Rp. | ||
Turning to the second case (phoretic slip only on the catalytic side), we obtain some intriguing behavior. Specifically, for Da ≫ 1, we find that the curves have negative Vz at low values of h/Rp, but switch over to positive Vz at high values of h/Rp. Accordingly, each of these curves intersect Vz = 0 at some crossover height hc(Da). These crossover points can be identified as hovering states. Since the slope of Vzvs. h at the crossover height in Fig. 7 is positive, the states shown in that figure are unstable against perturbations of the particle height. However, changing bc = 1 to bc = −1 would invert the sign of the velocity Vz, and therefore change the sign of the slope, which would make the hovering states stable against vertical perturbations.
Another intriguing aspect of bi = 0, bc = 1 can be observed for the Da ≫ 1 curves. Specifically, they follow a Vz ∼ (Rp/h)2 power law at intermediate heights, and cross over to a Vz ∼ (Rp/h) power law at large heights. The crossover behavior is especially apparent for Da = 350, shown in Fig. 8. The observed crossover between power laws can rationalized by the far-field perturbation theory developed for Da ≫ 1 in Appendix A. As shown there, in the limit Da → ∞, and for a uniform background concentration of reactant, the product concentration on the cap would be uniform: ![[c with combining tilde]](https://www.rsc.org/images/entities/i_char_0063_0303.gif) (∞)p =
(∞)p = ![[c with combining tilde]](https://www.rsc.org/images/entities/i_char_0063_0303.gif) br(rp) on the cap, where the superscript (∞) indicates the Da → ∞ limit. Therefore, for bc = 1 and bi = 0, there would not be a surface gradient of product concentration on the region of the particle surface with a non-zero phoretic mobility. The particle velocity would therefore be zero. However, in this limit (Da → ∞), the particle can still self-propel if there is a background reactant gradient. Since the background reactant field is sourced by a patch at the origin, the gradient in the vicinity of the particle, ∇cbr|r=rp, decays as ∇cbr|r=rp ∼ (Rp/h)2. Therefore, the contribution to velocity that is leading order in inverse powers of Da is V(∞)z ∼ (Rp/h)2.
br(rp) on the cap, where the superscript (∞) indicates the Da → ∞ limit. Therefore, for bc = 1 and bi = 0, there would not be a surface gradient of product concentration on the region of the particle surface with a non-zero phoretic mobility. The particle velocity would therefore be zero. However, in this limit (Da → ∞), the particle can still self-propel if there is a background reactant gradient. Since the background reactant field is sourced by a patch at the origin, the gradient in the vicinity of the particle, ∇cbr|r=rp, decays as ∇cbr|r=rp ∼ (Rp/h)2. Therefore, the contribution to velocity that is leading order in inverse powers of Da is V(∞)z ∼ (Rp/h)2.
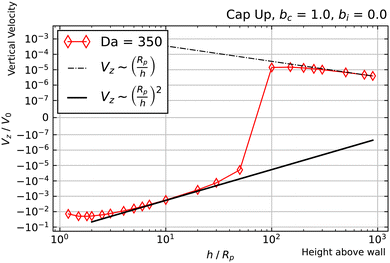 | ||
| Fig. 8 Dependence of Vz on h for a cap-up sphere with bc = 1, bi = 0, and Da = 350. Crossover between two power law scalings is clearly visible. | ||
To complete the picture, we must explain the Vz ∼ Rp/h scaling at h/Rp ≫ 1 and the crossover between the two power laws. Here, we note that there is a subleading ![[scr O, script letter O]](https://www.rsc.org/images/entities/char_e52e.gif) (Da−1) contribution to particle velocity for Da ≫ 1. As detailed in Appendix A, the subleading contribution does give particle motion in a uniform background concentration of reactant. Therefore, the subleading contribution to velocity goes as
(Da−1) contribution to particle velocity for Da ≫ 1. As detailed in Appendix A, the subleading contribution does give particle motion in a uniform background concentration of reactant. Therefore, the subleading contribution to velocity goes as  . Here, the superscript (1) indicates that this contribution to the velocity Vz is
 ![[scr O, script letter O]](https://www.rsc.org/images/entities/char_e52e.gif) (Da−1). For a fixed, finite value of Da, this
(Da−1). For a fixed, finite value of Da, this  scaling will eventually dominate the leading order V(∞)z ∼ (Rp/h)2 scaling for sufficiently large h. The crossover height hc can be estimated from
  , or hc/Rp ∼ Da. In order to test this prediction, we show the crossover height as a function of Da in Fig. 9. We find that a linear relationship does indeed capture the dependence of hc/Rp on Da.
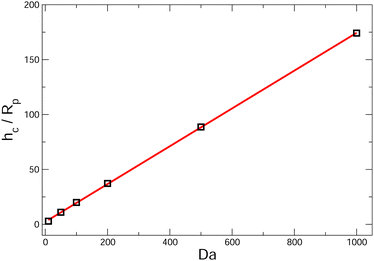 | ||
| Fig. 9 Crossover height hc as a function of Da for a spherical, cap-up Janus particle with bc = 1, bi = 0. The particle is near a circular patch with radius Rd = Rp. We approximate the crossover height by the value where the particle velocity Vz is zero, as seen in the bottom panel of Fig. 7. The red line in the figure is a linear fit hc/Rp = 0.172 Da + 2.253. As discussed in the text, we predict a linear dependence of hc/Rp on Da using perturbation theory. | ||
Our analysis explained the crossover phenomenon mathematically. A physical explanation can be inferred from the “inversion” of the product concentration observed for Da = 100 in Fig. 3. When a particle is close to the patch, it experiences a strong reactant concentration gradient. Therefore, for the diffusion-limited regime (Da ≫ 1), the region of the catalyst near the “equator” has a higher rate of reaction than the region near the “pole,” due to the much greater availability of fuel closer to the patch. This effect explains the importance of the reactant gradient ∇cbr in determining the particle velocity for Da ≫ 1 and h < hc. However, when the particle is far away from the patch, as in Fig. 4, the reactant gradient is much weaker. Therefore, the product concentration field is qualitatively the same as for a particle in a uniform background reactant field, i.e., the maximum is at the pole.
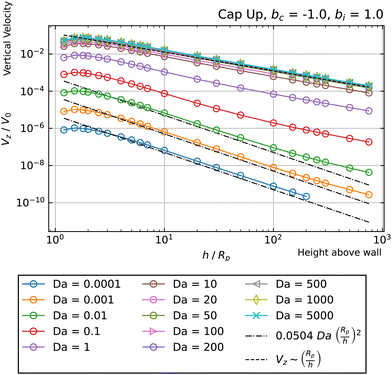
Now we consider a cap-down particle. For bi = −1, bc = 0, shown in Fig. 10, top panel, we obtain a similar behavior with that exhibited by a cap-up configuration with bi = 1 and bc = 0. For bi = 0, bc = −1, shown in Fig. 10, bottom panel, we do not obtain any change in the sign of Vz. Accordingly, there are no hovering states for these parameters. However, for the high Da curves, we still observe a transition from Vz ∼ (Rp/h)2 behavior at intermediate heights h, to Vz ∼ (Rp/h) behavior at large heights h. The Vz ∼ (Rp/h)2 scaling is most evident for the largest value of Da, Da = 5000. This curve follows a Vz ∼ (Rp/h)2 scaling for a broad range of heights, with only a slight deviation for the largest height considered. The transition to Vz ∼ (Rp/h) behavior is clearly evident for curves with 10 ≤ Da ≤ 200.
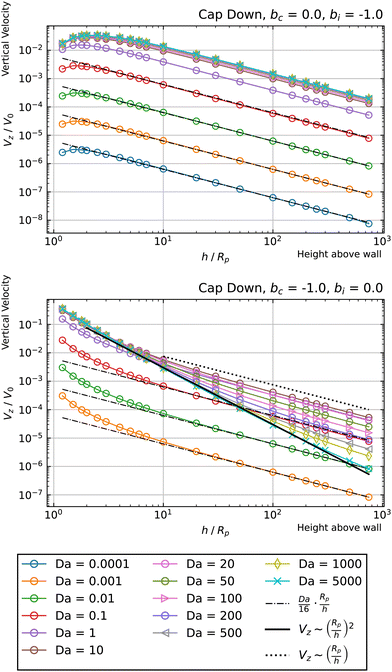 | ||
| Fig. 10 Dependence of the vertical velocity Vz on the height h for a cap-down sphere with non-uniform surface mobility near a circular patch with Rd = Rp. | ||
Having characterized the cases (bi = ±1, bc = 0) and (bi = 0, bc = ±1), we now turn to scenarios in which both parameters are non-zero. As a specific example, Fig. 11 shows Vzvs. h for a cap-up sphere with bi = −0.3 and bc = −1. It can be seen that there is a crossover for all Da ≥ 50. Moreover, the crossover heights are close to the wall: hc/Rp < 10 for each curve with crossover. Thirdly, at crossover, the slope of Vzvs. h is negative, indicating that the hovering state is stable against vertical perturbations. Given these observations, we conclude that bi = −0.3 and bc = −1 are particularly favorable values of the surface mobility for realizing stable hovering states near the wall. Fig. 11 also shows the scaling predicted by eqn (19) for Da ≪ 1.
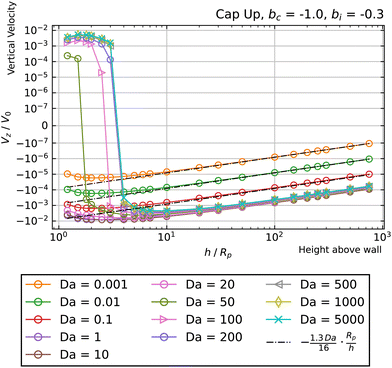 | ||
| Fig. 11 Dependence of the vertical velocity Vz on the height h for a cap-up sphere with bc = −1 and bi = −0.3 near a circular patch with Rd = Rp. | ||
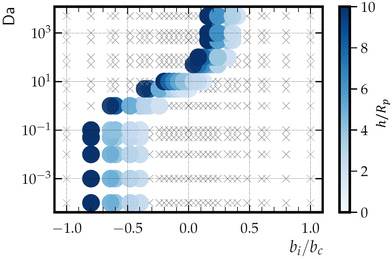
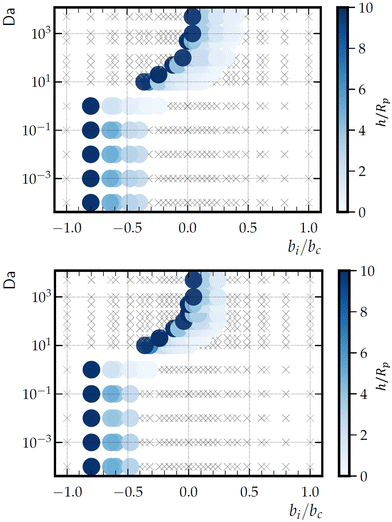
By varying bi and bc and identifying the existence and location of hovering states, we determine a hovering “phase diagram” in the parameter space bi/bc and Da, as shown in Fig. 12 for a cap-up sphere near a circular patch with Rd = Rp. The ratio bi/bc is chosen as the horizontal axis because the sign of bc only affects the vertical stability of the hovering state (i.e., the slope of Vzvs. h at the crossover point), and not the existence of a hovering state. Additionally, the phase diagram is restricted to hovering states that occur for 1 ≤ h/Rp ≤ 10. In comparison with the previously considered case of bi = 0 and bc = 1, for which the hovering state occurred for high values of Da, there are also hovering states for Da < 1 for −1.0 < bi/bc < −0.3. More generally, “low” and “high” Da regimes can be distinguished from Fig. 12 on the basis of two features. The first feature concerns the dependence of the hovering height and phase boundaries on Da. In the low Da regime, there is no such dependence, and the left and right borders of the hovering region are vertical lines. In the high Da regime, hovering height does depend on Da, and the left and right borders are curved. The second feature concerns the dependence on bi/bc. The hovering states in the low Da regime occur at significantly lower bi/bc than the hovering states in the high Da regime. In consideration of these two features, we identify Da ≈ 1 as the border between the low and high Da regimes.
Considering the product concentration field shown in Fig. 3 for low Da (Da = 0.001), it is apparent that the low Da hovering states are not due to the “inversion” effect. Instead, it is likely that they have the same origin as the hovering states demonstrated in ref. 44, i.e., hydrodynamic and chemical interactions with the wall. Note that ref. 44 assumed zeroth-order chemical kinetics, which can be obtained from first-order kinetics in the limit Da → 0. Additionally, ref. 44 considered an inert wall and uniform background concentration of “fuel.” In contrast with the present work, the problem considered in ref. 44 gives hovering states in the range 1.02 ≤ h/Rp ≤ 7 for −1.4 ≲ bi/bc ≲ −0.95 for a Janus sphere that is half covered by catalyst. Therefore, although the Da ≪ 1 hovering states obtained here may have the same physical origin as in ref. 44, we find that sourcing the reactant field with a finite-sized patch can have a significant effect on the range of parameters that give a hovering state. Moreover, we note that the hovering states in ref. 44 are “degenerate” in that they can occur at any position in the plane of the wall (i.e., any x − y position), due to translational symmetry. In the present work, hovering states are localized directly above the patch (x = 0 and y = 0).
We also consider the phase diagrams for other patch sizes: Rd/Rp = 1/3 (Fig. 13, top) and Rd/Rp = 3 (Fig. 13, bottom). The dependencies of the phase behavior on Da and bi/bc described for Rd = Rp remain consistent when varying the patch size. However, there are quantitative differences between all three phase diagrams. Notably, for the smaller patch, there is a larger range of bi/bc that gives a hovering state, for both small and large Da. For the larger patch, the range of bi/bc giving a hovering state at low Da is more narrow than for Rd/Rp = 1. The range at high Da is similar, although shifted to the left.
The “edge case” bi = −bc merits some additional consideration, as a particle with these mobility parameters in a uniform background concentration would be motionless in the limit Da → 0. In other words, Ṽfs = 0. However, recalling that the patch creates a concentration gradient ∇cbr, we expect a scaling law  for Da → 0. We indeed recover this scaling for Da ≪ 1, as shown in Fig. 14. (The numerical prefactor listed in the legend is determined from Tătulea-Codrean and Lauga.36) For high Da, there is no reason to expect these mobility parameters to give zero velocity in a uniform reactant field, and we indeed obtain a
  scaling for Da ≫ 1. For intermediate values of Da, there is crossover between the two scaling laws:
  for small h/Rp, and
  for large h/Rp. This crossover is evident even for Da as low as Da = 0.001. Given previous results on crossover, we expect this crossover to result from a competition between leading and subleading terms, although in this case for an expansion in powers of Da, instead of inverse powers of Da. We defer a more detailed examination to later work.
4 Discussion
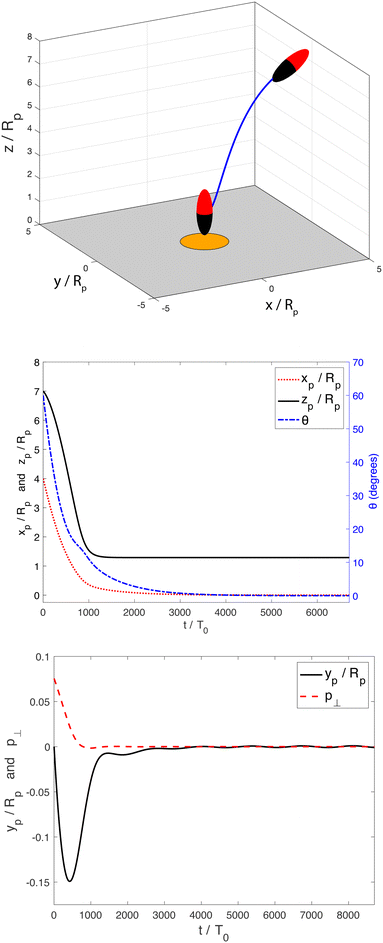
Our analysis has focused on the dynamics for an axisymmetric configuration of the particle and the patch. A logical next step would be to investigate general three-dimensional motion. In particular, for the hovering states, an important question is whether they are stable against general three-dimensional perturbations, such as displacement lateral to the patch axis, or rotation of the particle axis away from the ẑ direction.As a first step towards this direction of investigation, we show in Fig. 15 an example of a three-dimensional trajectory, computed using the BEM and a quaternion-based rigid-body dynamics method57 (see Appendix C for a brief discussion of this method). This demonstrates that a prolate spheroid with phoretic mobilities bi = −0.4 and bc = −1, Damköhler number Da = 100, and aspect ratio re = 1/3 is attracted to the hovering state from an arbitrarily chosen initial position and orientation. The initial position of the particle (xp/Rp = 4, yp/Rp = 0, and zp/Rp = 7) is located off the patch axis. Additionally, the initial particle orientation is neither aligned with the patch axis, nor with the plane defined by the patch axis and the patch-to-particle vector. Specifically, the initial orientation of the spheroid is θ = 60° and φ = 5°. Here, θ is the angle between the particle orientation vector ![[p with combining circumflex]](https://www.rsc.org/images/entities/b_char_0070_0302.gif) and ẑ, where
and ẑ, where ![[p with combining circumflex]](https://www.rsc.org/images/entities/b_char_0070_0302.gif) is defined to point from the inert pole (black) to catalytic pole (red) of the particle. The quantity φ is the angle between
is defined to point from the inert pole (black) to catalytic pole (red) of the particle. The quantity φ is the angle between ![[p with combining circumflex]](https://www.rsc.org/images/entities/b_char_0070_0302.gif) and
and ![[x with combining circumflex]](https://www.rsc.org/images/entities/b_char_0078_0302.gif) . Accordingly, all potential symmetries of the patch-and-particle configuration are broken. Despite this fact, the particle is able to steer to the patch, align its axis with the patch normal, and remain in the hovering state for the rest of the simulation. Fig. 15 shows the rod trajectory and the time evolution of its configuration. Since the azimuthal angle φ is not well-defined when θ = 0, we use p⊥ =
. Accordingly, all potential symmetries of the patch-and-particle configuration are broken. Despite this fact, the particle is able to steer to the patch, align its axis with the patch normal, and remain in the hovering state for the rest of the simulation. Fig. 15 shows the rod trajectory and the time evolution of its configuration. Since the azimuthal angle φ is not well-defined when θ = 0, we use p⊥ = ![[p with combining circumflex]](https://www.rsc.org/images/entities/b_char_0070_0302.gif) ·(ẑ ×
·(ẑ × ![[r with combining circumflex]](https://www.rsc.org/images/entities/b_char_0072_0302.gif) p) to characterize the component of the orientation vector
p) to characterize the component of the orientation vector ![[p with combining circumflex]](https://www.rsc.org/images/entities/b_char_0070_0302.gif) that is out of the plane defined by the patch normal ẑ and the particle position rp. Here,
that is out of the plane defined by the patch normal ẑ and the particle position rp. Here, ![[r with combining circumflex]](https://www.rsc.org/images/entities/b_char_0072_0302.gif) p = rp/|rp|.
p = rp/|rp|.
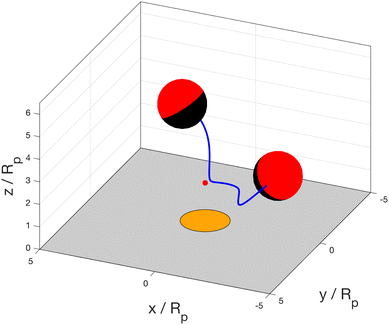
Interestingly, for spheres, we did not observe this long-time stability for any of the parameters tested. For some parameters, we found that the spheres could initially steer themselves towards the hovering state, but subsequently exhibited a slow drift away from the patch axis over a longer timescale. An example trajectory, illustrating such a behavior, is shown in Fig. 16. This observation suggests that shape may have a crucial role in promoting stable “docking,” most likely by a tendency for elongated particles to align with nonlinear gradients.58 In future work, we will undertake a systematic examination of the three-dimensional linear stability of the hovering state as a function of particle aspect ratio, Da, and surface mobilities. This examination will settle whether slender shape and a high value of Da are indeed necessary conditions for three-dimensional stability.
Throughout this manuscript, we have neglected the effect of thermal fluctuations. The stiffness of the hovering states with respect to perturbations in vertical position can be quantified by evaluating the slope of the Vz/V0vs. h/Rp curve at the hovering height. Specifically, denoting the slope by m, the characteristic relaxation time for vertical perturbations is τ = Rp/|m|V0. For Da = 50 and surface mobility parameters bi = −0.3 and bc = −1, we obtain |m| ≈ 0.0017 (Fig. 11). For comparison with experiments, we consider a particle with Rp = 2.5 μm that typically moves with speed V = 9 μm s−1 in a uniform background concentration of molecular “fuel.”3,59 Numerically, we obtain that V ≈ 0.1V0 for Da = 50, and thus τ ≈ 16 s. This relaxation time can be compared against the characteristic timescale for translational diffusion, τt = Rp2/D = 6πμRp3/kBT, where D is the diffusion coefficient of the particle, and the second equality assumes a spherical particle. In ref. 44, τt was calculated as τt ≈ 70 s. Since τ < τt, we expect the hovering state to be robust against thermal fluctuations in the vertical direction. Similar arguments can be made for a hovering state with a small value of Da. For example, for Da = 0.1, bi = 0.5, and bc = −1, and using the same dimensional particle radius and speed as before, we obtain V ≈ 0.006V0 and |m| ≈ 0.0003, giving τ ≈ 6 s (i.e., this state is even more robust against thermal fluctuation, as the relaxation back to hovering happens on even shorter timescales than in the large Da example.) Future work on three-dimensional motion can address stability against translational diffusion in a horizontal direction, as well as stability against rotational diffusion.
Although we observed hovering states over a wide range of Da, from Da = 0.0001 to Da = 5000, our detailed analysis (Appendix A) largely focused on the high Da regime. This focus was driven by the novelty of the patch-induced “concentration inversion” mechanism for inducing near-wall hovering states. In comparison, the low Da hovering states are most likely due to chemical and hydrodynamic interactions with the wall. Comparatively, this latter mechanism is rather well-known, and can be analyzed using singular solutions to the Laplace and Stokes equations (including image singularities to account for the presence of the wall).44,60 Future work could take this approach, building on our eqn (19), to obtain mechanistic insight into low Da hovering.
5 Conclusions
We have investigated the motion of a catalytic Janus particle activated by a patch that continuously releases reactant (“fuel”). The patch has an axisymmetric shape and finite size, and is located on a solid planar wall that confines the liquid solution. The Janus particle has a spherical or spheroidal shape and an axisymmetric distribution of catalyst. Our model explicitly resolves transport of the fuel to the particle from the patch and its local consumption and depletion by the particle. We have shown that, under certain conditions of Damköhler number Da (dimensionless rate of reaction), phoretic mobility (chemi-osmotic response of the particle), patch size, and other parameters (e.g., shape of the particle), there is a “hovering” state in which the particle remains motionless at a certain height above the patch. In the hovering state, the particle position is directly above the center of the patch, and the particle's axis of symmetry is aligned with the wall normal. Depending on the system parameters, this hovering state can be stable against perturbations of the particle position in the vertical direction. By using perturbation theory, we systematically examined the dependence of the hovering height on Da for high Damköhler number.Our study focused on an axisymmetric configuration of the particle and patch. However, we laid the groundwork for consideration of general three-dimensional motion, and demonstrated that the hovering state can be stable against general three-dimensional perturbations. Specifically, we demonstrated that a particle with arbitrary initial orientation and position can steer to a chemical patch, i.e., exhibit chemotaxis. Three-dimensional motion would therefore be a natural direction for continuation of our work. This direction could address the phase diagram for three-dimensional stability of the hovering states, as well as how the system parameters can be tuned to enlarge the basin of stability, i.e., enlarge the range of initial orientations and positions from which a particle will be attracted to the hovering state. Continuation of our study could also probe the possible existence of other dynamical fixed points, such as continuous “sliding” along the edge of a circular patch. This sliding would be analogous to the orbiting observed for active colloids near geometric obstacles.59,61,62 One can also imagine hovering states that are shifted away from the center of the patch. In this scenario, axisymmetry would imply that there is a continuous ring of degenerate hovering states. For a non-axisymmetric patch, such as a square or star-shaped patch, there could be hovering states at a discrete set of spatial positions. Three-dimensional Brownian motion of the colloid can also be straightforwardly included in the framework of our model.29,63
Our results for a particle near a patch-decorated planar wall may have implications for bound pair formation or “docking” of two freely suspended colloidal particles.64–66 We recall that a planar wall can be regarded as a sphere with infinite radius of curvature. To our knowledge, a situation in which a reactant source is localized to one particle, and a catalytic region to a second particle, has not previously been considered in the literature, especially for first-order kinetics. Temporal variation of the rate of release for a particle/particle system could be exploited for temporally sequenced cargo pick-up and release.67 Incorporation of additional chemical species and/or nonlinear chemical kinetics in our framework could allow for realization of more complex particle behaviors.68
Finally, our findings may provide conceptual and technical guidance for advanced applications involving active colloids. In lab-on-a-chip systems, a chemical patch with a time-varying rate of release could be used for programmed “trap-and-release” of an active colloid. A planar surface decorated with many patches could template assembly of an active colloidal crystal. In materials science applications, a material that is impregnated with reactant, and which releases the reactant upon damage, could recruit active colloids to the damage site.69 (Alternatively, the scenario can be that of locating corrosion spots on metal surfaces.) Additionally, for drug delivery applications, the chemical patch in this study could model an in vivo biological source of reactant.6 A stably hovering particle that continuously releases a drug would provide a highly concentrated and localized dose. For biomedical applications, future consideration of aspects such as those of a non-Newtonian carrier fluid70 or the effect of ambient flow29 would enhance the realism of our model. One could also consider a patch embedded in a fluid–fluid interface or a bilayer membrane as a model for binding sites at biological interfaces.71
Author contributions
Author contributions are defined based on the CRediT (contributor roles taxonomy) and listed alphabetically. Conceptualization: M. N. P. and W. E. U. Formal analysis: M. N. P., V. M., and W. E. U. Funding acquisition: W. E. U. Investigation: M. N. P., V. M., and W. E. U. Methodology: M. N. P., V. M., and W. E. U. Project administration: W. E. U. Software: M. N. P., V. M., and W. E. U. Supervision: M. N. P. and W. E. U. Validation: M. N. P., V. M., and W. E. U. Visualization: V. M. and W. E. U. Writing – original draft: M. N. P., V. M., and W. E. U. Writing – review and editing: M. N. P., V. M., and W. E. U.Data availability
The authors confirm that the data supporting the findings of this study are available within the article. Additional supporting data, such as numerical data corresponding to the data presented in the figures, is available upon request to the corresponding authors.Conflicts of interest
There are no conflicts to declare.Appendices
A. High Da expansion
We expand the (dimensionless) reactant field for Da ≫ 1 as follows: | (20) |
The governing equation  becomes
 | (21) |
![[c with combining tilde]](https://www.rsc.org/images/entities/i_char_0063_0303.gif) (…)r obeys Laplace's equation. The boundary condition on the catalytic cap becomes
(…)r obeys Laplace's equation. The boundary condition on the catalytic cap becomes | (22) |
![[scr O, script letter O]](https://www.rsc.org/images/entities/char_e52e.gif) (Da), we obtain
(Da), we obtain ![[c with combining tilde]](https://www.rsc.org/images/entities/i_char_0063_0303.gif) (∞)r = 0 on the catalytic cap. We also note the boundary condition on the cap for the subleading problem, obtained at
(∞)r = 0 on the catalytic cap. We also note the boundary condition on the cap for the subleading problem, obtained at ![[scr O, script letter O]](https://www.rsc.org/images/entities/char_e52e.gif) (1) as
(1) as  .
.
On the inert side of the particle, we have
 | (23) |
![[c with combining tilde]](https://www.rsc.org/images/entities/i_char_0063_0303.gif) (…)r, we obtain the no-flux boundary condition
(…)r, we obtain the no-flux boundary condition  on the inert face.
The boundary conditions for ![[c with combining tilde]](https://www.rsc.org/images/entities/i_char_0063_0303.gif) (∞)r on the wall and at infinity are the same as given for
(∞)r on the wall and at infinity are the same as given for ![[c with combining tilde]](https://www.rsc.org/images/entities/i_char_0063_0303.gif) r in Section 3. Therefore, the inhomogeneity in the boundary condition on the wall for
r in Section 3. Therefore, the inhomogeneity in the boundary condition on the wall for ![[c with combining tilde]](https://www.rsc.org/images/entities/i_char_0063_0303.gif) r is accounted for in the leading order problem. For all i ≥ 1, the boundary condition on the wall is
r is accounted for in the leading order problem. For all i ≥ 1, the boundary condition on the wall is  , and the boundary condition at infinity is
 ![[c with combining tilde]](https://www.rsc.org/images/entities/i_char_0063_0303.gif) (i)r = 0.
(i)r = 0.
Thus, we have a well-defined boundary value problem for ![[c with combining tilde]](https://www.rsc.org/images/entities/i_char_0063_0303.gif) (∞)r, with so-called mixed boundary conditions on the JP51 (i.e., Dirichlet on the cap and Neumann on the inert face.)
(∞)r, with so-called mixed boundary conditions on the JP51 (i.e., Dirichlet on the cap and Neumann on the inert face.)
Now we turn to the product concentration. Again, we expand as follows:
 | (24) |
![[c with combining tilde]](https://www.rsc.org/images/entities/i_char_0063_0303.gif) (…)p obeys Laplace's equation. The boundary condition on the catalytic cap becomes
(…)p obeys Laplace's equation. The boundary condition on the catalytic cap becomes | (25) |
![[scr O, script letter O]](https://www.rsc.org/images/entities/char_e52e.gif) (Da), we recover the previous result that
(Da), we recover the previous result that ![[c with combining tilde]](https://www.rsc.org/images/entities/i_char_0063_0303.gif) ∞r = 0 on the catalytic face. At
∞r = 0 on the catalytic face. At ![[scr O, script letter O]](https://www.rsc.org/images/entities/char_e52e.gif) (1), we have
(1), we have  on the cap. This boundary condition can be simplified to remove dependence on the subleading term
 ![[c with combining tilde]](https://www.rsc.org/images/entities/i_char_0063_0303.gif) (1)r. From eqn (22), we obtain
(1)r. From eqn (22), we obtain  on the cap. Therefore, the leading order term in the product flux on the cap can be obtained from the solution of the boundary value problem for
 ![[c with combining tilde]](https://www.rsc.org/images/entities/i_char_0063_0303.gif) (∞)r as
(∞)r as  . This result makes intuitive sense on physical grounds; consumption of reactant molecules entails corresponding production of product molecules. Similarly, we can obtain
  on the cap.
On the inert side of the particle, we have
 | (26) |
 on the inert side for all fields c(…)p. The boundary conditions on the wall and infinity for all fields
 ![[c with combining tilde]](https://www.rsc.org/images/entities/i_char_0063_0303.gif) (..)p are no-flux at the wall and vanishing concentration at infinity.
(..)p are no-flux at the wall and vanishing concentration at infinity.
Thus, we have obtained a boundary value problem for ![[c with combining tilde]](https://www.rsc.org/images/entities/i_char_0063_0303.gif) (∞)p with Neumann conditions on both sides of the JP, with the prescribed product flux on the catalytic cap obtained from the solution to the problem for
(∞)p with Neumann conditions on both sides of the JP, with the prescribed product flux on the catalytic cap obtained from the solution to the problem for ![[c with combining tilde]](https://www.rsc.org/images/entities/i_char_0063_0303.gif) (∞)r.
(∞)r.
The product concentration gradient determines the particle velocity. We define
| Vz = V(∞)z + V(1)z + V(2)z + … | (27) |
At this point, we have established that, in the limit Da → ∞, the rate of production of product molecules on the cap  no longer depends on Da. This result entails that, for a given set of mobility parameters, the Vzvs. h/Rp curves for different values of Da should collapse onto a universal curve as Da → ∞. This is observed for Da ≫ 1 curves in various figures (e.g., Fig. 5), although the values of Da for which collapse is observed depends on the mobility parameters. Additionally, for some mobility parameters, collapse of a Da curve may occur over a limited range of heights h. For instance, in Fig. 10, collapse is observed at lower values of h/Rp. The curves with higher Da exhibit collapse for a larger range of h/Rp.
A.1 Uniform phoretic mobility
For the case of uniform phoretic mobility, we can obtain the scaling law for the universal curve, including the numerical prefactor, through the following arguments. We approximate the JP as being in unconfined solution, immersed in a uniform background concentration![[c with combining tilde]](https://www.rsc.org/images/entities/i_char_0063_0303.gif) br(
br(![[r with combining tilde]](https://www.rsc.org/images/entities/b_char_0072_0303.gif) p). We use the approximation in eqn (16) for the background reactant concentration. In dimensionless form, we have
p). We use the approximation in eqn (16) for the background reactant concentration. In dimensionless form, we have | (28) |
![[c with combining tilde]](https://www.rsc.org/images/entities/i_char_0063_0303.gif) (∞)r:
(∞)r:  in the solution,
 ![[c with combining tilde]](https://www.rsc.org/images/entities/i_char_0063_0303.gif) (∞)r(
(∞)r(![[r with combining tilde]](https://www.rsc.org/images/entities/b_char_0072_0303.gif) ) →
) → ![[c with combining tilde]](https://www.rsc.org/images/entities/i_char_0063_0303.gif) br(
br(![[r with combining tilde]](https://www.rsc.org/images/entities/b_char_0072_0303.gif) p) as |
p) as |![[r with combining tilde]](https://www.rsc.org/images/entities/b_char_0072_0303.gif) −
− ![[r with combining tilde]](https://www.rsc.org/images/entities/b_char_0072_0303.gif) p| → ∞,
p| → ∞,  on the inert side of the JP, and
 ![[c with combining tilde]](https://www.rsc.org/images/entities/i_char_0063_0303.gif) (∞)r = 0 on the catalytic cap. This is the boundary value problem formulated by Davis and Yariv for a sphere in the Da → ∞ limit in ref. 50. They obtain the coefficients Bn in a harmonic expansion,
(∞)r = 0 on the catalytic cap. This is the boundary value problem formulated by Davis and Yariv for a sphere in the Da → ∞ limit in ref. 50. They obtain the coefficients Bn in a harmonic expansion,  . Here,
 ![[r with combining tilde]](https://www.rsc.org/images/entities/b_char_0072_0303.gif) = |
= |![[r with combining tilde]](https://www.rsc.org/images/entities/b_char_0072_0303.gif) −
− ![[r with combining tilde]](https://www.rsc.org/images/entities/b_char_0072_0303.gif) p| denotes distance from the JP center, non-dimensionalized by Rp; Pn(x) is the Legendre polynomial of degree n; and θ denotes polar angle in a spherical coordinate system with its origin at the particle center. The polar angle θ is measured with respect to a vector pointing from the inert pole of the JP to the catalytic pole.
p| denotes distance from the JP center, non-dimensionalized by Rp; Pn(x) is the Legendre polynomial of degree n; and θ denotes polar angle in a spherical coordinate system with its origin at the particle center. The polar angle θ is measured with respect to a vector pointing from the inert pole of the JP to the catalytic pole.
Davis and Yariv also obtain the Janus particle velocity for the case of a sphere with uniform phoretic mobility.50 However, they assume – in contrast with the present manuscript – that the slip velocity is driven by the surface gradient of the reactant concentration, and not by the gradient of a product concentration. Since the product concentration field obeys Neumann conditions over the whole surface of the JP, we cannot immediately use this result. However, if we write the product concentration field as  , we obtain that An = −Bn for all n. Therefore, their result that V(∞)z/V0 = ±0.3
![[c with combining tilde]](https://www.rsc.org/images/entities/i_char_0063_0303.gif) br(
br(![[r with combining tilde]](https://www.rsc.org/images/entities/b_char_0072_0303.gif) p) applies here. (The sign of the velocity is determined by the cap-up or cap-down character of the particle.) We therefore obtain that
p) applies here. (The sign of the velocity is determined by the cap-up or cap-down character of the particle.) We therefore obtain that  as Da → ∞. Aside from the sign, this result is independent of the cap-up or cap-down character of the particle, since it was obtained using the approximation of a uniform background concentration of reactant.
A.2 Crossover behavior for bc = 1, bi = 0
Here, we consider the case bc = 1 and bi = 0, which gives a crossover between two scaling laws.In order to obtain this crossover, we argue that, at leading order in Da as Da → ∞, the particle velocity is zero for a uniform background concentration of reactant. The reason is the following. We recall that in the leading order problem, i.e., the problem for ![[c with combining tilde]](https://www.rsc.org/images/entities/i_char_0063_0303.gif) (∞)r, the boundary condition on the catalytic cap is
(∞)r, the boundary condition on the catalytic cap is ![[c with combining tilde]](https://www.rsc.org/images/entities/i_char_0063_0303.gif) (∞)r = 0. Additionally, assuming a uniform background concentration of reactant
(∞)r = 0. Additionally, assuming a uniform background concentration of reactant ![[c with combining tilde]](https://www.rsc.org/images/entities/i_char_0063_0303.gif) br(
br(![[r with combining tilde]](https://www.rsc.org/images/entities/b_char_0072_0303.gif) p), and neglecting the confining wall, we recall that
p), and neglecting the confining wall, we recall that ![[c with combining tilde]](https://www.rsc.org/images/entities/i_char_0063_0303.gif) (∞)r and
(∞)r and ![[c with combining tilde]](https://www.rsc.org/images/entities/i_char_0063_0303.gif) (∞)p can be written as harmonic expansions, with the coefficients related by An = −Bn. Since
(∞)p can be written as harmonic expansions, with the coefficients related by An = −Bn. Since ![[c with combining tilde]](https://www.rsc.org/images/entities/i_char_0063_0303.gif) (∞)r = 0 on the cap, the coefficients Bn are such as to precisely cancel the background concentration
(∞)r = 0 on the cap, the coefficients Bn are such as to precisely cancel the background concentration ![[c with combining tilde]](https://www.rsc.org/images/entities/i_char_0063_0303.gif) br(
br(![[r with combining tilde]](https://www.rsc.org/images/entities/b_char_0072_0303.gif) p) on the cap. In other words, on the catalytic cap,
p) on the cap. In other words, on the catalytic cap,  . From An = −Bn, it follows that, on the catalytic cap,
  .
.
At this point, we have obtained that the product concentration on the cap is uniform as Da → ∞, for a uniform background concentration of reactant. In the case bc = 1, bi = 0, only the cap is osmotically responsive, i.e., we can only have slip on the cap. However, since the slip is proportional to the surface gradient of product concentration, we obtain that the slip is zero over the entire surface of the particle. Therefore, to leading order in Da as Da → ∞, the particle does not move in a uniform background concentration of reactant.
However, we can still obtain motion in the leading order problem by considering the role of the second term in eqn (17), which represents a linear gradient in the background reactant concentration. At leading order, the reactant concentration can be written as  . We still have the boundary conditions
 ![[c with combining tilde]](https://www.rsc.org/images/entities/i_char_0063_0303.gif) (∞)r = 0 on the catalytic cap and
(∞)r = 0 on the catalytic cap and  on the inert face. Therefore, the values of Cn must be such as to cancel the linearly varying background reactant concentration on the catalytic face. Concerning the product concentration, we can write this field as
  , with the same boundary conditions as before. By the same arguments, we obtain Dn = −Cn. Therefore, the product concentration varies with position on the catalytic face. This spatial variation is sufficient to give motion of the particle when bc = 1 and bi = 0. Since the background gradient
  decays as (Rp/h)2, we obtain that V(∞)z/V0 ∼ (Rp/h)2. The sign will depend on the cap-up or cap-down character of the particle, since the linear gradient in background reactant concentration is not isotropic.
We briefly argue that the subleading problem will give a contribution to velocity V(1)z/V0 ∼ Da−1(Rp/h). Approximating the JP as being in unconfined solution, we have the boundary condition ![[c with combining tilde]](https://www.rsc.org/images/entities/i_char_0063_0303.gif) (1)r(
(1)r(![[r with combining tilde]](https://www.rsc.org/images/entities/b_char_0072_0303.gif) ) → 0 as |
) → 0 as |![[r with combining tilde]](https://www.rsc.org/images/entities/b_char_0072_0303.gif) −
− ![[r with combining tilde]](https://www.rsc.org/images/entities/b_char_0072_0303.gif) p| → ∞, and we write
p| → ∞, and we write  . We recall that the boundary conditions on the JP are
  on the catalytic cap, and
  on the inert face. This is a mixed boundary value problem, giving the dual series equations
  on the catalytic face, and
  on the inert face, where the Bn are known from solution of the leading order problem. Now, for the particle to remain motionless, the reactant field must take a constant value on the catalytic face. We recall that the coefficients Bn give a constant value of the reactant on the catalytic face and no-flux on the inert face. By uniqueness of solutions to linear equations, we deduce that En = αBn. (The constant α is included to allow for the scenario in which
 ![[c with combining tilde]](https://www.rsc.org/images/entities/i_char_0063_0303.gif) (∞)r and
(∞)r and ![[c with combining tilde]](https://www.rsc.org/images/entities/i_char_0063_0303.gif) (1)r take different uniform values on the cap.) However, from the dual series equations, it is clear that En cannot be a constant multiple α of Bn: En ≠ αBn. Therefore, the field
(1)r take different uniform values on the cap.) However, from the dual series equations, it is clear that En cannot be a constant multiple α of Bn: En ≠ αBn. Therefore, the field ![[c with combining tilde]](https://www.rsc.org/images/entities/i_char_0063_0303.gif) (1)r cannot take a uniform value on the cap and also satisfy the no-flux boundary condition on the inert face. Since the field
(1)r cannot take a uniform value on the cap and also satisfy the no-flux boundary condition on the inert face. Since the field  , where Fn = −En, it follows that
 ![[c with combining tilde]](https://www.rsc.org/images/entities/i_char_0063_0303.gif) (1)p is non-uniform on the cap. Therefore, in the subleading problem, the particle can move in a uniform background reactant concentration. We thus obtain V(1)z/V0 ∼ Da−1(Rp/h).
(1)p is non-uniform on the cap. Therefore, in the subleading problem, the particle can move in a uniform background reactant concentration. We thus obtain V(1)z/V0 ∼ Da−1(Rp/h).
B. Solution in bipolar coordinates
Since the set-up considered in this study possesses axial symmetry and involves Laplace or Stokes equations with boundary conditions on a sphere and on a wall, an analytic solution in terms of series in bipolar coordinates is possible as discussed in the followings. The bipolar coordinates solution will then be used for cross-check and validation of the results obtained with the BEM method in a couple of examples.B.1 Bipolar coordinates. Parametrization of the set-up
The bipolar coordinates (ξ,η) with −∞ < ξ < ∞ and 0 ≤ η ≤ π are defined via the cylindrical coordinates z ≥ 0 and s ≥ 0 (the distance from the z-axis) as72,73 | (29) |
 | (30) |
| ξ0 = arccosh(h/Rp). | (31) |
The metric factors, which enter in the calculation of gradients and area elements (e.g., ∇ = eξgξ−1∂ξ + eηgη−1∂η + eϕgϕ−1∂ϕ), are given by
 | (32) |
In terms of the bipolar coordinates system introduced above, the plane z = 0 of the wall corresponds to ξ = 0, while the surface at infinity is parametrized by ξ = 0, η = 0 (ω = 1). The activity distribution K(s) ↦ K(ω) is calculated by noting that ξ = 0, s = 0 (the center of the patch) corresponds to η = π (ω = −1) while ξ = 0, s = Rd (the circumference of the patch) corresponds to
 | (33) |
 | (34) |
Similarly, the activity distribution f(rJ) ↦ f(ω), where rJ denotes positions on the surface of the Janus particle, is calculated by noting that: (i) the “south” pole (s = 0, z = h − R) corresponds to (ξ = ξ0, ω = −1), (ii) the “north” pole (s = 0, z = h + R) corresponds to ξ = ξ0, ω = +1; and (iii) the “equator” {s = R, z = h} corresponds to ξ = ξ0,
ωe = (cosh![[thin space (1/6-em)]](https://www.rsc.org/images/entities/char_2009.gif) ξ0)−1 = Rp/h. ξ0)−1 = Rp/h. | (35) |
 | (36) |
B.2 The disturbance concentration of reactant, cdr(r), in bipolar coordinates
The disturbance field cdr is the solution of Laplace equation subject to a vanishing field BC at infinity, the Robin BC at the surface of the particle expressed in eqn (7), and the zero normal current BC at the wall (the activity at the patch being accounted for by the BC on cbr). In bipolar coordinates, the solution of the Laplace equation obeying the vanishing BC at infinity can be expressed in terms of the Legendre polynomials Pn as74 | (37) |
 | (38) |
| An = 0, n ≥ 0. | (39) |
 | (40) |
 | (41) |
 | (42) |
 | (43) |
For the results presented in the manuscript we have used Nmax = 10 and numerically solved the system using the software Mathematica (version 14.0); this was sufficient to pass the cross-check against the corresponding BEM results (see the good agreement between the two shown by the results in Fig. 17.) If very accurate calculations of the concentrations are needed, additional analytical manipulations of the equations derived above may be necessary, as discussed by ref. 75.
B.3 Concentration of product in bipolar coordinates
Similarly with the case of the boundary value problem for the disturbance density field, the solution of the Laplace equation for the density of product, accounting for the BC at infinity (vanishing concentration) and for the BC at the wall (zero normal current), is expressed as | (44) |
with
![[c with combining tilde]](https://www.rsc.org/images/entities/i_char_0063_0303.gif) r(r) := cr(r)/C0 and
r(r) := cr(r)/C0 and![[scr D, script letter D]](https://www.rsc.org/images/entities/char_e523.gif) := Dr/Dp, := Dr/Dp, | (45) |
 | (46) |
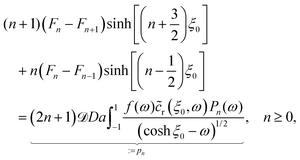 | (47) |
![[c with combining tilde]](https://www.rsc.org/images/entities/i_char_0063_0303.gif) r(ξ0,ω;Da) is a known function (calculated in the previous section), the quantity pn in the rhs is known (as also noted in the previous subsections, additional analytical simplifications may be possible, see ref. 51) and eqn (47) turns into an infinite system of linear equations. The system is solved by truncating at sufficiently large n, i.e., by setting Fn>Nmax = 0 and by employing the auxiliary variable rn = Fn − Fn−1: at n = 0 one directly obtains r0, and then the rn is solved recurrently. The Fns are then obtained by first summing up all the rn>0, which gives F0, and subsequently rn by recurrence from their definition and the known rn. This concludes the derivation of the density cp(r) of product molecules. As for the disturbance of the reactant concentration, the results are validated by the cross-check against the corresponding BEM results. We again find very good agreement between the two methods (detailed results are omitted for brevity.)
r(ξ0,ω;Da) is a known function (calculated in the previous section), the quantity pn in the rhs is known (as also noted in the previous subsections, additional analytical simplifications may be possible, see ref. 51) and eqn (47) turns into an infinite system of linear equations. The system is solved by truncating at sufficiently large n, i.e., by setting Fn>Nmax = 0 and by employing the auxiliary variable rn = Fn − Fn−1: at n = 0 one directly obtains r0, and then the rn is solved recurrently. The Fns are then obtained by first summing up all the rn>0, which gives F0, and subsequently rn by recurrence from their definition and the known rn. This concludes the derivation of the density cp(r) of product molecules. As for the disturbance of the reactant concentration, the results are validated by the cross-check against the corresponding BEM results. We again find very good agreement between the two methods (detailed results are omitted for brevity.)
B.4 Velocity of the particle in terms of bipolar coordinates
The calculation of the velocity of the particle, which has a prescribed phoretic slip actuation vs(r) on its surface, near a no-slip wall follows from the expression, eqn (15), derived via the Lorentz reciprocal theorem. Since this calculation has been discussed in detail by ref. 77 and 78, here we provide only a succinct description.Owing to the symmetry of the system, only motion along the z-axis occurs; accordingly, only one auxiliary problem is needed in eqn (15), and this is chosen as the motion of a chemically inert spherical particle, of same radius Rp and located at the same height h with velocity V′ = V′ez. This was studied by ref. 73, which provides the force Fa in the form of the well-known wall-correction of the Stokes formula and outlines the solution for the hydrodynamic flow in terms of a stream function Ψa(ξ,ω := cos![[thin space (1/6-em)]](https://www.rsc.org/images/entities/char_2009.gif) η) = V′Rp2ψa(ξ,ω), where 0 ≤ ξ ≤ ξ0 while ψa(ξ,ω) is dimensionless, which admits the series representation in bipolar coordinates as:73,74
η) = V′Rp2ψa(ξ,ω), where 0 ≤ ξ ≤ ξ0 while ψa(ξ,ω) is dimensionless, which admits the series representation in bipolar coordinates as:73,74
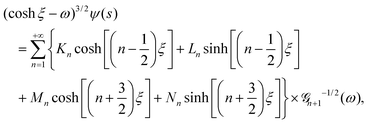 | (48) |
 | (49) |
The phoretic slip velocity in the rhs of eqn (15) is given by
 | (50) |
Since the unit vector along the direction normal to the surface of the particle is n = −eξ, the integrand in the rhs of eqn (15) will involve only the contraction eξ·σa·eη of the shear stress tensor of the auxiliary problem with the unit vectors eξ,η, evaluated at ξ = ξ0. This contraction is given by (see also ref. 78),
 | (51) |
 of the auxiliary problem, which are needed for the calculation of the contraction, are in turn evaluated from the stream function of the auxiliary problem as (see Chapter 4-4 in ref. 72)
 | (52) |
After performing the derivatives analytically, the integral in the rhs of eqn (15) is computed numerically and the integrand is approximated by truncating the series representations corresponding to the phoretic slip and of the stress-tensor contraction to the first Nmax = 30 terms, which seems sufficient as long as h/Rp ≳ 1.1.
In Fig. 18, we show the velocity of a cap-up sphere with non-uniform surface mobility near a circular patch with radius Rd = Rp, computed with the boundary element method and using bipolar coordinates. The two methods show close quantitative agreement for the range of h/Rp and values of Da shown. The system defined by truncating eqn (47) to n equations is observed to have slow convergence with n for larger h/Rp and higher Da. Accordingly, we use the BEM for velocity data shown in Section 3.
C Rigid-body dynamics method
We briefly describe the quaternion-based simulation method, modified from Theers et al.,57 used to obtain three-dimensional trajectories. The particle orientation is encoded by a quaternion q = (q0,q1,q2,q3) of unit length. In each simulation, the initial value of q is set as q(0) = (1,0,0,0). The particle orientation vector![[p with combining circumflex]](https://www.rsc.org/images/entities/b_char_0070_0302.gif) (t) at an arbitrary time t can be obtained from the initial orientation vector
(t) at an arbitrary time t can be obtained from the initial orientation vector ![[p with combining circumflex]](https://www.rsc.org/images/entities/b_char_0070_0302.gif) (0) according to
(0) according to ![[p with combining circumflex]](https://www.rsc.org/images/entities/b_char_0070_0302.gif) (t) = DT·
(t) = DT·![[p with combining circumflex]](https://www.rsc.org/images/entities/b_char_0070_0302.gif) (0), where the 3 × 3 matrix D(q) is given by eqn (14) in Theers et al.
(0), where the 3 × 3 matrix D(q) is given by eqn (14) in Theers et al.
The trajectory of a particle is obtained as follows. At each simulation timestep, we use the BEM to compute the particle's translational velocity V(t) and angular velocity Ω(t), which depend on the particle's instantaneous position rp(t) and orientation q(t). The position and orientational quaternion are then integrated forward in time using a predictor-corrector Euler method with timestep Δt:
| rp(t + Δt) = rp(t) + V(t)Δt, | (53) |
 | (54) |
| q(t + Δt) = q* + λqq(t). | (55) |
 | (56) |
 | (57) |
Acknowledgements
The technical support and advanced computing resources from University of Hawaii Information Technology Services – Cyberinfrastructure, funded in part by the National Science Foundation CC* awards #2201428 and #2232862 are gratefully acknowledged. W. E. U. and V. M. gratefully acknowledge the Donors of the American Chemical Society Petroleum Research Fund for support of this research, grant number 60809-DNI9. W. E. U. and V. M. also gratefully acknowledge support from the Army Research Office under Grant Number W911NF-23-1-0190. M. N. P. acknowledges financial support through grants ProyExcel_00505 funded by Junta de Andalucía, PID2021-126348NB-I00 funded by MCIN/AEI/10.13039/501100011033 and “ERDF A way of making Europe”, and a María Zambrano grant from Ministerio de Universidades. The views and conclusions contained in this document are those of the authors and should not be interpreted as representing the official policies, either expressed or implied, of the Army Research Office or the U.S. Government. The U.S. Government is authorized to reproduce and distribute reprints for Government purposes notwithstanding any copyright notation herein.Notes and references
- S. Ebbens, Curr. Opin. Colloid Interface Sci., 2016, 21, 14–23 CrossRef CAS.
- A. Aubret, Q. Martinet and J. Palacci, Nat. Commun., 2021, 12, 6398 CrossRef CAS PubMed.
- L. Baraban, M. Tasinkevych, M. N. Popescu, S. Sanchez, S. Dietrich and O. Schmidt, Soft Matter, 2012, 8, 48–52 RSC.
- L. Wang, A. Kaeppler, D. Fischer and J. Simmchen, ACS Appl. Mater. Interfaces, 2019, 11, 32937–32944 CrossRef CAS PubMed.
- S. Hermanová and M. Pumera, ACS Nanosci. Au, 2022, 2, 225–232 CrossRef PubMed.
- W. Gao and J. Wang, Nanoscale, 2014, 6, 10486–10494 RSC.
- S. Chen, C. Prado-Morales, D. Sánchez-deAlcázar and S. Sánchez, J. Mater. Chem. B, 2024, 12, 2711–2719 RSC.
- J. R. Howse, R. A. Jones, A. J. Ryan, T. Gough, R. Vafabakhsh and R. Golestanian, Phys. Rev. Lett., 2007, 99, 048102 CrossRef PubMed.
- B. V. Derjaguin, G. P. Sidorenkov, E. A. Zubashchenkov and E. V. Kiseleva, Kolloidn. Zh., 1947, 9, 335–347 Search PubMed.
- J. L. Anderson, Annu. Rev. Fluid Mech., 1989, 21, 61–99 CrossRef.
- J. L. Moran and J. D. Posner, Annu. Rev. Fluid Mech., 2017, 49, 511–540 CrossRef.
- H. C. Berg, E. coli in Motion, Springer, 2004 Search PubMed.
- H. C. Berg and E. M. Purcell, Biophys. J., 1977, 20, 193–219 CrossRef CAS PubMed.
- H. Levine and W.-J. Rappel, Phys. Today, 2013, 66, 24–30 CrossRef CAS PubMed.
- R. H. Insall, P. Paschke and L. Tweedy, Trends Cell Biol., 2022, 32, 585–596 CrossRef CAS PubMed.
- P. A. Iglesias and P. N. Devreotes, Curr. Opin. Cell Biol., 2008, 20, 35–40 CrossRef CAS PubMed.
- B. Petri and M.-J. Sanz, Cell Tissue Res., 2018, 371, 425–436 CrossRef CAS PubMed.
- N. P. Barry and M. S. Bretscher, Proc. Natl. Acad. Sci. U. S. A., 2010, 107, 11376–11380 CrossRef CAS PubMed.
- R. Golestanian, T. Liverpool and A. Ajdari, New J. Phys., 2007, 9, 126 CrossRef.
- M. N. Popescu, W. E. Uspal, Z. Eskandari, M. Tasinkevych and S. Dietrich, Eur. Phys. J. E: Soft Matter Biol. Phys., 2018, 41, 145 CrossRef CAS PubMed.
- R. Maity and P. Burada, J. Fluid Mech., 2022, 940, A13 CrossRef CAS.
- L. Huang, J. L. Moran and W. Wang, JCIS Open, 2021, 2, 100006 CrossRef.
- X. Xia, Y. Li, X. Xiao, Z. Zhang, C. Mao, T. Li and M. Wan, Small, 2024, 20, 2306191 CrossRef CAS PubMed.
- Y. Hong, N. M. Blackman, N. D. Kopp, A. Sen and D. Velegol, Phys. Rev. Lett., 2007, 99, 178103 CrossRef PubMed.
- Y.-M. Byun, P. E. Lammert, Y. Hong, A. Sen and V. H. Crespi, J. Phys.: Condens. Matter, 2017, 29, 445101 CrossRef PubMed.
- L. Baraban, S. M. Harazim, S. Sanchez and O. G. Schmidt, Angew. Chem., Int. Ed., 2013, 52, 5552–5556 CrossRef CAS PubMed.
- A. Somasundar, S. Ghosh, F. Mohajerani, L. N. Massenburg, T. Yang, P. S. Cremer, D. Velegol and A. Sen, Nat. Nanotechnol., 2019, 14, 1129–1134 CrossRef CAS PubMed.
- Z. Xiao, A. Nsamela, B. Garlan and J. Simmchen, Angew. Chem., Int. Ed., 2022, 61, e202117768 CrossRef CAS PubMed.
- J. Katuri, W. E. Uspal, J. Simmchen, A. Miguel-López and S. Sánchez, Sci. Adv., 2018, 4, eaao1755 CrossRef PubMed.
- F. Mou, Q. Xie, J. Liu, S. Che, L. Bahmane, M. You and J. Guan, Natl. Sci. Rev., 2021, 8, nwab066 CrossRef CAS PubMed.
- C. Zhou, C. Gao, Y. Wu, T. Si, M. Yang and Q. He, Angew. Chem., 2022, 134, e202116013 CrossRef.
- M. N. Popescu, W. E. Uspal, C. Bechinger and P. Fischer, Nano Lett., 2018, 18, 5345–5349 CrossRef CAS PubMed.
- J. L. Moran, P. M. Wheat, N. A. Marine and J. D. Posner, Sci. Rep., 2021, 11, 4785 CrossRef CAS PubMed.
- T. Bickel, G. Zecua and A. Würger, Phys. Rev. E: Stat., Nonlinear, Soft Matter Phys., 2014, 89, 050303 CrossRef PubMed.
- S. Saha, R. Golestanian and S. Ramaswamy, Phys. Rev. E: Stat., Nonlinear, Soft Matter Phys., 2014, 89, 062316 CrossRef PubMed.
- M. Tătulea-Codrean and E. Lauga, J. Fluid Mech., 2018, 856, 921–957 CrossRef.
- J.-X. Chen, Y.-G. Chen and Y.-Q. Ma, Soft Matter, 2016, 12, 1876–1883 RSC.
- L. Deprez and P. de Buyl, Soft Matter, 2017, 13, 3532–3543 RSC.
- H. Stark, Acc. Chem. Res., 2018, 51, 2681–2688 CrossRef CAS PubMed.
- O. Pohl and H. Stark, Phys. Rev. Lett., 2014, 112, 238303 CrossRef PubMed.
- E. Lushi, R. E. Goldstein and M. J. Shelley, Phys. Rev. E: Stat., Nonlinear, Soft Matter Phys., 2012, 86, 040902 CrossRef PubMed.
- M.-J. Huang, J. Schofield and R. Kapral, New J. Phys., 2017, 19, 125003 CrossRef.
- T. Traverso and S. Michelin, Phys. Rev. Fluids, 2020, 5, 104203 CrossRef.
- W. Uspal, M. N. Popescu, S. Dietrich and M. Tasinkevych, Soft Matter, 2015, 11, 434–438 RSC.
- U. M. Córdova-Figueroa and J. F. Brady, Phys. Rev. Lett., 2008, 100, 158303 CrossRef PubMed.
- S. Michelin and E. Lauga, J. Fluid Mech., 2014, 747, 572–604 CrossRef.
- I. Sneddon, Mixed boundary Value in Potential Theory, North-Holland, Amsterdam, The Netherlands, 1966 Search PubMed.
- R. E. Munteanu, M. N. Popescu and S. Gáspár, Condens. Matter, 2019, 4, 73 CrossRef CAS.
- P. Chatterjee, E. M. Tang, P. Karande and P. T. Underhill, Phys. Rev. Fluids, 2018, 3, 014101 CrossRef.
- A. M. Davis and E. Yariv, J. Eng. Math., 2022, 133, 5 CrossRef CAS.
- A. Boymelgreen and T. Miloh, J. Eng. Math., 2024, 146, 16 CrossRef.
- S. Ebbens, M.-H. Tu, J. R. Howse and R. Golestanian, Phys. Rev. E: Stat., Nonlinear, Soft Matter Phys., 2012, 85, 020401 CrossRef PubMed.
- J. Katuri, W. E. Uspal, M. N. Popescu and S. Sánchez, Sci. Adv., 2021, 7, eabd0719 CrossRef CAS PubMed.
- R. Poehnl and W. Uspal, J. Fluid Mech., 2021, 927, A46 CrossRef CAS.
- C. Pozrikidis, A practical guide to boundary element methods with the software library BEMLIB, CRC Press, 2002 Search PubMed.
- M. N. Popescu, S. Dietrich, M. Tasinkevych and J. Ralston, Eur. Phys. J. E: Soft Matter Biol. Phys., 2010, 31, 351–367 CrossRef CAS PubMed.
- M. Theers, E. Westphal, G. Gompper and R. G. Winkler, Soft Matter, 2016, 12, 7372–7385 RSC.
- Y. Solomentsev and J. L. Anderson, Ind. Eng. Chem. Res., 1995, 34, 3231–3238 CrossRef CAS.
- C. van Baalen, W. E. Uspal, M. N. Popescu and L. Isa, Soft Matter, 2023, 19, 8790–8801 RSC.
- S. E. Spagnolie and E. Lauga, J. Fluid Mech., 2012, 700, 105–147 CrossRef.
- D. Takagi, J. Palacci, A. B. Braunschweig, M. J. Shelley and J. Zhang, Soft Matter, 2014, 10, 1784–1789 RSC.
- A. T. Brown, I. D. Vladescu, A. Dawson, T. Vissers, J. Schwarz-Linek, J. S. Lintuvuori and W. C. Poon, Soft Matter, 2016, 12, 131–140 RSC.
- M. Lisicki, B. Cichocki, S. A. Rogers, J. K. Dhont and P. R. Lang, Soft Matter, 2014, 10, 4312–4323 RSC.
- N. Sharifi-Mood, A. Mozaffari and U. M. Córdova-Figueroa, J. Fluid Mech., 2016, 798, 910–954 CrossRef.
- B. Nasouri and R. Golestanian, J. Fluid Mech., 2020, 905, A13 CrossRef CAS.
- R. Poehnl and W. E. Uspal, Phys. Rev. Fluids, 2023, 8, 113103 CrossRef.
- J. Palacci, S. Sacanna, A. Vatchinsky, P. M. Chaikin and D. J. Pine, J. Am. Chem. Soc., 2013, 135, 15978–15981 CrossRef CAS PubMed.
- J.-X. Chen, J.-Q. Hu and R. Kapral, Adv. Sci., 2024, 2305695 CrossRef CAS PubMed.
- J. Li, O. E. Shklyaev, T. Li, W. Liu, H. Shum, I. Rozen, A. C. Balazs and J. Wang, Nano Lett., 2015, 15, 7077–7085 CrossRef CAS PubMed.
- G. Zhu, B. van Gogh, L. Zhu, O. S. Pak and Y. Man, J. Fluid Mech., 2024, 986, A39 CrossRef.
- A. Daddi-Moussa-Ider, A. Vilfan and R. Golestanian, J. Fluid Mech., 2022, 940, A12 CrossRef CAS.
- J. Happel and H. Brenner, Low Reynolds number hydrodynamics, Noordhoff International, Leyden, 1973 Search PubMed.
- H. Brenner, Chem. Eng. Sci., 1961, 16, 242–251 CrossRef CAS.
- G. Jeffery, Proc. R. Soc. London, Ser. A, 1912, 87, 109 Search PubMed.
- A. Boymelgreen and T. Miloh, J. Eng. Math., 2024, 146, 16 CrossRef.
- I. S. Gradshteyn and I. M. Ryzhik, Table of Integrals, Series, and Products, Academic Press, London, 5th edn, 1994 Search PubMed.
- A. Domínguez, P. Malgaretti, M. N. Popescu and S. Dietrich, Phys. Rev. Lett., 2016, 116, 078301 CrossRef PubMed.
- P. Malgaretti, M. N. Popescu and S. Dietrich, Soft Matter, 2018, 14, 1375–1388 RSC.
| This journal is © The Royal Society of Chemistry 2024 |

