 Open Access Article
The impact of cross-linker distribution on magnetic nanogels: encapsulation, transport and controlled release of the tracer†
Ivan S.
Novikau
 *a,
Ekaterina V.
Novak
 b and
Sofia S.
Kantorovich
 a
a
aFaculty of Physics, University of Vienna, Kolingasse 14-16, Vienna 1090, Austria. E-mail: ivan.novikau@univie.ac.at
bUral Federal University, Lenin Av. 51, Ekaterinburg 620000, Russian Federation
First published on 17th October 2024
Abstract
Magnetic nanogels (MNGs) are highly attractive for biomedical applications because of their potential for remote control of the rheology and internal structure of these soft colloids with biocompatible magnetic fields. In this contribution, using molecular dynamics simulations, we investigate the impact of the cross-linker distribution in the body of a MNG on the shape and magnetic response to constant and AC magnetic fields and relate those properties to the behaviour of non-magnetic tracers placed in the MNGs and left to escape. We find that if no AC magnetic field is applied, although the escape times of the tracer particles barely depend on morphology, the highest degree of subdiffusion is observed for the gels with a non-uniform cross-linkerer distribution. We also find how the eigen frequency at which particles relax locally in the polymer matrix affects the dynamic magnetic response of the gel. We show that a magnetic field-induced wobbling can facilitate drug release from gels.
1 Introduction
Hydrogels are soft materials that have gained significant attention in recent decades. They are widely used in various fields such as chemical, biomedical, and environmental engineering.1 Some non-standard applications include cleaning modern and contemporary art,2 creating a highly tunable environment for cellular development,3 and even oil recovery.4 Although hydrogels are the most commonly mentioned type of gels, they do not exhaust the broader concept of a gel often defined as non-fluid network, which also includes colloidal,5 olympic6 and aerogels.7 In terms of scale, there is a distinction between bulk and micro-/nanogels (MGs/NGs).One way to change the properties of MGs and NGs is through functionalisation. Specifically, thanks to their injectability and microporosity,8 functionalised nanoscale hydrogels are actively used for targeted drug delivery9–12 and invasive therapy.13 The functionalisation of gels in the context of biomedical applications is carried out primarily to make them more responsive to various stimuli, including internal factors such as temperature,14,15 pH,15,16 redox,11 enzyme activity,17 ionic strength;16 as well as external stimuli such as temperature, mechanical forces,18 electromagnetic9 and ultrasonic radiation.19 In addition to that, NGs can be tuned to cross the blood–brain barrier,20,21 or vice versa, be impermeable to it.22 From the controllability perspective, among the variety of functionalised gels, magnetic micro- and nanogels (MMG and MNG respectively) stand out favourably, due to the biocompatibility of the external magnetic field ![[H with combining right harpoon above (vector)]](https://www.rsc.org/images/entities/i_char_0048_20d1.gif) .23
.23
In the past decade, many experimental samples of gels with magnetic nanoparticles (MNPs) embedded in their matrix have been synthesised and studied.4,9,24–29 Despite the fact that full-fledged guidance with external magnetic fields of MMGs and MNGs in vivo has yet to be developed, the drug targeting with magnetic field already effectively enhances uptake of these particles by tumour cells.28 Furthermore, MNPs in gels open up new possibilities for their use in magnetic resonance imaging,29 magnetic hyperthermia27 or photothermia,9 while not interfering with other types of gel responsiveness, such as pH.28
In addition to other factors, research indicates that cross-linker distribution, or the morphology of micro- and nanogels, significantly influences the mechanical properties in both MGs and NGs,25,30–49 thereby necessitating a thorough analysis of the structure of the polymer matrix.
Several years ago, we developed one of the first coarse-grained models of MNG with non-regular internal structure.50,51 This model qualitatively mimics the structural properties of nanogels formed by electrochemically or photochemically induced cross-linking of polymer precursors encapsulated in an emulsion of nanodroplets.52 Before analysing the drug delivery potential, we verified this model. First, we used it to explore how the concentration of MNG and an applied magnetic field affect self-assembly. We found that the elastic matrix impedes the aggregation of MNPs but enhances magnetic susceptibility.53,54 Later, to ensure that our model is adequate under the impact of hydrodynamic flows, we extensively investigated the behaviour of a single MNG in shear flow.55 We found that in a shear flow the centre of mass of an MNG tended to be in the centre of a channel and to move, preserving the distance to both walls. The oscillations and rotation of the MNG monomers were found to cause a synchronised tumbling and wobbling of the whole MNG, accompanied by periodic changes in volume. The latter prove to be highly compressible and permeable for the carrier liquid MNGs to differ significantly from other soft colloids, described by Taylor-type models.56 Finally, we showed that the model was able to accurately capture the structural properties of various core–shell-like morphologies.57
Having a reliable and computationally efficient model of a MNG, we could proceed to one of the most challenging questions related to these systems: little to nothing is known about the influence of the MNG morphology on the drug transport and release under the influence of magnetic and hydrodynamic fields. Hence, in this contribution, using molecular dynamics simulations, we investigate the impact of the cross-linker distribution on the shape, and magnetic response to constant and AC fields, and relate those properties to the behaviour of non-magnetic tracers placed in the MNGs and left to escape. In this way, we test both the cargo and the controlled release potential of various MNGs.
We start with a brief introduction of the simulation approach (all additional details and the parameters are provided in the Methods section at the end of the manuscript). Next, in order to verify the characteristic dynamic modes of MNGs, we study the dynamic susceptibility spectra and compare them to the experimental results available in the literature.25 Being sure that the dynamics of the MNGs is reproduced adequately and obtaining a clear microscopic picture of it, including intrinsic relaxation time scales, we place non-magnetic tracers inside the MNGs of different morphologies. Three different computer experiments are performed: first, the tracers let to diffuse out of the MNG without any external stimulation, an escape time is measured and related to the encapsulation ability; second, an escape time is measured if a constant strong magnetic field is applied, allowing us to see if the field-induced MNG deformations can affect the encapsulation ability; finally, an AC magnetic field is applied and the controlled release of the tracers is estimated. The first three parts report the results obtained without hydrodynamic interactions. In the final part of this work, we check whether the hydrodynamic flow and magnetic field combined might lead to significant deformations and, as such, reduce the encapsulation ability. The manuscript ends with a brief conclusion, followed by a rigorous explanation of the simulation details.
2 Results and discussion
2.1 MNG representation and morphology
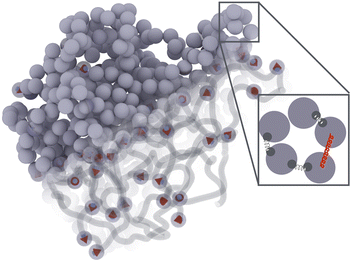
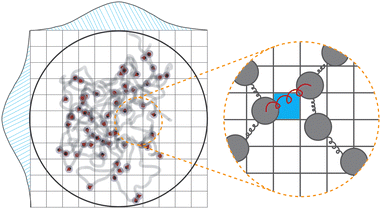
Fig. 1 presents a sketch of the coarse-grained representation of MNG we use in this work. The polymer matrix is composed by 600 polymer beads – soft gray spheres, connected by FENE (finitely extensible nonlinear elastic) springs58 as shown in the inset. This type of cross-linking, addressed as constrained one,59 restricts the rotation of the bead away from the polymer backbone. To cross-link the polymers, one hundred pairs of closest neighbours belonging to different chains are selected, and particle centres are connected by harmonic springs (see, inset of Fig. 1, red spring). The latter has exclusive technical and optimisation reasons explained at the end of the manuscript. Changing those cross-linkers to FENE bonds does not cause any qualitative difference. In the resulting matrix, each bead has one to three bonded neighbours, which is similar to the connectivity four in the work.60 We recognize that the number of monomers is small; however, considering both the gel's radius of gyration and the radius of the monomers, we find ourselves within a wide range of nanogels, including those synthesized experimentally. Our model effectively reveals the key physical properties, and its main advantage is possibility to simulate during the long time period and a large number of such gels simultaneously. Among 600 polymer beads, random 60 or 120, depending on the magnetic content, are assigned a permanent magnetic moment, whose orientation can only change by Brownian rotation of the whole bead. Magnetic beads created this way represent chemical binding of the magnetic nanoparticles to the gel matrix, similar to that in.25,61 Following the latter experimental work, we chose magnetic interactions to match the experiment (see, Methods section for more details).Taking into account the growing interest in optimising MNG morphology for biomedical applications, we perform numerical simulations of a MNG, considering uniform, Gaussian distribution from the centre to the periphery and reverse (1-Gaussian). The latter two cases are schematically presented in Fig. 2(a) and (b) respectively. From this point on, the manuscript will employ the following notations and colour scheme: uniform morphology will be coloured dark blue and abbreviated as u; Gaussian morphology will be plotted in pale red and abbreviated as g; inverse-Gaussian morphology is coloured light blue and the notation for it is 1-g. Solid lines in Fig. 2(c), showing the equilibrium monomer density profiles, ρ(r), evidence that the MNG morphology can be achieved well using our approach. Denoting by ri the distance between each particle i ∈ [1,600], and the MNG centre of mass, the equilibrium radii of gyration,
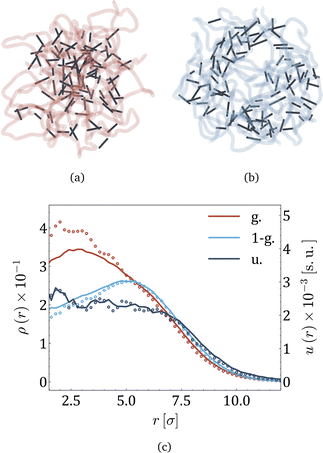 | ||
| Fig. 2 (a) and (b) Snapshots of MNGs with Gaussian and 1-Gaussian cross-linking distributions, respectively. Dark sticks portray cross-linkers (red spring in the inset of Fig. 1), while semitransparent curves represent polymer backbones (thin springs in the inset of Fig. 1). (c). Monomer density ρ(r) (solid lines) and energy density u(r) (dots) profiles versus the distance from the gel center of mass, r, represented by solid lines and circles, respectively. The morphologies are differentiated by color as it is provided in the legend: Gaussian (pale red), 1-Gaussian (blue) and uniform (dark blue). The number of magnetic particles is 60. | ||
Moreover, we can calculate u(r) – the energy density of bonds, i.e., the sum of all elastic potentials in a small spherical shell at a distance r from the gel centre of mass, divided by the volume of the shell. The results are plotted in the same figure (Fig. 2(c)) with dots. Both u(r) and ρ(r) are highly correlated, except in the core region of g-morphology, where cross-linkers are more stretched. In the ESI,† we demonstrate that it becomes challenging for cross-linkers to pack polymers into confined spaces, resulting in the stretching of cross-linkers. Overall Fig. 2(c) allows us to conclude that in thermodynamic equilibrium the core of the g-morphology MNG is denser than that of the uniform or 1-g morphology, whereas the 1-g morphology has the least dense core and exhibits a vesicle-like structure with a rather crowded shell. The length of the interparticle bonds is steadily fluctuating near its equilibrium value. The time scale of those fluctuations deserves particular attention as it is related to the eigen dynamic modes of the MNG.
For single-domain ferromagnetic particles in a fluid carrier, the characteristic timescale is set by the Brownian rotational relaxation time τB = β4πηrH3. Here, η represents the dynamic viscosity of the carrier, rH corresponds to the hydrodynamic radius of the MNP, and β = 1/kBT the Boltzmann factor. In our case, the characteristic rotational relaxation time is expected to be greater than τB, since the polymer matrix hinders the rotations. This defines the time-scales of our molecular dynamics simulations. The integration time-step, i.e. the shortest time resolved in the modelling, should be a fraction of τB. In order to reach equilibrium, one needs to propagate the system long enough for the entire MNG that is 14 times larger than a single particle, to sample an exhaustive part of the phase space, bringing us to the time intervals that are more than 4–6 orders of magnitude longer than τB.
2.2 Dynamic magnetic susceptibility
Static magnetic susceptibility at zero applied field, or the initial slope of the magnetisation curve, is one of the most important characteristics of magnetic-nanopraticle-based soft systems. It shows how correlated the magnetic particles are, in this way serving as a good indicator of a collective behaviour. If instead the time scales of the interparticle correlations are important, as when optimising the frequency, ω, of an applied magnetic field for hyperthermia,27 one aims first at analysing the initial dynamic susceptibility χ(ω) = χ′ + iχ′′.Here, χ′ and χ′′ are, respectively, the real and imaginary parts, and i is the complex unity. Note that χ′(0) is nothing but a static initial susceptibility discussed above. The positions of the χ′′(ω) maxima define the frequencies of the strongest dissipation, indicating in this way the frequencies of an applied field. In simulations, in order to obtain χ(ω) without an application of an oscillating magnetic field, it is convenient to calculate magnetisation autocorrelation functions (ACFs) and Fourier transform them.62–64
Witt and coauthors recently measured χ(ω) spectra for PNIPAM-based MMG with embedded CoFe2O4 MNPs stabilised sterically by citric acid.61 As mentioned in the previous section, the magnetic characteristics, concentration of MNPs (10 per cent), and sizes of the MNGs in this work are selected to match the experimental system. Multiple statistically independent simulations were performed for each morphology (see details in the Methods section) in order to improve statistics.
The ACFs of the total dipole moment of MNG, obtained in simulations and plotted in Fig. 3(a) for the three morphologies indicated in the legend, exhibit two prominent relaxation modes: a rapid decay occurring around 10τB and a slower decay after 105τB. The error-bars are shown by the colour halos around the curves. For detailed technical information on the computation and fit of the ACFs that span such a wide range of times, refer to the end of the ‘Simulation Protocol’ subsection below and Tables S1–S3 in the ESI.†
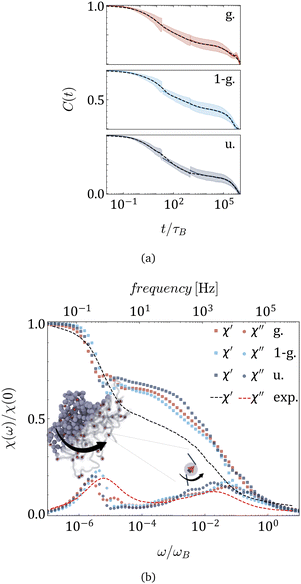 | ||
| Fig. 3 (a) Autocorrelation functions of the total dipole moment (solid lines); shaded regions ± show standard deviation, along with its sum of stretched exponential functions fit (dashed lines) for morphologies provided in the legend. MNGs contain 60 magnetic particles. (b) Real (squares) and imaginary (circles) parts of the dynamic magnetic susceptibility χ(ω) obtained from simulation, and experimentally measured dynamic susceptibility of nanogels of similar size with the same magnetic content25 (dashed lines). | ||
The experimentally measured magnetic susceptibility25 is included in Fig. 3(b) as dashed lines: χ′ in black and χ′′ in red. The Fourier transforms of the ACFs are plotted in Fig. 3(b) with points whose colour corresponds to a given morphology. In both the experiment and the simulations, two distinct peaks of χ′′ can be observed that are separated by four orders of magnitude in frequency. Although qualitatively experimental and simulation spectra agree very well, some quantitative differences can be observed. They can be attributed to the fact that the mechanical as well as the elastic properties of the experimental MNGs were not preserved in the simulations. At the same time, the qualitative agreement between these two dynamic zero-field susceptibilities indicates a match in magnetic particle volume fraction, particle coupling to the polymer matrix, and particle interaction strength in dynamic magnetic response.
The broad and not very tall high-frequency peak is, as expected, shifted to the left with respect to τB, indicating that the coupling of MNPs effectively transforms the narrow Brownian peak into a broader cascade of polymer mesh relaxations, similar to wobbling. With our simulations, we can now clearly state that the low-frequency peak ω/ωB ∈ [10−6,10−5], which is significantly higher and narrower, should be attributed to MNG rotation. The latter is, in its turn, determined by its morphology. In fact, the peak splits in Gaussian morphology, suggesting separate relaxation modes for the core and the shell. Meanwhile, the 1-Gaussian morphology relaxes faster, likely due to its smaller gel size compared to the uniform morphology, whose peak is found to be the leftmost.
In experiments, both high- and low-frequency AC fields can be applied at the discovered peaks. In simulations, however, resolving the low-frequency peak is not easily feasible because it requires months of simulation time to capture the corresponding relaxation. Hence, below, we focus only on the particle-related peak.
2.3 Drug release and encapsulation
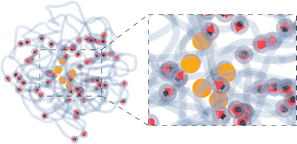
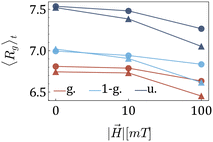
After understanding the impact of morphology on the equilibrium properties and on the dynamic magnetic response, we model a drug as a tracer particle of the same size as the polymer bead that only sterically interacts with the gel matrix. The sketch is presented in Fig. 4, where the tracers are coloured orange. We are particularly interested in the diffusion of tracers from the MNG centre of mass and the escape times. We consider that the tracer escapes the MNG if it diffuses a distance larger than the value of Rg. The latter depends not only on the morphology of a MNG, but also might be sensitive to an application of the magnetic field and variation of the magnetic particle concentration. In order to check the variation of the gyration radii with an applied field |![[H with combining right harpoon above (vector)]](https://www.rsc.org/images/entities/i_char_0048_20d1.gif) |, in Fig. 5 we show how the time-averaged 〈Rg〉t decreases with increasing field strength.
|, in Fig. 5 we show how the time-averaged 〈Rg〉t decreases with increasing field strength.
One can see only slight field-induced shrinking independently from the morphology and the number of magnetic particles. Similarly to the case of the zero applied field discussed above, for any values of |![[H with combining right harpoon above (vector)]](https://www.rsc.org/images/entities/i_char_0048_20d1.gif) |, Gaussian morphology MNGs exhibit a smaller 〈Rg〉t compared to the bulkier uniformly cross-linked MNGs, with the 1-Gaussian morphology falling in between.
|, Gaussian morphology MNGs exhibit a smaller 〈Rg〉t compared to the bulkier uniformly cross-linked MNGs, with the 1-Gaussian morphology falling in between.
This very little impact of the morphology and the applied homogeneous constant field on the shape of the MNGs raises the questions of how morphology and the applied ![[H with combining right harpoon above (vector)]](https://www.rsc.org/images/entities/i_char_0048_20d1.gif) would affect tracer diffusion and escape time.
would affect tracer diffusion and escape time.
The diffusion can be investigated in three situations: (i) equilibrium and no external stimuli, to verify whether the encapsulation is affected by the MNG morphology; (ii) under the influence of an applied constant magnetic field, to see whether the field-induced deformation that can occur reduces the encapsulation ability; (iii) under the influence of an applied AC field, to verify whether any of the morphologies can be used for a controlled release of tracers.
The mean square displacement of the tracers as a function of time for long enough time intervals can be fitted as MSD(t) = 6Dtα, where D is the effective diffusion coefficient (see Fig. S2, ESI†). In Table 1 the fitted exponents α are collected for each three cases.
All values of α < 1 indicate subdiffusion, but depend on whether the distribution of crosslinkers within the nanogels is uniform. If no field is applied, in case (i), there is no difference between nonuniform morphologies, but they exhibit a higher impediment for the tracers, indicating that a dense core or a dense shell hinder the diffusion more effectively and can better encapsulate the tracers, when compared to their homogeneous counterparts. If a constant homogeneous magnetic field is applied, in case (ii), the exponents do not change significantly when compared to a field-free case. In contrast, scenario (iii) shows less subdiffusivity across all morphologies. Interestingly enough, non-uniform morphologies show the highest increase in α in scenario (iii), suggesting that they are most effective for controlled drug release.
Fig. 6 presents histograms of tracer escape times under varying magnetic field strengths and frequencies, corresponding from the top to the bottom to cases (i), (ii), and (iii). From the upper panel of Fig. 6 one can see that the morphology does not affect much the escape time. The latter is also only slightly affected by a constant ![[H with combining right harpoon above (vector)]](https://www.rsc.org/images/entities/i_char_0048_20d1.gif) , see the middle panel of Fig. 6. A drastic decrease of the escape times is observed when an AC magnetic field is acting on the MNGs. A field, if applied with a frequency, corresponding to the right maximum in Fig. 3(b), leads to the in-place rotation of MNPs and stimulates MNG wobbling (see, Video suppl_video_1.mp4, ESI†). It is the wobbling that stimulates the release of the tracers.
, see the middle panel of Fig. 6. A drastic decrease of the escape times is observed when an AC magnetic field is acting on the MNGs. A field, if applied with a frequency, corresponding to the right maximum in Fig. 3(b), leads to the in-place rotation of MNPs and stimulates MNG wobbling (see, Video suppl_video_1.mp4, ESI†). It is the wobbling that stimulates the release of the tracers.
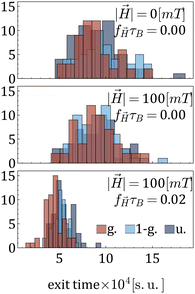 | ||
| Fig. 6 Histograms of tracer exit times for three different combinations of magnetic field strength and frequency, as indicated in the legend. The number of magnetic particles is 60. | ||
To summarise this part, one can conclude that the slowest diffusion in zero or constant fields is observed for the MNGs with a non-uniform cross-linker distribution. The same MNGs exhibit the largest decrease in escape times if an AC field is applied. Moreover, if an AC field has the frequency that corresponds to the right peak of the initial susceptibility spectra, it efficiently increases the MNG wobbling, leading to the speed up of the tracer release.
3 Magneto-hydrodynamic response of the MNGs
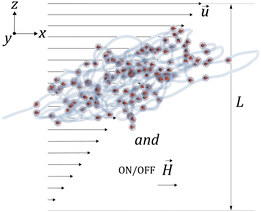
Considering that MNGs are crucial for drug delivery through the vascular system and are susceptible to external magnetic fields, we explore the extent to which their dynamics can be controlled by![[H with combining right harpoon above (vector)]](https://www.rsc.org/images/entities/i_char_0048_20d1.gif) . Therefore, we examine a MNG of a given morphology in the middle of a narrow periodic in lateral directions slit between two walls that are distance of L apart, as shown in Fig. 7. The upper wall moves along the x axis, inducing shear in the fluid at a rate of
. Therefore, we examine a MNG of a given morphology in the middle of a narrow periodic in lateral directions slit between two walls that are distance of L apart, as shown in Fig. 7. The upper wall moves along the x axis, inducing shear in the fluid at a rate of ![[small gamma, Greek, dot above]](https://www.rsc.org/images/entities/i_char_e0a2.gif) . We consider here both field-free and
. We consider here both field-free and ![[H with combining right harpoon above (vector)]](https://www.rsc.org/images/entities/i_char_0048_20d1.gif) -along-x-axis situations.
-along-x-axis situations.
When subjected to shear, the centre of mass of a MNG exhibits translational motion, while the MNG beads undergo periodic rotation (tumbling) around the centre of mass, associated with periodic deformation (wobbling). This dynamics of a MNG can be observed in suppl_video_2.mp4 (ESI†) and constitute in the periodic oscillations of Rg(t) shown in Fig. 8.
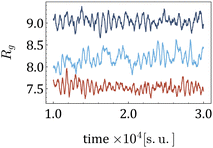 | ||
| Fig. 8 Time series Rg(t) for various morphologies, H = 10 [mT] and 20% of beads are MNPs. Dark blue is used for the uniform morphology; light blue – for 1-g; and red for g. | ||
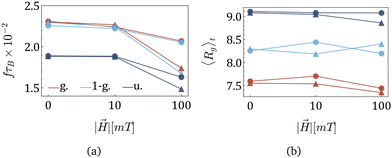
Previously, tumbling and wobbling were shown to have the same frequency f, being two faces of the same periodic process.55Fig. 9(a) shows that the strongest ![[H with combining right harpoon above (vector)]](https://www.rsc.org/images/entities/i_char_0048_20d1.gif) significantly reduces f. Additionally, f is sensitive to the MNPs concentration if an applied field is strong: the case of 120 magnetic beads is plotted with triangles that are lower than the circles used for MNGs with 60 magnetic particles. The morphological signature is manifested in a generally lower f for uniformly cross-linked MNGs, while the most drastic change in the frequencies with increasing MNP concentration and field can be observed for nonuniform morphologies. The general ability of
significantly reduces f. Additionally, f is sensitive to the MNPs concentration if an applied field is strong: the case of 120 magnetic beads is plotted with triangles that are lower than the circles used for MNGs with 60 magnetic particles. The morphological signature is manifested in a generally lower f for uniformly cross-linked MNGs, while the most drastic change in the frequencies with increasing MNP concentration and field can be observed for nonuniform morphologies. The general ability of ![[H with combining right harpoon above (vector)]](https://www.rsc.org/images/entities/i_char_0048_20d1.gif) to affect f highlights the magnetic controllability of MNGs. It is remarkable that the frequency of shear-induced wobbling is in the same range as the high-frequency peak of the dynamic magnetic susceptibility (see Fig. 3(b)). Furthermore, the morphologies influence the wobbling frequencies similarly in both plots.
to affect f highlights the magnetic controllability of MNGs. It is remarkable that the frequency of shear-induced wobbling is in the same range as the high-frequency peak of the dynamic magnetic susceptibility (see Fig. 3(b)). Furthermore, the morphologies influence the wobbling frequencies similarly in both plots.
To further analyse the hydrodynamic response of the MNG, we examined time-averaged 〈Rg〉t as a function of |![[H with combining right harpoon above (vector)]](https://www.rsc.org/images/entities/i_char_0048_20d1.gif) | and plotted it in Fig. 9(a). The figure reveals that deformations induced by shear forces dominate over those caused by
| and plotted it in Fig. 9(a). The figure reveals that deformations induced by shear forces dominate over those caused by ![[H with combining right harpoon above (vector)]](https://www.rsc.org/images/entities/i_char_0048_20d1.gif) , with changes in 〈Rg〉t at high H showing to be negligible compared to the data shown in Fig. 5. A comparison between Fig. 5 and 9(b) reveals that shear consistently leads to elevated values of 〈Rg〉t in the entire range of parameters. This increase of Rg is attributed to the deformation of the MNG into a pancake-like shape, resulting in enhanced asphericity and a slight reduction in volume, as documented in a previous study.55
, with changes in 〈Rg〉t at high H showing to be negligible compared to the data shown in Fig. 5. A comparison between Fig. 5 and 9(b) reveals that shear consistently leads to elevated values of 〈Rg〉t in the entire range of parameters. This increase of Rg is attributed to the deformation of the MNG into a pancake-like shape, resulting in enhanced asphericity and a slight reduction in volume, as documented in a previous study.55
4 Conclusion
We performed molecular dynamics simulations coupled with the Lattice–Boltzmann solver to show that one can efficiently control the dynamics of the gel in shear flow using a uniform magnetic field. We explain the extent to which an increase in the concentration of MNP further improves the controllability of the MNG. Considering that our basic MNP concentration is similar to that of the experiment,61 doubling the load remains experimentally feasible. It was found that the MNGs with non-uniform morphologies are marginally more sensitive to changes in the applied field at higher MNPs concentration (see Fig. 9(a)). This pinpoints such nanogels as promising potential candidates for drug delivery.Upon accessing the magnetic properties of an MNG through computation of the initial dynamic magnetic susceptibility spectra and finding the behaviour confirmed experimentally, two main conclusions can be drawn. First, we were able to clearly connect the two relaxation modes to the processes behind them: high-frequency single-particle relaxation in a crowded environment and low-frequency gel rotation. Second, we discovered that the eigen frequency at which particles relax locally in the matrix, i.e., the position of the high-frequency peak of the imaginary part of the dynamic susceptibility, χ′′, defines the response to shear and characterises the wobbling of the gel. This finding makes it possible to predict the rheological behaviour of MNGs by measuring susceptibility spectra.
Finally, we demonstrate that AC magnetic field-induced wobbling can facilitate drug release from gels, ensuring targeted and sustainable delivery, as a nonenhanced diffusion process typically takes hours.65–67
In terms of perspective, the same wobbling can improve the efficiency of hyperthermia to combat cancer tumors,68,69 but also the low-frequency susceptibility peak should be analysed for that.
In general, the approach we propose to access and exploit the magnetic properties of a material is universal and can also be used in magnetic robotics67,70–72 or 3D printing optimization.71
5 Model and methods
We represent our MNG as a network of interconnected polymer chains. Each chain follows a classical bead-spring polymer representation.58 In the model, 10% or 20% of the beads are randomly substituted with magnetic particles, as depicted in Fig. 1. The top left corner of the figure shows all beads explicitly, while the bottom right corner illustrates the polymer beads as chains with embedded magnetic particles. Red arrows within the particles denote magnetic moments. We choose model parameters such that the magnetic nanoparticles are made of cobalt ferrite (CoFe2O4) and have a steric stabilisation shell with a thickness of two nm.5.1 Dimensionless units
To facilitate our simulations, we employ a Simulation Unit (SU) system. In order to establish a consistent length scale, we select the magnetic particles as the reference. Consequently, the magnetic nanoparticles (MNPs) are assigned a dimensionless unit diameter of σ = 1. Based on this choice, the sizes of the polymer beads are scaled accordingly to match the sizes of the MNPs. For clarity, Table 2 presents the simulation units (SU) alongside their corresponding units in the international system of units (SI). Particle properties are shown in the Table 3. The chosen polymer blob size is a reasonable estimate for the persistence length of collagen.73| System: | SI units | Simulation units |
|---|---|---|
| Energy unit | 1.79 kB 298.15 K | 1 [E] |
| Time unit | 20 ns | 1 [t] |
| Mass unit | 8.82 × 10⁻²¹ kg | 1 [m] |
| Distance unit | 20.1 nm | 1 [x] = 1 σ |
| Kinematic viscosity | 8.92 × 10⁻⁸ m2 s−1 | 4.86 [x]2 [t]−1 |
| Solvent density | 0.997 × 10³ kg2 m−3 | 0.92 [m] [x]−3 |
| Particles: | MNP (CoFe2O4) | Polymer bead |
|---|---|---|
| Core density | 5.3 × 10³ kg m−3 | 1.3 × 10³ kg m−3 |
| Core diameter | 16.1 nm | 20.1 nm |
| Shell density | 1.6 × 10³ kg m−3 | — |
| Shell thickness | 2 nm | — |
| Saturation magnetisation | 420 × 103 A m−1 | — |
5.2 Potentials
There is a steric repulsion between various types of particles within a MNG. This repulsion is described using a shifted and truncated version of the Lennard-Jones (LJ) potential, known as the Weeks–Chandler–Andersen (WCA) potential74 | (1) |
Each MNG consists of six separate 100 bead chains. Adjacent beads within the same polymer chain are interconnected by finitely extensible nonlinear elastic FENE springs.58 The springs are connected to diametrically opposed anchor points located on the surface of all beads. Such coupling is crucial for the proper transfer of the MNP torque to the polymer mesh. This arrangement forms the polymer backbone, which serves as a crucial structural element within the MNG. The FENE potential is defined by the following expression:
 | (2) |
The polymer chains are cross-linked within a spherical cavity, which has a size that corresponds to a volume fraction of approximately ϕp ≈ 0.33. Once the system reaches equilibrium inside the sphere, the gel is created by cross-linking selected beads so that the concentration of cross-linkers ϕlinks = 0.33. To choose beads for cross-linking and establish the desired cross-linker distribution, we begin by defining the grid width dgrid as in the polymer mix and constructing a 3D grid that fully encloses the mix. Let ![[scr B, script letter B]](https://www.rsc.org/images/entities/char_e13f.gif) denote the set of beads and
denote the set of beads and ![[capital script C]](https://www.rsc.org/images/entities/char_e522.gif) denote the set of chains. For each pair of beads (bi,bj) where bi and bj belong to different chains
denote the set of chains. For each pair of beads (bi,bj) where bi and bj belong to different chains  , we calculate the Euclidean distance
  , where
 ![[r with combining right harpoon above (vector)]](https://www.rsc.org/images/entities/i_char_0072_20d1.gif) i and
i and ![[r with combining right harpoon above (vector)]](https://www.rsc.org/images/entities/i_char_0072_20d1.gif) j are the position vectors of bi and bj, respectively. For each dij, we determine the center coordinates
j are the position vectors of bi and bj, respectively. For each dij, we determine the center coordinates  , map
, map ![[r with combining right harpoon above (vector)]](https://www.rsc.org/images/entities/i_char_0072_20d1.gif) center to the corresponding cell index in the 3D grid, and store dij and the bead pair (bi,bj) in ascending order within the cell. We then generate a random 3D vector
center to the corresponding cell index in the 3D grid, and store dij and the bead pair (bi,bj) in ascending order within the cell. We then generate a random 3D vector ![[v with combining right harpoon above (vector)]](https://www.rsc.org/images/entities/i_char_0076_20d1.gif) rand from a specified distribution (e.g., uniform, Gaussian with mean
rand from a specified distribution (e.g., uniform, Gaussian with mean  and standard deviation
  ). We identify the grid cell corresponding to
 ![[v with combining right harpoon above (vector)]](https://www.rsc.org/images/entities/i_char_0076_20d1.gif) rand and draw the shortest link (bi,bj) with the minimum distance dij within that cell. Finally, we form a harmonic bond between selected beads bi and bj, described by the potential
rand and draw the shortest link (bi,bj) with the minimum distance dij within that cell. Finally, we form a harmonic bond between selected beads bi and bj, described by the potential
 | (3) |
Subsequent to the cross-linking process, 60 polymer beads are randomly chosen and assigned a dipole moment. Both the magnitude of the point dipole and its internal orientation within the particle body are fixed. This approach is justified given the size range examined in this study, where cobalt ferrite particles with a diameter of 20 nm predominantly exhibit Brownian relaxation rather than Néel one.75 The interaction between two magnetic particles i and j can, therefore, be described by the dipole–dipole potential:
 | (4) |
![[small mu, Greek, vector]](https://www.rsc.org/images/entities/i_char_e0e9.gif) i and
i and ![[small mu, Greek, vector]](https://www.rsc.org/images/entities/i_char_e0e9.gif) j represent the respective dipole moments of the interacting particles, while |
j represent the respective dipole moments of the interacting particles, while |![[r with combining right harpoon above (vector)]](https://www.rsc.org/images/entities/i_char_0072_20d1.gif) ij| = r represents the vector connecting their centers. The interaction between two magnetic nanoparticles (MNPs) is commonly characterized using the dipolar coupling parameter, denoted as λ. This parameter is defined as the ratio of the minimum dipole–dipole interaction energy per particle at the contact to the thermal energy, and can be expressed as λ = βμ0μ2/4πσ3. For this particular study, MNPs were selected to have a value of λ = 2.5.
ij| = r represents the vector connecting their centers. The interaction between two magnetic nanoparticles (MNPs) is commonly characterized using the dipolar coupling parameter, denoted as λ. This parameter is defined as the ratio of the minimum dipole–dipole interaction energy per particle at the contact to the thermal energy, and can be expressed as λ = βμ0μ2/4πσ3. For this particular study, MNPs were selected to have a value of λ = 2.5.
5.3 Simulation protocol
We employed a simulation procedure developed in the earlier study.55 The primary tools in our investigation are the molecular dynamics algorithm76 coupled to Lattice–Boltzmann scheme (LB),77,78 within ESPResSo simulation package version 4.2.79 This set of algorithms enables the incorporation of thermal noise 1/β into the LB. Within this approach each particle in the MNG is a point that interacts and affects the velocities of the fluid calculated on the lattice. We employ a cube-shaped simulation box with a side length of 100σ and the LB lattice constant is set to agrid = 1σ. The system evolves with a time step δt = 0.001, with the LB fluid field updated every 16th MD step. The shear flow is created by a constant motion of the upper wall with a non-slip boundary condition.The MNG in its equilibrium configuration is placed in the middle of the channel (see Fig. 7) with flow (![[small gamma, Greek, dot above]](https://www.rsc.org/images/entities/i_char_e0a2.gif) = 9 × 10⁵ s−1) and let to evolve in time until the stationary state is established.
= 9 × 10⁵ s−1) and let to evolve in time until the stationary state is established.
When analysing the data, the initial 1 × 10⁵ simulation steps are disregarded. This period captures the initial oscillations of the gel under shear influence. The simulation duration is 3 × 10⁵. All measurements are averaged over 7 different MNG configurations with distinct magnetic particle positions and cross-linkers distribution, in order to avoid dependence on the individual MNG realisation within a given morphology.
5.4 Calculating autocorrelation functions
To obtain the ACF presented in Fig. 3(a) with a temporal resolution spanning almost eight orders of magnitude, we performed three independent simulations from identical initial conditions. These simulations used varying time-step intervals (τstep) and frequencies to record simulation data (τsave):Small 1. τstep = τsave ≈ 0.01τB;
Medium 1. τstep ≈ 0.1τB, τsave = 1 × 10²τstep;
Large 1. τstep ≈ 0.2τB, τsave = 2 × 10⁴τstep.
For each simulation, we computed the ACF and displayed them in Fig. 3(a) without any changes or rescalings. Furthermore, to expedite the capture of long-time-scale relaxations, we disabled hydrodynamics during the computation of these ACFs and exclusively employed overdamped Langevin dynamics (commonly known as Brownian dynamics) and set in FENE bonds εf = 22.5 in order to speed up the equilibration and convergence.
The acquired ACFs were fitted with a sum of 10 stretched (or compressed) exponential functions e−tβ for exponents 0 < β < 2 (shown as a dashed line in Fig. 3(b)). The Differential Evolution algorithm80 optimised the fitting. Optimal weights of the stretched exponentials are provided in the ESI† ‘ACFs fitting weights’.
Author contributions
I. Novikau created and executed the simulation codes, interpreted the data, and participated in drafting the manuscript. E. Novak supported the data analysis, writing, and proofreading of the manuscript. S. Kantorovich formulated the problem and contributed to the manuscript writing.Data availability
Ivan S. Novikau, 2024, vanadiuz/mng_morph_shear, Code for Production Simulations, DOI: 10.5281/zenodo.12193762.Conflicts of interest
There are no conflicts to declare.Acknowledgements
Computer simulations were performed at the Vienna Scientific Cluster (VSC-5). I. S. N. and S. S. K. are grateful to Vienna Doctoral School Physics (VDSP) and Doctoral College Advanced Functional Materials (DCAFM) for the financial support. E. V. N. was partially supported by the Feuz 2023-0020.Notes and references
- D. Yang, Chem. Mater., 2022, 34, 1987–1989 CrossRef CAS.
- R. Mastrangelo, D. Chelazzi, G. Poggi, E. Fratini, L. P. Buemi, M. L. Petruzzellis and P. Baglioni, Proc. Natl. Acad. Sci. U. S. A., 2020, 117, 7011–7020 CrossRef CAS PubMed.
- A. S. Caldwell, B. A. Aguado and K. S. Anseth, Adv. Funct. Mater., 2020, 30, 1907670 CrossRef CAS PubMed.
- M. Khalil, A. Fahmi, N. M. Nizardo, Z. Amir and B. M. Jan, Langmuir, 2021, 37, 8855–8865 CrossRef CAS PubMed.
- R. Harich, T. W. Blythe, M. Hermes, E. Zaccarelli, A. J. Sederman, L. F. Gladden and W. C. Poon, Soft Matter, 2016, 12, 4300–4308 RSC.
- M. Lang, J. Fischer, M. Werner and J.-U. Sommer, Phys. Rev. Lett., 2014, 112, 238001 CrossRef CAS PubMed.
- S. Zhao, G. Siqueira, S. Drdova, D. Norris, C. Ubert, A. Bonnin, S. Galmarini, M. Ganobjak, Z. Pan, S. Brunner, G. Nyström, J. Wang, M. M. Koebel and W. J. Malfait, Nature, 2020, 584, 387–392 CrossRef CAS PubMed.
- Q. Feng, D. Li, Q. Li, X. Cao and H. Dong, Bioact. Mater., 2022, 9, 105–119 CAS.
- C. Biglione, J. Bergueiro, S. Wedepohl, B. Klemke, M. C. Strumia and M. Calderón, Nanoscale, 2020, 12, 21635–21646 RSC.
- S. M. Giannitelli, E. Limiti, P. Mozetic, F. Pinelli, X. Han, F. Abbruzzese, F. Basoli, D. Del Rio, S. Scialla, F. Rossi, M. Trombetta, L. Rosanò, G. Gigli, Z. J. Zhang, E. Mauri and A. Rainer, Nanoscale, 2022, 14, 11415–11428 RSC.
- A. M. Laradji, A. V. Kolesnikov, B. B. Karakoçak, V. J. Kefalov and N. Ravi, ACS Omega, 2021, 6, 6172–6184 CrossRef CAS PubMed.
- H. Wang, M. L. Picchio and M. Calderón, Wiley Interdiscip. Rev.: Nanomed. Nanobiotechnol., 2022, 14, e1791 CAS.
- T. P. Nguyen, F. Li, S. Shrestha, R. S. Tuan, H. Thissen, J. S. Forsythe and J. E. Frith, Biomaterials, 2021, 279, 121214 CrossRef CAS PubMed.
- J. Dubbert, K. Nothdurft, M. Karg and W. Richtering, Macromol. Rapid Commun., 2015, 36, 159–164 CrossRef CAS PubMed.
- A. Ahiabu and M. J. Serpe, ACS Omega, 2017, 2, 1769–1777 CrossRef CAS PubMed.
- M. Dadsetan, K. E. Taylor, C. Yong, Z. Bajzer, L. Lu and M. J. Yaszemski, Acta Biomater., 2013, 9, 5438–5446 CrossRef CAS PubMed.
- Z. Gu, T. T. Dang, M. Ma, B. C. Tang, H. Cheng, S. Jiang, Y. Dong, Y. Zhang and D. G. Anderson, ACS Nano, 2013, 7, 6758–6766 CrossRef CAS PubMed.
- M. F. Schulte, E. Izak-Nau, S. Braun, A. Pich, W. Richtering and R. Göstl, Chem. Soc. Rev., 2022, 51, 2939–2956 RSC.
- A. Razavi, M. Rutsch, S. Wismath, M. Kupnik, R. von Klitzing and A. Rahimzadeh, Gels, 2022, 8, 628 CrossRef CAS PubMed.
- S. Singh, N. Drude, L. Blank, P. B. Desai, H. Königs, S. Rütten, K.-J. Langen, M. Möller, F. M. Mottaghy and A. Morgenroth, Adv. Healthcare Mater., 2021, 10, 2100812 CrossRef CAS PubMed.
- L. Ribovski, E. de Jong, O. Mergel, G. Zu, D. Keskin, P. van Rijn and I. S. Zuhorn, Nanomedicine, 2021, 34, 102377 CrossRef CAS PubMed.
- A. Kimura, J.-I. Jo, F. Yoshida, Z. Hong, Y. Tabata, A. Sumiyoshi, M. Taguchi and I. Aoki, Acta Biomater., 2021, 125, 290–299 CrossRef CAS PubMed.
- J. F. Schenck, Prog. Biophys. Mol. Biol., 2005, 87, 185–204 CrossRef PubMed.
- R. Mizuta, Y. Sasaki, K. Katagiri, S. I. Sawada and K. Akiyoshi, Nanoscale Adv., 2022, 4, 1999–2010 RSC.
- M. U. Witt, J. Landers, S. Hinrichs, S. Salamon, J. Kopp, B. Hankiewicz, H. Wende and R. V. Klitzing, Soft Matter, 2022, 18, 1089–1099 RSC.
- E. Cazares-Cortes, A. Espinosa, J. M. Guigner, A. Michel, N. Griffete, C. Wilhelm and C. Ménager, ACS Appl. Mater. Interfaces, 2017, 9, 25775–25788 CrossRef CAS PubMed.
- E. Cazares-Cortes, C. Wilhelm, J. E. Perez, A. Espinosa, S. Casale, A. Michel, A. Abou-Hassan and C. Ménager, Chem. Commun., 2021, 57, 5945–5948 RSC.
- P. Mandal, S. Maji, S. Panja, O. P. Bajpai, T. K. Maiti and S. Chattopadhyay, New J. Chem., 2019, 43, 3026–3037 RSC.
- X. Zhang, P. Wei, Z. Wang, Y. Zhao, W. Xiao, Y. Bian, D. Liang, Q. Lin, W. Song, W. Jiang and H. Wang, ACS Appl. Mater. Interfaces, 2022, 14, 15956–15969 CrossRef CAS PubMed.
- A. Ruscito, E. Chiessi, Y. Toumia, L. Oddo, F. Domenici and G. Paradossi, Gels, 2020, 6, 1–19 CrossRef PubMed.
- M. J. Bergman, J. S. Pedersen, P. Schurtenberger and N. Boon, Soft Matter, 2020, 16, 2786–2794 RSC.
- M.-H. Kwok and T. Ngai, Front. Chem., 2018, 6, 148 CrossRef PubMed.
- E. Mueller, R. J. Alsop, A. Scotti, M. Bleuel, M. C. Rheinstädter, W. Richtering and T. Hoare, Langmuir, 2018, 34, 1601–1612 CrossRef CAS PubMed.
- M. F. Schulte, A. Scotti, A. P. Gelissen, W. Richtering and A. Mourran, Langmuir, 2018, 34, 4150–4158 CrossRef CAS PubMed.
- M. C. Tatry, E. Laurichesse, J. Vermant, V. Ravaine and V. Schmitt, J. Colloid Interface Sci., 2023, 629, 288–299 CrossRef CAS PubMed.
- S. Nayak, D. Gan, M. J. Serpe and L. A. Lyon, Small, 2005, 1, 416–421 CrossRef CAS PubMed.
- F. Hagemans, F. Camerin, N. Hazra, J. Lammertz, F. Dux, G. Del Monte, O.-V. Laukkanen, J. J. Crassous, E. Zaccarelli and W. Richtering, ACS Nano, 2023, 17, 7257–7271 CrossRef CAS PubMed.
- R. Keidel, A. Ghavami, D. M. Lugo, G. Lotze, O. Virtanen, P. Beumers, J. S. Pedersen, A. Bardow, R. G. Winkler and W. Richtering, Sci. Adv., 2018, 4, eaao7086 CrossRef PubMed.
- A. Ghavami and R. G. Winkler, ACS Macro Lett., 2017, 6, 721–725 CrossRef CAS PubMed.
- A. Ninarello, J. J. Crassous, D. Paloli, F. Camerin, N. Gnan, L. Rovigatti, P. Schurtenberger and E. Zaccarelli, Macromolecules, 2019, 52, 7584–7592 CrossRef CAS PubMed.
- H. Kobayashi, R. Halver, G. Sutmann and R. G. Winkler, Polymers, 2017, 9, 15 CrossRef PubMed.
- G. D. Monte, A. Ninarello, F. Camerin, L. Rovigatti, N. Gnan and E. Zaccarelli, Soft Matter, 2019, 15, 8113–8128 RSC.
- A. J. Moreno and F. L. Verso, Soft Matter, 2018, 14, 7083–7096 RSC.
- A. Scotti, M. Brugnoni, A. A. Rudov, J. E. Houston, I. I. Potemkin and W. Richtering, J. Chem. Phys., 2018, 148, 174903 CrossRef CAS PubMed.
- S. V. Nikolov, A. Fernandez-Nieves and A. Alexeev, Proc. Natl. Acad. Sci. U. S. A., 2020, 117, 27096–27103 CrossRef CAS PubMed.
- L. Rovigatti, N. Gnan, A. Ninarello and E. Zaccarelli, Macromolecules, 2019, 52, 4895–4906 CrossRef CAS.
- X. Song, J. Ma, T. Long, X. Xu, S. Zhao and H. Liu, ACS Appl. Mater. Interfaces, 2021, 13, 123–134 CrossRef CAS PubMed.
- R. A. Gumerov, V. Y. Rudyak, A. A. Gavrilov, A. V. Chertovich and I. I. Potemkin, Soft Matter, 2022, 18, 3738–3747 RSC.
- J. Harrer, S. Ciarella, M. Rey, H. Löwen, L. M. Janssen and N. Vogel, Soft Matter, 2021, 17, 4504–4516 RSC.
- E. S. Minina, P. A. Sánchez, C. N. Likos and S. S. Kantorovich, J. Magn. Magn. Mater., 2018, 459, 226–230 CrossRef CAS.
- E. S. Minina, P. A. Sánchez, C. N. Likos and S. S. Kantorovich, J. Mol. Liq., 2019, 289, 111066 CrossRef.
- S. Mavila, O. Eivgi, I. Berkovich and N. G. Lemcoff, Chem. Rev., 2016, 116, 878–961 CrossRef CAS PubMed.
- I. Novikau, E. Minina, P. Sánchez and S. Kantorovich, J. Magn. Magn. Mater., 2020, 498, 166152 CrossRef CAS.
- I. S. Novikau, P. A. Sánchez and S. S. Kantorovich, J. Mol. Liq., 2020, 307, 112902 CrossRef CAS.
- I. S. Novikau, E. V. Novak, E. S. Pyanzina and S. S. Kantorovich, J. Mol. Liq., 2022, 346, 118056 CrossRef CAS.
- M. Wouters, O. Aouane, T. Krüger and J. Harting, Phys. Rev. E, 2019, 100, 033309 CrossRef CAS PubMed.
- A. Dobroserdova, E. Minina, P. A. Sánchez, C. N. Likos and S. S. Kantorovich, Soft Matter, 2024, 20, 7797–7810 RSC.
- K. Kremer and G. S. Grest, J. Chem. Phys., 1990, 92, 5057–5086 CrossRef CAS.
- D. Mostarac, P. A. Sánchez and S. Kantorovich, Nanoscale, 2020, 12, 13933–13947 RSC.
- L. G. Rizzi and Y. Levin, J. Chem. Phys., 2016, 144, 114903 CrossRef CAS PubMed.
- M. U. Witt, S. Hinrichs, N. Möller, S. Backes, B. Fischer and R. V. Klitzing, J. Phys. Chem. B, 2019, 123, 2405–2413 CrossRef CAS PubMed.
- J. Wuttke, Algorithms, 2012, 5, 604–628 CrossRef.
- J. O. Sindt, P. J. Camp, S. S. Kantorovich, E. A. Elfimova and A. O. Ivanov, Phys. Rev. E, 2016, 93, 063117 CrossRef PubMed.
- P. J. Camp, A. O. Ivanov and J. O. Sindt, Phys. Rev. E, 2021, 103, 062611 CrossRef CAS PubMed.
- A. Jarosz, O. Kapusta, D. Gugała-Fekner and M. Barczak, Materials, 2023, 16, 6042 CrossRef CAS PubMed.
- S. Dagdelen, M. Mackiewicz, M. Osial, E. Waleka-Bargiel, J. Romanski, P. Krysinski and M. Karbarz, J. Mater. Sci., 2023, 58, 4094–4114 CrossRef CAS.
- J. K. Wychowaniec and D. F. Brougham, Adv. Sci., 2022, 9, 2202278 CrossRef CAS PubMed.
- B. Sung, M.-H. Kim and L. Abelmann, Bioeng. Transl. Med., 2021, 6, e10190 CrossRef CAS PubMed.
- A. Gonçalves, F. V. Almeida, J. P. Borges and P. I. P. Soares, Gels, 2021, 7, 28 CrossRef PubMed.
- H. Zhang, Z. Li, C. Gao, X. Fan, Y. Pang, T. Li, Z. Wu, H. Xie and Q. He, Sci. Robot., 2021, 6, eaaz9519 CrossRef PubMed.
- J. Tang, Q. Yin, M. Shi, M. Yang, H. Yang, B. Sun, B. Guo and T. Wang, Extreme Mech. Lett., 2021, 46, 101305 CrossRef.
- S. A. Abbasi, A. Ahmed, S. Noh, N. L. Gharamaleki, S. Kim, A. M. M. B. Chowdhury, J.-Y. Kim, S. Pané, B. J. Nelson and H. Choi, Nat. Mach. Intell., 2024, 8, 92–105 CrossRef.
- M. J. Buehler and S. Y. Wong, Biophys. J., 2007, 93, 37–43 CrossRef CAS PubMed.
- J. D. Weeks, D. Chandler and H. C. Andersen, J. Chem. Phys., 1971, 54, 5237–5247 CrossRef CAS.
- S. Ota and Y. Takemura, J. Phys. Chem. C, 2019, 123, 28859–28866 CrossRef CAS.
- D. Frenkel and B. Smit, Understanding molecular simulation, Academic Press, 2002 Search PubMed.
- I. Pagonabarraga, Novel Methods in Soft Matter Simulations, Springer, 2004, pp. 279–309 Search PubMed.
- B. Dünweg and A. J. C. Ladd, Lattice Boltzmann Simulations of Soft Matter Systems, 2008 Search PubMed.
- F. Weik, R. Weeber, K. Szuttor, K. Breitsprecher, J. de Graaf, M. Kuron, J. Landsgesell, H. Menke, D. Sean and C. Holm, Eur. Phys. J.-Spec. Top., 2019, 227, 1789–1816 CrossRef.
- F. Biscani and D. Izzo, J. Open Source Softw., 2020, 5, 2338 CrossRef.
Footnote |
| † Electronic supplementary information (ESI) available. See DOI: https://doi.org/10.1039/d4sm00797b |
| This journal is © The Royal Society of Chemistry 2024 |

