 Open Access Article
Creative Commons Attribution 3.0 Unported Licence
Transport and clogging dynamics of flexible rods in pore constrictions†
Berinike
Bräsel
 a,
Matthias
Geiger
 a,
John
Linkhorst
 a and
Matthias
Wessling
 *ab
*ab
aChemical Process Engineering AVT.CVT, RWTH Aachen University, Forckenbeckstraße 51, 52074 Aachen, Germany. E-mail: manuscripts.cvt@avt.rwth-aachen.de
bDWI – Leibniz Institute for Interactive Materials e.V., Forckenbeckstraße 50, 52074 Aachen, Germany
First published on 13th August 2024
Abstract
The transport and clogging behavior of flexible particles in confined flows is a complex interplay between elastic and hydrodynamic forces and wall interactions. While the motion of non-spherical particles in unbounded flows is well understood, their behavior in confined spaces remains less explored. This study introduces a coupled computational fluid dynamics-discrete element method (CFD-DEM) approach to investigate the transport and clogging dynamics of flexible rod-shaped particles in confined pore constrictions. The spatio-temporal analysis reveals the influence of the rod's initial conditions and flexibility on its transport dynamics through a pore constriction. The simulation results demonstrate an increase in the lateral drift of the rod upon exiting the pore that can be scaled with channel height confinement. The clogging dynamics are explored based on hydrodynamic and mechanical forces, unveiling conditions for mechanical clogging through sieving. The developed method allows for the deconvolution of the forces that contribute to particle trajectories in confined flow, which is highly relevant in particle separation processes, fibrous-shaped virus filtration, biological flows, and related applications. The method is embedded into the open-source CFDEM framework, facilitating future extensions to explore multiple particle dynamics, intermolecular forces, external influences, and complex geometries.
1 Introduction
The separation of soft matter through filters is of great relevance in water purification, bioprocessing, and the health and food industry. The hydrodynamic transport and clogging behavior of soft particles is a function of their properties, such as flexibility, shape, and size, and is determined by a complex interplay between elastic and hydrodynamic forces and interactions with solid walls.1,2 Soft and elongated particles, such as bacteria and viruses, are able to transfer through membrane pores that are smaller than their size because of their ability to deform or reorient in front of the pore. This phenomenon can lead to a significant loss of selectivity in the filtration process.3–5 A fundamental understanding of the transport dynamics of flexible particles in confined flow is crucial to predicting and controlling separation processes, but it is also important to various other fields, such as microfluidics, biological processes, drug delivery, tissue engineering, and cell sorting. Particles flowing in unbounded geometries at low Reynolds numbers, where inertia can be neglected, follow the streamlines of the fluid due to the kinematic reversibility of the Stokes equations. Non-spherical but axis-symmetric particles follow well-described Jeffery orbits unless symmetry is broken, where cross-streamline transport can also occur.6 The flow conditions and, therefore, the transport dynamics are significantly changed when particles are confined by bounding walls. The particles act as a moving obstacle to the flow, leading to flow perturbations and a change in the hydrodynamic forces that act on the particle.7 For confined planar channels, namely Hele-Shaw channels, it was shown that axis-symmetric particles, such as rods, drift in the lateral direction8 of the channel and additionally show deformation in case of flexibility.9 For additional lateral confinement, an oscillatory behavior was observed, which can be controlled by adjusting the geometry of the particle and the channel.10 Even for complex-shaped particles in confined flow, a universal trajectory can be identified as long as the particles have at least one mirror plane.11 They rotate in the plane to align their mirror axis with the flow while laterally drifting with their final position depending on their symmetry.12 Flexible particles moving through a constriction show deformation, which depends mainly on the properties of the particle and the constriction, such as flexibility, shape, and size.13 Deformation is induced by fluid forces and interactions with the walls inside the constriction. The transport and deformation behavior of flexible spherical particles moving through a restriction were intensively studied both experimentally14–17 and numerically.18–22 Haghfooie et al. studied the transport and deformation of flexible disk-like particles with varying shapes in single pore constrictions.15 Also, the deformation behavior of healthy,23–26 and diseased27 red blood cells in a small microchannel has been the subject of research in the past decade. The flow of flexible elongated particles past an obstacle in a Hele-Shaw geometry was experimentally analyzed by Lopez et al.,28 identifying the role of curved streamlines on the particle's transport and deformation behavior. Recently, Han et al.29 used a 2D finite element method to investigate the transport and folding behavior of highly deformable elongated particles in pore constrictions. Nguyen et al.30 and Chakrabarti et al.31 both used the numerical slender body theory to identify the dynamics of flexible rods near walls and during flow through porous media. Based on a bead-chain approach, Makanga et al.32 numerically investigated the dynamics of flexible rods settling in a viscous fluid embedded with obstacles of arbitrary shapes. Based on dissipative particle dynamics, Posel et al.33 simulate the controlled transport of flexible polymers through coated slit and cylindrical pores. To our knowledge, there is currently no detailed study of the coupled effect of channel height confinement and pore constriction on the transport and clogging dynamics of non-spherical and flexible particles. Experimentally, it is nearly impossible to precisely set a channel height confinement between the particle and the channel wall and a defined initial position in front of the pore. In numerical studies, the main challenge is to implement a method capable of modeling the deformation of the particle and providing high resolution of the flow disturbance and the viscous friction caused by channel confinement while remaining computationally efficient.In this work, we present a coupled computational fluid dynamics-discrete element method (CFD-DEM) methodology that overcomes these challenges. We simulate the hydrodynamic transport and clogging dynamics of flexible rod-shaped particles in confined flow. The rod is represented by multiple sub-spheres connected via elastic bonds, allowing it to undergo deformation. The fluid surrounding the sub-spheres is sufficiently resolved to allow four-way coupling of the rod and the fluid. We compare our model with experimental and theoretical observations on the motion of flexible rods in Hele-Shaw channels to demonstrate the validity of our method. We further conduct a spatio-temporal analysis of the effect of the rod's initial position and flexibility on its transport dynamics through a pore constriction and compare the identified mechanisms with experimental observations in a similar setup. Lastly, we investigate the clogging dynamics of the rods based on hydrodynamic and mechanical forces as a function of the rod-to-pore size ratio, the rod's flexibility and aspect ratio, and its initial angle. This type of clogging is referred to as clogging through sieving, which occurs when particles are retained by a pore due to size exclusion.34 Our method can be adapted to numerous applications with deformable particles under confined flow to investigate the possibilities of tuning particle trajectories for separation processes or microfluidic devices.
2 Models and methods
2.1 CFD-DEM approach
We use an open-source CFD-DEM coupling software (CFDEMcoupling) that enables a four-way coupling between the fluid flow, calculated by the CFD software OpenFOAM, and particle motion, calculated by the DEM software LIGGGHTS.35,36 CFD and DEM calculations are performed separately but in a parallel manner. The fluid–particle interaction is realized via a momentum exchange conducted at each coupling interval in a resolved matter using the immersed boundary method.Fluid flow is solved using the Navier–Stokes equation considering pressure gradient forces and viscous forces of the fluid. In our case, other fluid forces, such as Basset, Saffman, and Magnus forces and gravity effects, are small and therefore neglected.
For the representation of a flexible rod, we use a multi-sphere model with virtual elastic bonds for connection that was developed by Guo et al.37 and Schramm et al.38 A bond connects two neighboring spheres at their center via a spring-damper model. A relative movement of the individual spheres leads to a deformation of the bond and a generation of bond forces and moments that are transferred to the connected spheres. Thus, a deformation of the rod can be simulated that is limited to the number of sub-spheres chosen to represent the rod. Since the shape of the rod is simplified by sub-spheres, inaccuracies in modeling a particle having a smooth surface can affect the predicted fluid–particle interactions and the particle's deformation.39 In this work, we use at least a number of 10 sub-spheres, which were found to sufficiently reproduce even large deformation behavior.37 In addition, we carefully validate the method with experimental data to ensure that the relationship between deformation and fluid forces is adequately represented under the prevailing flow conditions.
In the DEM framework, the trajectory of each sub-sphere within the multi-sphere rod is calculated individually based on the sum of the forces acting on it, such as contact forces, fluid forces, and gravity. The latter is small and neglected in this work. Normal and tangential particle–particle and particle–wall contact forces are calculated with the Hertz contact model.40 In addition to the Hertz model, we consider rolling friction and tangential sliding. Rolling friction arises from the small-scale non-sphericity of the particles and is taken into account by using a constant directional torque (CDT) model. A history spring model is chosen to account for the resistance from tangential sliding.35 A detailed description of the used method and its governing equations can be found in the ESI.†
2.2 Simulation setup
To validate the flexible particle model with respect to the motion of flexible rods in confined flow, simulations are performed in a Hele-Shaw geometry and compared to the experimental work by Cappello et al.9Fig. 1(a) shows the simulation domain of the Hele-Shaw setup, including the geometric dimension and the applied boundary conditions. | ||
| Fig. 1 Simulation setup: (a) Hele-Shaw geometry with (b) corresponding fluid flow profile; (c) confined channel with a pore constriction with (d) corresponding fluid flow profile. | ||
Periodic boundaries are applied on the DEM side in the x-direction, allowing the rod to leave and re-enter the simulation domain, mimicking an infinitely long channel. On the CFD side, no periodic boundaries but a constant pressure difference between the channel's inlet and outlet is applied, inducing a steady laminar flow with a plug flow profile in the x–y-plane and a Poiseuille flow profile in the confined x–z-plane. The constant velocity field ensures a smooth transition of the particle across the boundaries. The corresponding fluid flow profiles are shown in Fig. 1(b) for pure fluid flow. The used simulation parameters are listed in Table 1. The geometric dimensions of the rod and the channel are chosen analogously to the experimental setup introduced by Cappello et al.9 To increase numerical stability and simulation speed, lower values for the fluid viscosity and higher values for the fluid velocity were chosen than in the experiments. Since laminar flow conditions in the channel are assured, the rod's motion can be compared qualitatively. The resulting channel Reynolds number is  with L being defined as
  .
.
| Parameter | Symbol | Value | Unit | |
|---|---|---|---|---|
| Hele-Shaw geometry | ||||
| Rod | Diameter sub-sphere | d Sphere | 54 | μm |
| Number of sub-spheres | N | 15 | — | |
| Length | L Rod | 810 | μm | |
| Density | ρ p | 1120 | kg m−3 | |
| Young's modulus | E p | 2.0 | kPa | |
| Poisson ratio | ν p | 0.45 | — | |
| Coefficient of restitution | e | 0.6 | — | |
| Friction coefficient | μ fr | 0.5 | — | |
| Rolling friction coefficient | μ r | 0.05 | — | |
| Bond damping coefficient | β damp | 0.1 | — | |
| Solvent | Density | ρ f | 1000 | kg m−3 |
| Viscosity | η f | 1 | mPa s | |
| Channel | Width | W | 3.5 | mm |
| Length | L | 2.5 | mm | |
| Height | H | 65 | μm | |
| Timesteps | CFD timestep | ΔtCFD | 1 × 10⁻⁵ | s |
| DEM timestep | ΔtDEM | 1 × 10⁻⁶ | s | |
| Coupling interval | CI | 10 | — | |
| Pore constriction | ||||
| Rod | Diameter sub-sphere | d Sphere | 3 | μm |
| Number of sub-spheres | N | 10–200 | — | |
| Density | ρ p | 1170 | kg m−3 | |
| Young's modulus | E p | 15–15![[thin space (1/6-em)]](https://www.rsc.org/images/entities/char_2009.gif) 000 000 |
kPa | |
| Poisson ratio | ν p | 0.3 | — | |
| Coefficient of restitution | e | 0.6 | — | |
| Friction coefficient | μ fr | 0.5 | — | |
| Rolling friction coefficient | μ r | 0.05 | — | |
| Bond damping coefficient | β damp | 0.1 | — | |
| Solvent | Density | ρ f | 1170 | kg m−3 |
| Viscosity | η f | 1 | mPa s | |
| Channel | Width | W | 200 | μm |
| Length | L | 600 | μm | |
| Height | H | 5–50 | μm | |
| Constriction radius | R | 85 | μm | |
| Timesteps | CFD timestep | ΔtCFD | 1 × 10⁻⁹–5 × 10⁻⁸ | s |
| DEM timestep | ΔtDEM | 1 × 10⁻¹⁰–1 × 10⁻⁹ | s | |
| Coupling interval | CI | 10/50 | — | |
Further, a second setup was developed to study the motion and clogging dynamics of a flexible rod in a pore constriction, using the simulation domain shown in Fig. 1(c). A constant velocity is applied at the channel inlet, leading to a laminar flow profile (Re = 2) in the channel and an acceleration of the fluid within the pore constriction as depicted in Fig. 1(d). The simulation parameters, as listed in Table 1, align with those used in typical microfluidic experiments in the field of membrane fouling investigations.41
For both simulation setups, we took four numerical stability criteria into account to choose the CFD and DEM timestep and the resulting coupling interval. The CFD timestep is chosen according to the Courant–Friedrich–Lewy condition.42 The DEM timestep was calculated based on the Rayleigh time step, and a conservative value below 15% of the Rayleigh time was chosen to ensure stability. The resulting coupling interval was checked for a stability criterion of the solid–fluid coupling and the fluid–solid coupling. The used stability criteria are listed in the ESI.† To save computational costs, we use a dynamic mesh approach for meshing the simulation domain on the CFD side. The basic mesh around the rod is refined and moves along with the rod. Investigations showed that a minimum resolution of 8 cells around a sphere is required for accurate results.43 For both simulation setups, the basic mesh size is chosen to ensure this requirement for each sub-sphere after a 3-level refinement. The mesh, the timesteps, and the coupling interval are adjusted in the simulations with a change in channel height, the number of sub-spheres, and rod flexibility to ensure that the stability criteria are fulfilled consistently in every setup. An additional study on mesh and timestep independence was carried out for individual cases.
2.3 Mechanical characterization
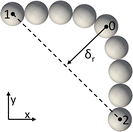
For analysis of the flexible rod's flow behavior, three parameters are defined: the angle of the rod in the x–y-plane with respect to the fluid, the relative deflection in the x–y-plane, and the relative displacement of the rod from the channel center in the y-direction. The angle α of the rod in the x–y-plane is calculated based on the distance between the two spheres at both ends of the rod Δx = x1 − x2 and Δy = y1 − y2: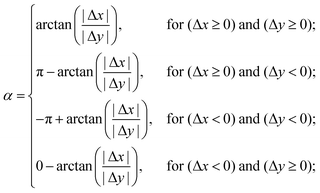 | (1) |
 | (2) |
3 Results and discussion
3.1 Validation of the flexible particle model
The CFD-DEM approach for the flow of a flexible rod in confined channels is tested by comparing its motion and deformation behavior in a Hele-Shaw channel with experimental data. Fig. 3(a) shows a superposition of simulation snapshots of a rod being placed in the center of the channel with an orientation perpendicular to the fluid flow direction. To imitate the non-idealities present in the experiments, the rod was inserted with a slight angle of 1° and an offset of one sub-sphere diameter from the center line. The rod moves through the three characteristic states observed and characterized by Cappello et al.:9 transition, equilibrium, and reorientation. In the first transition state, the rod deforms into an inverted C-shape. Once the maximum deflection is reached, this deflection stays constant while the rod moves laterally to the channel wall. In the last reorientation state, the rod aligns with the fluid flow, and the deflection decreases. Fig. 3(b) and (c) compare the change in angle and deflection over the channel length between simulations and experiments, respectively. The motion and deflection predicted by the CFD-DEM simulations are in good agreement with the experimental data. Small deviations between simulation and experiment may be caused by differences in the selected particle and fluid properties, namely Young's modulus, viscosity, and fluid velocity, and assumed model-specific parameters, such as the damping coefficient of the bonds between the sub-spheres. For further validation, we conducted simulations for varying channel height confinement β = dSphere/H and compared the change in rod velocity in relation to the fluid velocity to that obtained by experiments from Berthet et al.8 and a numerical correlation developed by Champmartin et al.7 The simulation results depicted in Fig. 3(d) align with the values obtained by both the experiments and the numerical correlation. An increase in channel height confinement leads to higher viscous friction in the gaps between the rod and channel wall and, thus, to a reduction of rod velocity in relation to the fluid velocity. This reduction is captured by the simulations, whereas the velocity values are slightly higher than those from the experiment and numerical model. We assume that the latter is caused by the idealized simulation approach, which leads to an underestimation of the frictional viscous forces. In addition, the simplified model representation of the rod by sub-spheres can lead to deviations in the predicted fluid–particle interactions and the particle's deformation. Overall, the simulation results resemble the data from the literature regarding the motion and deformation behavior of a flexible rod flowing in a confined channel, indicating the reliability of the presented CFD-DEM approach.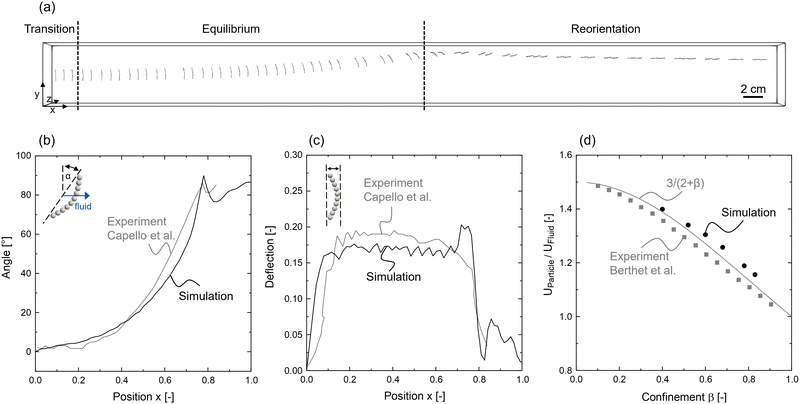 | ||
| Fig. 3 (a) Transport dynamics of a flexible rod in a Hele-Shaw channel showing the three characteristic states after Cappello et al.:9 transition, equilibrium, reorientation; comparison of simulated and experimental results regarding the change in (b) rod angle and (c) deflection during motion through the channel; (d) comparison of simulated, experimental8 and numerical results7 regarding the reduction in rod velocity with increasing channel height confinement β. | ||
3.2 Experimental observations: transport in a pore constriction
We conducted experiments with a stiff rod moving through a channel with a pore constriction mimicking the conditions from the simulation setup described in Fig. 1(c) and (d). The rods are in-chip direct laser written into microfluidic channels. This allows for precisely placing the particles at specific locations and orientations. Information about the used materials and method are provided in the ESI† (Section S3). Fig. 4 displays a series of superimposed snapshots capturing different time steps of a stiff rod moving through a pore constriction for an initial angle of α = 0° and 45° and an initial offset of Δy = 0. From the experimental observations, we find two transport phenomena induced by the pore: rotational movement and an increase in lateral drift. The rod undergoes a rotational movement while moving through the pore constriction. Depending on its initial angle, it returns to its original orientation (α = 0°) behind the pore, or an offset between the initial and exit angle remains (α = 45°). While there is no lateral drift observable for the case of α = 0°, a slight drift in front of the pore and an increasing drift behind the pore is apparent for the rod with an initial angle of α = 45°.Performing the experiments in this work requires a two-photon photoresin with low viscosity to allow the pumping of the resin through a microfluidic chip and printing into flow. Additionally, a strong optical contrast between the printed particle and the surrounding resin is required to allow visual observation of the rod's behavior. All commercially available resins that fulfill these criteria are stiff, with E-moduli in the MPa to GPa range.
The presented simulation method allows us to further study the experimentally observed effects, including the role of the rod's flexibility, initial angle and offset, and channel confinement in influencing the rod's transport dynamics.
3.3 Transport dynamics: role of flexibility
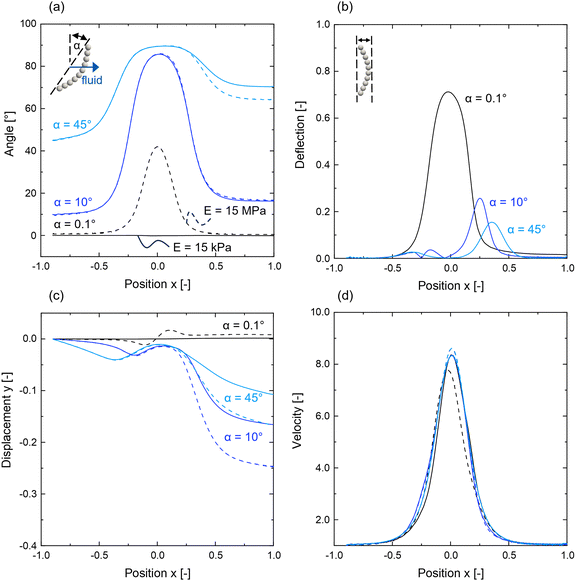
The hydrodynamic motion of a rod through a pore constriction is analyzed for two Young's moduli E = 15 kPa and E = 15 MPa regarding the rod's change in angle, deflection, channel displacement in y-direction, and velocity. For both Young's moduli, three different initial angles and offsets are investigated.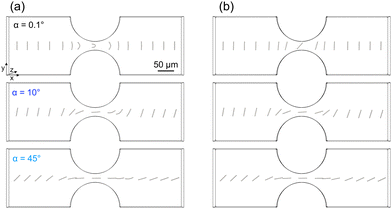 | ||
| Fig. 5 Transport dynamics of a rod with (a) E = 15 kPa and (b) E = 15 MPa in a pore constriction for three initial angles α = 0.1°, 10°, 45°, with LRod/dPore = 1, and initial offset Δy = 0. | ||
Depending on its flexibility and initial angle, the rod either reorientates with the flow, deflects while moving through the pore, or shows a combination of both. Since no deflection can be observed for the stiffer rod with E = 15 MPa, only the data of E = 15 kPa (solid lines) is shown in Fig. 6(b). Besides the rotational and deflection dynamics, all rods with an initial angle other than α = 0.1° and α = 90° undergo a lateral drift in the y-direction, as indicated in Fig. 6(c). The simulation results demonstrate the same trends regarding the rod's rotation and drift behavior as our experimental observations in Fig. 4(b): (1) depending on its initial orientation, the rod aligns to a certain extent with the flow while moving through the pore. Upon leaving the pore, the rod reorients itself and approaches the initial angle again, whereas an offset between the initial and final angle remains, as depicted in Fig. 6(a). (2) A lateral drift of the rod is observed before and after its movement through the pore constriction, whereas the magnitude of drift temporarily increases after the pore.
The aligning and reorientation behavior of the rod (1) is caused by the symmetrical flow conditions around the pore. In the regions of the pore inlet and outlet, the rod experiences an inhomogeneous force distribution along its length, which originates from the change in fluid profile. Due to the rod's elongated shape, both ends are exposed to regions of different fluid velocities and directions. Thus, a rotational movement is caused by hydrodynamic torques. While rotating with the flow, viscous friction resists this rotational movement. This dissipation leads to the particle not recovering its initial angle.
Three physical mechanisms lead to the rod moving perpendicular (y-direction) to the flow (2): flow convergence and divergence at the pore; a drift force resulting from the rotational movement of the rod; a drift at constant rod orientation apparent in confined channel flows. The latter is caused by a difference in the rod's transport velocity components perpendicular and parallel to the flow direction, resulting in a drift component in the case of a tilted rod. This phenomenon is experimentally and numerically described in the work of Berthet et al.8 for a stiff rod in a Hele-Shaw channel. At a constant channel height confinement β, the drift of a rod is strongest at an angle of 45° and reduces to zero when the rod's orientation approaches 0° or 90°. The drift in front and behind the pore results in the rod not being transported at the center of the pore with respect to the y-direction. Thus, the rod experiences asymmetrical flow conditions in front and behind the pore and consequently moves asymmetrically due to a shear force gradient. The simulation results in Fig. 6(a) and (b) also show that a deflection simultaneous to the drift behind the pore diminishes this drift. Since the rotational movement, and thus the resulting angle behind the pore, is comparable for the two Young's moduli, we assume the discrepancies in drift result mainly from reduced hydrodynamic drag forces in the case of a deflected rod. The rod is compressed in length perpendicular to the flow direction, leading to a slightly reduced area of acting fluid forces.
With respect to the deflection dynamics in the case of the softer rod with E = 15 kPa and initial angles of α = 10° or 45° (see Fig. 6(b)), we find that the inflow behavior of the rod is independent of its flexibility. During inflow, the rod deflects only slightly, while a stronger deflection occurs during the outflow of the pore, which correlates with the rod's orientation. The more the rod is aligned with the flow, the smaller the maximum deflection, since deflection is caused by an inhomogeneous force distribution along the rod. Additionally, the position of the maximum deflection is shifted further along the x-direction with increasing initial angle.
The rod's velocity is shown in Fig. 6(d) relative to the mean fluid velocity at the channel inlet. When the rod approaches the pore it is accelerated, while it is slowed down upon exit. The outcomes indicate that the rod's initial orientation or its flexibility does not markedly influence its velocity. However, the offsets between the peaks of deflection and velocity (see Fig. 6(c) and (d)) demonstrate the influence of the initial angle on the inertial behavior of the rods. It should be noted that under the idealized simulation conditions, the rods do not move or rotate in the z-direction. The rod is perfectly aligned along the z-axis, leading to symmetric flow conditions. Consequently, this symmetry ensures that the fluid forces acting on the rod are identical with respect to the z-direction.
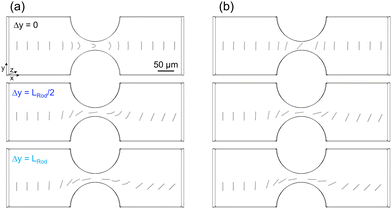 | ||
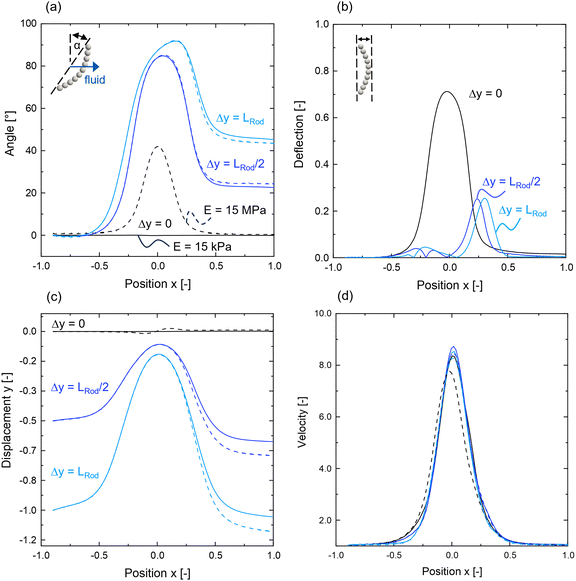
| Fig. 7 Transport dynamics of a rod with (a) E = 15 kPa and (b) E = 15 MPa in a pore constriction for three initial offsets Δy = 0, LRod/2, LRod and with LRod/dPore = 1, and initial angle α = 0.1°. | ||
During movement through the pore, the rods with an initial offset from the channel center maintain their offset inside the pore as they are confined in their respective streamlines. As a result, the rods are exposed to asymmetrical flow conditions, just like a tilted rod that experiences cross-streamline migration due to a lateral drift. The acting shear forces lead to the observed rotational behavior. While there is no significant difference in rotational behavior apparent for the two Young's moduli, additional temporal deflection occurs behind the pore for the softer rod with E = 15 kPa, as depicted in Fig. 8(b). This deflection is caused by velocity differences along the rod length, as discussed in the previous section. Additionally, the simulation results suggest a stronger final displacement in the y-direction in the case of the stiffer rod with E = 15 MPa compared to the softer rod with 15 = kPa (see Fig. 8(c)). This aligns with our previous observations regarding a correlation between the rod's deflection and its lateral drift in Fig. 6(b) and (c). No significant influence of the rod's initial offset on its velocity can be observed, as demonstrated in Fig. 8(d).
3.4 Transport dynamics: role of confinement
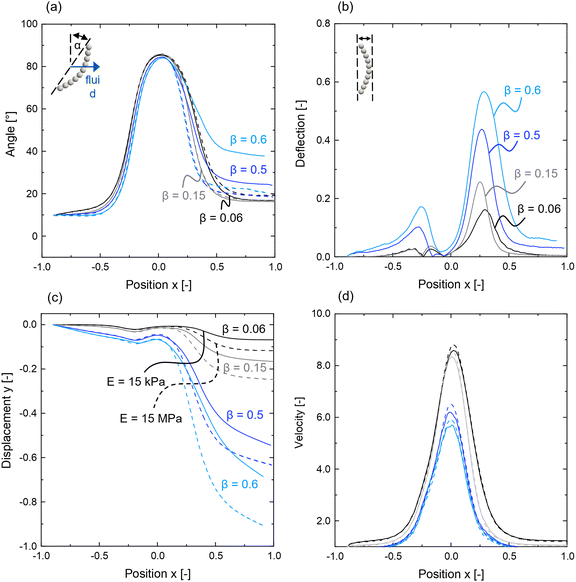
We tested the impact of channel height confinement β = dSphere/H on the transport behavior of a rod moving through a pore constriction for two Youngs moduli E = 15 kPa and E = 15 MPa with LRod/dPore = 1, an initial angle α = 10°, and an initial offset Δy = 0. The simulation results are analyzed with respect to the rod's (a) angle, (b) deflection, (c) displacement in the y-direction of the channel, and (d) velocity and are shown in Fig. 9. In the investigated range of β = 0.06–0.6, we find that the qualitative motion of the rod is not affected by a change in channel height confinement. However, in the case of the softer rod with E = 15 kPa, the offset between the initial and final angle, the deflection, and the lateral drift in front and behind the pore increase with channel height confinement (see Fig. 9(a)–(c)). With increased channel height confinement β, the gaps between the rod and the channel wall are reduced, which results in higher viscous friction and stronger perturbation of the flow field caused by the rod.8 From this follows the observed increases in deflection and lateral drift and a reduction in the rod's velocity (see Fig. 9(d)). A significant increase in the final angle only applies for channel height confinements above β = 0.5, as shown in Fig. 9(a). We assume the strong increase in rod deflection (see Fig. 9(b)) to be the cause of this effect. The rod's final orientation seems to be significantly influenced only above a minimum level of deflection. The rotation dynamics of the stiffer rod with E = 15 MPa, which experiences only reorientation and no deflection during its motion through the pore, are only slightly affected by a change in channel height confinement (see Fig. 9(a), dashed lines). These small differences can be attributed to the change in lateral drift of the rod, which significantly increases with channel height confinement β in front and behind the pore (see Fig. 9(c), dashed lines). The increase in lateral drift with channel height confinement β is more pronounced for the stiffer rod of E = 15 MPa than for the softer one with E = 15 kPa, due to the previously discussed correlation between the rod's drift and deflection.3.5 Clogging dynamics: role of flexibility and size
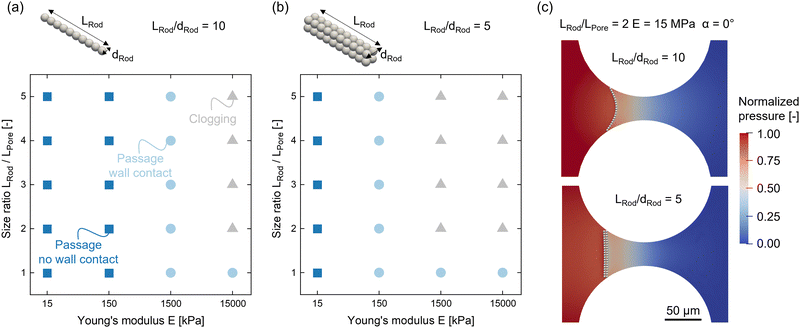
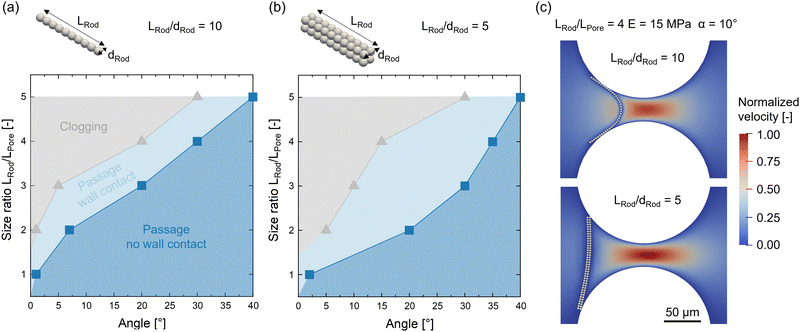
So far, we have considered a rod-to-pore size ratio of LRod/LPore = 1, for which we observe the passage of the rod for both investigated Young's moduli E = 15 kPa and 15 MPa. We further study the mechanical clogging of the pore through sieving as a function of rod-to-pore size ratio LRod/LPore = 1–5, rod aspect ratio LRod/dRod = 5, 10, and Young's moduli E = 15 kPa–15 MPa, as shown in Fig. 10 for an initial rod position of α = 0° and Δy = 0. For E = 15 MPa, we additionally identify the clogging conditions depending on the initial angle α with an accuracy of 1–5°, see Fig. 11. To adjust the rod-to-pore size ratio, the rod's length LRod is increased by adding additional sub-spheres of identical diameter to the rod while the geometry of the pore is kept constant. A change in rod aspect ratio is realized by increasing the cross-section from one sphere to four spheres, as displayed in the sketch in Fig. 10(b). This approach ensures the same resolution of bonds in the main deformation direction. The channel height is increased accordingly to ensure the same channel height confinement of β = 0.15 for both cases. In our simulation, we neglect intermolecular forces between the rod and the pore wall, such as adhesive van der Waals forces or electrostatics. This allows us to study the clogging dynamics of the rods only based on hydrodynamic forces and friction during contact with the channel walls.For the investigated cases, we can identify three mechanisms: (1) passage with no wall contact, (2) passage with wall contact, and (3) clogging by wall entrapment. With an increased rod aspect ratio, clogging occurs at lower Young's moduli (see Fig. 10(a) and (b)). An increase in the rod's aspect ratio corresponds to an increase in diameter, which results in higher resistance against hydrodynamic forces and less deformation. When the rod's aspect ratio is increased, this leads to clogging at lower Young's moduli. Fig. 10(c) shows clogged rods and the surrounding pressure fields for both aspect ratios LRod/dRod = 10 and 5, with LRod/LPore = 2, and E = 15 MPa, respectively. The visual comparison between the two cases of different aspect ratios shows how the deflection of the rod with a lower aspect ratio of LRod/dRod = 5 is significantly reduced. The entrapment of the rod leads to increased pressure in front of the rod and a sudden pressure drop behind it, which is comparable for both aspect ratios.
The results in Fig. 11(a) and (b) demonstrate a lower tendency of clogging with increasing rod alignment and lower rod-to-pore size ratios. From a comparison between the two cases of rod aspect ratio, no obvious trend can be derived. Whether a rod clogs a pore due to hydrodynamic and mechanical mechanisms depends on a complex interplay between the rod's properties and its approach toward the pore. While a higher aspect ratio of the rod leads to less deformation and, thus, an increased tendency to clogging, less deformation also results in a higher alignment of the rod with the flow. As a result, higher drift and asymmetric clogging are observed for rods with initial angles α ≥ 0, which reduces the tendency of clogging again. An example of asymmetric clogged rods with increased asymmetry for a lower rod aspect ratio in the case of LRod/dRod = 5 is shown in Fig. 11(c) with LRod/LPore = 4, and E = 15 MPa. The surrounding velocity field is presented indicating the respective disturbance of the fluid flow as the rod acts as an obstacle at the pore entrance.
The simulation's outcomes offer a theoretical understanding of the processes that result in the mechanical clogging of flexible rods, influenced by an interplay between the rods’ properties, their inflow behavior, and the pores’ geometry. In future studies, the setup could be extended to capture real-life non-idealities, such as inhomogeneities of the flow field and the rod's structure, irregular wall roughness, and other influencing factors, such as intermolecular forces and multiple particle effects.
4 Conclusion
In this work, we introduce a coupled CFD-DEM approach to predict the hydrodynamic motion of flexible rods in confined flow. We validate the method against experimental and numerical observations, demonstrating its reliability. We further investigate the transport and clogging dynamics of flexible rods through a pore constriction. We find a correlation between rotation and deflection of the rod while moving through the pore, which depends on the rod's flexibility, initial angle, and initial position with respect to the channel center. Rods with an angle between a parallel and perpendicular orientation to the flow direction show a lateral drift, which is amplified by the motion through the pore. Soft rods that undergo deflection show a smaller drift behind the pore than stiffer ones, which only show a rotational movement. We vary the channel height confinement and find a significant increase in the rod's deflection and the degree of lateral drift behind the pore. With an alteration of the rod-to-pore size ratio, the rod's aspect ratio, the Young's modulus, and the rod's initial angle, we identify the conditions under which mechanical clogging of the rod occurs and classify our results into three mechanisms: (1) passage with no wall contact, (2) passage with wall contact, and (3) clogging by wall entrapment. We find that clogging due to hydrodynamic and mechanical mechanisms depends on a complex interplay between the rod's properties and its approach toward the pore. The presented simulation method opens up new possibilities for studying the hydrodynamic motion of complex-shaped and flexible particles exposed to confined fluid flow. These findings are highly relevant to applications such as membrane filtration, shape-based separation, particle flow in the vascular system, and drug delivery. The origin of phenomena observed in these processes is often poorly understood, as they result from a complex interplay of multiple forces. Our theoretical approach allows a decoupling of these forces to understand their effect on the overall process in order to control it. The presented method, integrated into the open-source CFDEM framework, can easily be extended to study further areas of interest, such as multiple particle dynamics, the influence of intermolecular forces, additional external forces, and complex geometries.Author contributions
Berinike Bräsel: conceptualization, methodology, formal analysis, investigation, data curation, writing – original draft, visualization, project administration. Matthias Geiger: investigation, data curation, writing – original draft, visualization. John Linkhorst: conceptualization, writing – review & editing, project administration, supervision. Matthias Wessling: conceptualization, writing – review & editing, resources, project administration, supervision, funding acquisition.Data availability
The authors declare that the data supporting the findings of this study are available within the paper and its ESI.† Should any raw data files be needed in another format they are available from the corresponding author upon reasonable request.Conflicts of interest
There are no conflicts to declare.Acknowledgements
M. W. acknowledges DFG funding through the Gottfried Wilhelm Leibniz Award 2019 (WE 4678/12-1). J. L. acknowledges funding through the DFG project MicSurf (grant no. 514031987).Notes and references
- K. Schroën and I. Bouhid de Aguiar, Sep. Purif. Technol., 2024, 332, 1–9 CrossRef.
- E. Dressaire and A. Sauret, Soft Matter, 2017, 13, 37–48 RSC.
- Y. Wang, F. Hammes, M. Düggelin and T. Egli, Environ. Sci. Technol., 2008, 42, 6749–6754 CrossRef CAS PubMed.
- A. Gaveau, C. Coetsier, C. Roques, P. Bacchin, E. Dague and C. Causserand, J. Membr. Sci., 2017, 523, 446–455 CrossRef CAS.
- R. E. Baltus, A. R. Badireddy, W. Xu and S. Chellam, Ind. Eng. Chem. Res., 2009, 48, 2404–2413 CrossRef.
- T. A. Witten and H. Diamant, Rep. Prog. Phys., 2020, 83, 116601 CrossRef PubMed.
- C. Stéphane, A. Abdlehak and B. R. Abderrahim, ASME 2010 8th International Conference on Nanochannels, Microchannels, and Minichannels Collocated with 3rd Joint US-European Fluids Engineering Summer Meeting, ICNMM2010, 2010, pp. 1677–1685.
- H. Berthet, M. Fermigier and A. Lindner, Phys. Fluids, 2013, 25, 103601 CrossRef.
- J. Cappello, M. Bechert, C. Duprat, O. Du Roure, F. Gallaire and A. Lindner, Phys. Rev. Fluids, 2019, 4, 1–22 Search PubMed.
- M. Nagel, P. T. Brun, H. Berthet, A. Lindner, F. Gallaire and C. Duprat, J. Fluid Mech., 2018, 835, 444–470 CrossRef.
- R. N. Georgiev, S. O. Toscano, W. E. Uspal, B. Bet, S. Samin, R. van Roij and H. B. Eral, Proc. Natl. Acad. Sci. U. S. A., 2020, 117, 21865–21872 CrossRef.
- M. Bechert, J. Cappello, M. Daïeff, F. Gallaire, A. Lindner and C. Duprat, EPL, 2019, 126, 44001 CrossRef.
- C. Yao, B. Liu, L. Li, K. Zhang, G. Lei and T. S. Steenhuis, Environ. Sci. Technol., 2020, 54, 10876–10884 CrossRef PubMed.
- I. Bouhid de Aguiar, M. Meireles, A. Bouchoux and K. Schroën, Sci. Rep., 2019, 9, 1–10 CrossRef.
- R. Haghgooie, M. Toner and P. S. Doyle, Macromol. Rapid Commun., 2010, 31, 128–134 CrossRef CAS.
- S. Li, H. Yu, T. D. Li, Z. Chen, W. Deng, A. Anbari and J. Fan, Appl. Phys. Lett., 2020, 116, 103705 CrossRef CAS.
- C. P. Moore, J. Husson, A. Boudaoud, G. Amselem and C. N. Baroud, Phys. Rev. Lett., 2023, 130, 064001 CrossRef CAS.
- H. R. Shojaei and M. Muthukumar, J. Phys. Chem. B, 2016, 120, 6102–6109 CrossRef CAS.
- P. Khunpetch, X. Man, T. Kawakatsu and M. Doi, J. Chem. Phys., 2018, 148, 134901 CrossRef PubMed.
- Y. Han, H. Lin, M. Ding, R. Li and T. Shi, Soft Matter, 2019, 15, 3307–3314 RSC.
- S. Li, H. H. Yu and J. Fan, Phys. Rev. E, 2021, 104, 1–9 Search PubMed.
- D. Shayunusov, D. Eskin, H. Zeng and P. A. Nikrityuk, Phys. Fluids, 2024, 36, 033333 CrossRef.
- J. B. Freund, Phys. Fluids, 2013, 25, 110807 CrossRef.
- H. Lu and Z. Peng, Phys. Fluids, 2019, 31, 031902 CrossRef.
- L. L. Xiao, C. S. Lin, S. Chen, Y. Liu, B. M. Fu and W. W. Yan, Biomech. Model. Mechanobiol., 2020, 19, 159–171 CrossRef CAS.
- K. Vahidkhah, P. Balogh and P. Bagchi, Sci. Rep., 2016, 6, 1–15 CrossRef PubMed.
- H. Li, L. Lu, X. Li, P. A. Buffet, M. Dao, G. E. Karniadakis and S. Suresh, Proc. Natl. Acad. Sci. U. S. A., 2018, 115, 9574–9579 CrossRef CAS.
- H. M. López, J. P. Hulin, H. Auradou and M. V. D’Angelo, Phys. Fluids, 2015, 27, 013102 CrossRef.
- Y. Han, R. Li, M. Ding, F. Ye and T. Shi, Phys. Fluids, 2021, 33, 012010 CrossRef CAS.
- T. Nguyen and H. Manikantan, Soft Matter, 2024, 20, 1725–1735 RSC.
- B. Chakrabarti, B. Chakrabarti, C. Gaillard, C. Gaillard and D. Saintillan, Soft Matter, 2020, 16, 5534–5544 RSC.
- U. Makanga, M. Sepahi, C. Duprat and B. Delmotte, Phys. Rev. Fluids, 2023, 8, 044303 CrossRef.
- Z. Posel, M. Svoboda and M. Lísal, J. Nanosci. Nanotechnol., 2018, 19, 2943–2949 CrossRef.
- B. Dincau, E. Dressaire and A. Sauret, Phys. Today, 2023, 76, 24–30 CrossRef.
- C. Goniva, C. Kloss, N. G. Deen, J. A. Kuipers and S. Pirker, Particuology, 2012, 10, 582–591 CrossRef.
- C. Kloss, C. Goniva, A. Hager, S. Amberger and S. Pirker, Prog. Comput. Fluid Dyn., 2012, 12, 140–152 CrossRef.
- Y. Guo, C. Wassgren, B. Hancock, W. Ketterhagen and J. Curtis, Powder Technol., 2013, 249, 386–395 CrossRef CAS.
- M. Schramm, M. Z. Tekeste, C. Plouffe and D. Harby, Biosyst. Eng., 2019, 186, 349–355 CrossRef.
- H. Ma, L. Zhou, Z. Liu, M. Chen, X. Xia and Y. Zhao, Powder Technol., 2022, 412, 117972 CrossRef CAS.
- H. Hertz, J. Reine Angew. Math., 1881, 171, 156–171 Search PubMed.
- A. Lüken, L. Stüwe, J. Lohaus, J. Linkhorst and M. Wessling, Sci. Rep., 2021, 11, 1–9 CrossRef PubMed.
- J. H. Ferziger, M. Perić and R. L. Street, Computational Methods for Fluid Dynamics, Springer, 4th edn, 2019, pp. 1–596 Search PubMed.
- A. Hager, C. Kloss, S. Pirker and C. Goniva, J. Comput. Multiphase Flows, 2014, 6, 13–28 CrossRef.
Footnote |
| † Electronic supplementary information (ESI) available: Fluid flow calculation, bonded particle model, stability criteria, experimental observations: materials and methods. See DOI: https://doi.org/10.1039/d4sm00734d |
| This journal is © The Royal Society of Chemistry 2024 |

