 Open Access Article
Creative Commons Attribution 3.0 Unported Licence
Mimicking the hair surface for neutron reflectometry†
Serena
Cozzolino
 ab,
Philipp
Gutfreund
b,
Alexei
Vorobiev
bc,
Anton
Devishvili
bc,
Andrew
Greaves
d,
Andrew
Nelson
 e,
Nageshwar
Yepuri
f,
Gustavo S.
Luengo
 *d and
Mark W.
Rutland
 *aghi
*aghi
aDivision of Surface and Corrosion Science, School of Engineering Sciences in Chemistry, Biotechnology and Health, KTH Royal Institute of Technology, SE-100 44 Stockholm, Sweden. E-mail: mark@kth.se
bInstitut Laue-Langevin, 71 avenue des Martyrs, CS 20156, 38042 Grenoble cedex 9, France
cDepartment of Physics and Astronomy, Materials Physics, Uppsala University, SE-751 20 Uppsala, Sweden
dL’Oréal Research and Innovation, 1 avenue Eugène Schueller, 93600 Aulnay-sous-Bois, France. E-mail: gluengo@rd.loreal.com
eAustralian Nuclear Science and Technology Organisation, Australian Centre for Neutron Scattering, New Illawarra Rd, Lucas Heights, New South Wales, Australia
fAustralian Nuclear Science and Technology Organisation, National Deuteration Facility, New Illawarra Rd, Lucas Heights, New South Wales, Australia
gBioeconomy and Health Department, Materials and Surface Design, RISE Research Institutes of Sweden, SE-114 28 Stockholm, Sweden
hSchool of Chemistry, University of New South Wales, Sydney, NSW 2052, Australia
iLaboratoire de Tribologie et Dynamique des Systèmes, École Centrale de Lyon, 69134 Ecully CEDEX, France
First published on 18th September 2024
Abstract
The surface of human hair is normally hydrophobic as it is covered by a lipid layer, mainly composed of 18-methyleicosanoic acid (18-MEA). When the hair is damaged, this layer can be partially or fully removed and more hydrophilic, mainly negatively charged surfaces are formed with a wide variety of physical and chemical characteristics. The cosmetic industry is currently embracing the opportunity of increasing the sustainability of their hair-care products whilst improving product performance. To do this, it is vital to have a deeper understanding of the hair surface and how it interacts with hair-care ingredients. This work contributes to this by harnessing the potential of neutron reflectometry (NR) with scattering contrast variation to describe hierarchical adsorption. Three types of hair-mimetic surfaces have been produced: two “healthy hair” models to probe the role of lipid structure, and one “damaged hair” model, to consider the effect of the surface charge. Adsorption of hair-care ingredients has then been studied. The results for these relatively short lipid models indicate that a methyl branch has little effect on adsorption. The “damaged hair” studies, however, reveal the unexpected apparent adsorption of an anionic surfactant to a negative surface. This preferential adsorption of the otherwise solubilised neutral components demonstrates a facile route to selectively deliver a protective film on a damaged hair fibre, without the need for a cationic species. On a more general note, this study also demonstrates the feasibility of using NR to characterize such complex systems.
1 Introduction
The hair fibre has a complex layered structure, that can be mainly divided into three regions: medulla, cortex and cuticle (from inner to outermost). Their organization has been elucidated using techniques such as small-angle X-ray scattering (SAXS).1–4 The cuticle is responsible for the surface interaction properties, which can vary depending on a number of conditions.5–8 The surface of hair is hydrophobic in its native state thanks to the presence of a lipid layer covering the protein core,4,9,10 but processes such as bleaching, or weathering, can damage the lipid layer and expose the underlying proteins, making the surface hydrophilic.5,11,12 Specifically, as lipids are bound through a thioester linkage to cysteine residues,13 their removal causes the oxidation of the thiol moieties of cysteines to cysteic acid sulphonates, so that the surface becomes negatively charged.6,7,11,14 The composition of the lipid layer can vary, even though its most abundant component is normally the 18-methyleicosanoic acid (18-MEA).9,10 18-MEA has a characteristic antepenultimate branch whose role is still under study. It is known, though, that it confers fluidity to the lipid layer, modifies chain packing due to its higher cross-sectional area, and it is suggested that it may play a role in the bacteriostatic properties of hair.8,13,15,16To add to the picture, hair-care formulations are also complex mixtures, and the current ones have been optimized over many years. The components of a standard shampoo can be divided into three categories: (1) anionic surfactant (cleansing base, 10–20% w/w), (2) cationic polyelectrolyte (conditioning effect, 0.1–1% w/w), (3) various additives, to obtain the desired properties (such as texture or appearance) or add specific functionalities (e.g., anti-dandruff).7 Given the complexity of the systems, then, some details on the interaction properties of hair particularly with formulations are still missing despite the ongoing research in the field. A deeper knowledge is vital for the cosmetic industry, to improve the performances of their products, and modify the existing formulations. The current challenge is in fact to increase the sustainability of the products while maintaining performance, i.e., to include more bio-sourced ingredients without losing the desired product properties.17–19
Ongoing research in the field is of three types: theoretical studies,20,21 experimental studies on hair,5,6,8,11,12,14,22 and experimental studies on biomimetic surfaces.23–29 These cited papers are just an example of the current state-of-the-art, a more comprehensive description can be found in recent literature reviews.7,18 Experiments on hair target either the single fibre or a tress of hair, to gain information about mechanical and macroscopic properties before and after various treatments, while biomimetic surfaces are a useful tool to investigate complex systems at a molecular level. Experiments on hair-mimetic surfaces can involve simply mica or more complex mimetics, i.e., gold surfaces functionalized by alkylthiols, on which adsorption of target compounds is studied. To our knowledge, however, a specific model replicating the features of 18-MEA is still lacking. Furthermore, adsorption is a complex hierarchical process in mixed systems and few techniques are capable of capturing the spatial distribution of different adsorbates. A technique which is capable of such a spatial resolution is neutron reflectometry (NR), and thus such a biomimetic model would ideally be compatible with NR. This technique requires the use of (coated) silicon blocks with subnanometre roughness, and has proven useful in several studies involving adsorption of surfactants and polymers to both solid/liquid and fluid interfaces (see ref. 30 and references therein).
Here, then, we present the production of three hair-mimetic surfaces, and adsorption on those of simplified formulations. Specifically, sodium dodecyl sulphate (SDS) and chitosan have been chosen as model surfactant and polyelectrolyte, respectively. (SDS is used widely in detergency, but in general sodium laureth sulphate is used in shampoo, whereby an ethoxylated spacer separates the polar headgroup from the hydrophobic tail. This species is both more difficult to deuterate and more ambiguous in terms of interpretation of fitted scattering length density profiles.) Chitosan is a natural polysaccharide (or, as in this work, oligosaccharide) that can be obtained in large quantities and may be a good candidate for a transition to more sustainable formulations.18,31 The study aims at comparing the interaction properties of a branched vs. a straight chain hydrocarbon surface, and of a hydrophobic vs. negatively charged surface. The model negatively charged surface (reproducing sulphonate properties rather than 18-MEA) has been deployed earlier to compare adsorption of different polymers24,25 or polymer/surfactant mixtures26,27 predominantly using techniques such as ellipsometry or quartz-crystal microbalance (QCM). Here we harness the subnanometre resolution of NR which has the advantage of allowing defining hierarchical adsorption from mixtures, thanks to the possibility of contrast variation by deuteration,32 to separately investigate the role of a methyl branch, hydrophobicity and surface charge.
2 Materials and methods
2.1 Chemicals
Functionalized surfaces (Fig. 1) were produced by using either 1-butanethiol (BT), 2-methyl-1-butanethiol (MBT), or sodium 3-mercapto-1-propanesulphonate (PS). They were purchased from Sigma-Aldrich, as well as absolute ethanol. Deuterated and hydrogenous sodium dodecyl sulphate (d-SDS and h-SDS, respectively) were also purchased from Sigma-Aldrich and used without further purification. Chitosan (average molecular weight 3 kDa) was of fungal origin (ChiBio). In the case of the PS surface, the effect of a few additional species was explored, namely the cationic surfactant tetradecyltrimethylammonium bromide (deuterated, d-TTAB; CDN Isotopes) and deuterated dodecanol (produced by the National Deuteration Facility (NDF) at ANSTO). Solutions for neutron reflectometry were prepared using a mixture of deionized water (Milli-Q quality, Millipore) and deuterated water (Sigma-Aldrich). The aqueous surfactant and/or polyelectrolyte solutions were freshly prepared just before each experiment, and the ionic strength was kept constant by addition of 100 mM sodium chloride (Sigma-Aldrich). The chitosan concentration in solution was 100 ppm (0.1 mg mL−1). The SDS concentration was varied as multiples (0.1, 0.5, 2, 20) of its critical micellar concentration (cmc), whose value was taken from literature (8 mM in water and 1.5 mM in 100 mM NaCl33). The chitosan used being an oligomer, it is thus soluble in water,18,34 so the solution pH did not need adjustment. It was, however, measured to ensure that it was below the pKa of chitosan, i.e., below ≈6.5.31,34 It was generally ≈6.0, indicating that chitosan was in its cationic form, albeit with low charge density.35 d-TTAB was used at concentrations of 0.3 and 6 cmc (i.e., 0.26 and 5.3 mM), where the cmc value in the experimental conditions (0.87 mM) was obtained from literature values.36 d-Dodecanol was used to spike h-SDS at a concentration of 5.3 mM, so to have the same molar ratio as SDS/TTAB. | ||
| Fig. 1 Schematics of the three model surfaces described in this paper. BT = 1-butanethiol; MBT = 2-methyl-1-butanethiol; PS = 3-mercapto-1-propanesulphonate. | ||
2.2 Production of hair-mimetic surfaces
BT and MBT were chosen to produce two greatly simplified models of a healthy hair surface, to observe the effect of an antepenultimate methyl branch such as that of 18-MEA. PS was used to mimic a fully damaged hair surface as done earlier for e.g. QCM studies.24–26 The hair-mimetic surfaces were produced by formation of self-assembled monolayers (SAMs) of thiols on gold, that have earlier proved to be useful for various applications.37–41Two samples each were prepared for MBT and PS surfaces, while only one BT sample was produced. The substrates were silicon blocks coated with an adhesion layer of titanium (PS, MBT sample 1) or chromium (MBT sample 2, BT), on top of which a layer of ca. 200 Å of gold was deposited. Ti/Au coating was performed in-house (at KTH in the case of the substrate used for MBT, at ILL for the substrates for PS), while Cr/Au coating was provided by Sil’tronix Silicon Technologies. The gold-coated substrates were immersed overnight in a 1 mM solution of each thiol in absolute ethanol, according to well-established protocols.39 PS was first dissolved in the minimum possible volume of MilliQ water and then diluted in ethanol (ca. 0.5% water in the final solution). As it is known that PS coverage is low,42 and that longer incubation times allow the thiol molecules to improve their packing,39 PS samples were incubated 24 h to ensure the formation of a good quality SAM.
2.3 Neutron reflectometry (NR)
Neutron reflectometry is a useful technique to study adsorbed layers and characterize buried interfaces. A full theoretical description can be found elsewhere.32,43–46Basically, at low incidence angles θ, the specular reflected neutron beam contains information about layer composition normal to the surface. The information is averaged in-plane, but a layer thickness and roughness can be defined. Information on hydration and surface excess of adsorbed species can also be inferred, thanks to the hydrogen/deuterium contrast, and the related SLD (scattering length density) parameter.32 The SLD describes the scattering properties of a molecule based on its atomic composition, and it has very different values for hydrogenous and deuterated molecules. Based on the possibility of contrast variation by deuteration, then, two choices were made. First, either the surfactant or the polyelectrolyte should be deuterated to extract hierarchical adsorption information from a mixture of the two. d-SDS was chosen as it is commercially available. Second, gold contrast-matched water (GCMW) was used as solvent, as it gave the best contrast to both SAM and adsorbed layers. GCMW is composed of 74% D2O and 26% H2O, which gives a total SLD of 4.6 × 10⁻⁶ Å−2, similar to gold.
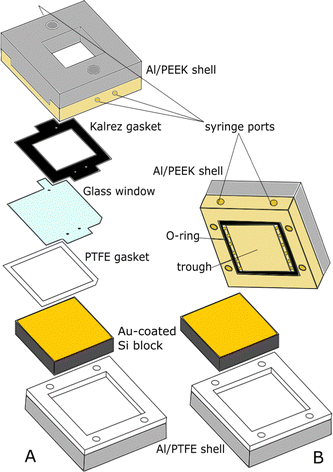
NR experiments were mostly carried out at ILL (Grenoble, France), on the instrument Super-ADAM,47 but part of the experiments on the PS surface were performed at ANSTO (Lucas Heights, NSW, Australia), on the instrument Platypus.48 Super-ADAM is a monochromatic reflectometer, that uses a neutron wavelength λ = 5.21 Å and a horizontal scattering plane. The scanned angle range corresponds to a Q-range of up to 0.3 Å−1, where Q is the momentum transfer vector:  . Note that for this type of experimental configuration, potential over-illumination effects need to be considered (see NR data fitting section in the ESI†). Platypus, instead, is a time-of-flight (ToF) reflectometer with vertical scattering plane. Measurements were run at incident angles of 0.65° and 3°, to cover a Q-range up to 0.26 Å−1. The footprint was chosen to be 60 mm, to exclude contributions to the NR signal from the cell frame. Before functionalizing the surfaces, NR measurements in air were performed on the bare gold substrates to obtain information on the thickness and roughness of the strike layer and gold layer for subsequent fitting. Then, functionalized samples were mounted in a solid/liquid cell, connected to a water bath to maintain a constant temperature of 22 °C. For BT and MBT samples, we used substrates with a surface of 65 × 65 mm2 and a “custom” solid/liquid cell, shown in Fig. 2A and similar to that described in ref. 49. The presence of a glass window allows checking for bubbles on the surface, but this type of cell is not ideal when working with aqueous solutions. For this reason, for the PS sample a more common solid/liquid cell was used (Fig. 2B). The sample studied on Super-ADAM had a surface of 50 × 50 mm2, while the one on Platypus had a surface of 80 × 50 mm2, and it was mounted in a rectangular cell with the same structure as that in Fig. 2B.
Each model surface was first characterized in GCMW (in the presence of 100 mM NaCl except for MBT sample 2 – see below), then the following solutions were injected and characterized: d-SDS at a concentration of 2 cmc, chitosan (100 ppm), a mixture of 20 cmc d-SDS and 100 ppm chitosan, rinsing with GCMW and 100 mM NaCl in between. The surfactant being the main component of a shampoo, it was chosen as the first species to adsorb. To study the effect of the polyelectrolyte, this was first introduced alone in a successive step, then the surfactant/polyelectrolyte mixture was injected to compare its adsorption to that of the sequentially/separately added (depending on whether the rinse in between would result in a clean surface or not) components. The d-SDS/chitosan ratio was chosen to broadly simulate that of actual formulations. 20 cmc d-SDS corresponds to ≈1% w/w anionic surfactant, while 100 ppm chitosan means 0.01% w/w polyelectrolyte. While the solution is ten times more diluted than a real shampoo, the surfactant/polyelectrolyte ratio is representative of a cosmetic product.7,17 In addition, other effects were tested: different SDS concentrations, the presence of salt, the order of injection (see Fig. S15 in the ESI†), a cationic surfactant and the presence of dodecanol. The specific sequences were:
– MBT, sample 1: 0.1, 0.5, 2 cmc d-SDS.
– MBT, sample 2: 2 cmc d-SDS (no salt); 100 ppm chitosan; mixture of 100 ppm chitosan and 20 cmc d-SDS; final rinse. After d-SDS, the sample was rinsed with GCMW and 100 mM NaCl, but this step was not measured due to time constraints.
– BT: 2 cmc d-SDS; 100 ppm chitosan; rinse; d-SDS/chitosan mixture; rinse. The system was rinsed after 2 cmc d-SDS too, but this measurement was not run either because of time constraints.
– PS, sample 1: 2 and 20 cmc d-SDS, rinse; 100 ppm chitosan; rinse; 2 cmc d-SDS; d-SDS/chitosan mixture; rinse.
– PS, sample 2: 20 cmc d-SDS; 20 cmc h-SDS; rinse; 0.3 and 6 cmc d-TTAB; rinse; 20 cmc h-SDS and 6 cmc d-TTAB; rinse; 20 cmc h-SDS and 5.3 mM d-dodecanol; rinse.
d-TTAB concentration in the mixture, similarly to SDS/chitosan, was chosen to represent a cosmetically relevant anionic/cationic surfactant ratio, being the latter present at a maximum concentration of 2% w/w in actual formulations. In the 10× diluted version used for the experiments, that weight percentage corresponds to 5.3 mM d-TTAB, which is about 6 times its cmc. Regarding dodecanol, we chose then to use the same molar ratio as SDS/TTAB.
The Super-ADAM data was reduced using the pySAred software,50 while Platypus data was reduced using a Jupyter Notebook set up for direct beam normalization and background subtraction. Data fitting was carried out using RefNX (v. 0.1.32).51 Briefly, the system is described with a slab model, whose parameters are optimized by a differential evolution algorithm, followed by a Markov-Chain Monte Carlo (MCMC) analysis to check posterior probability distribution of the fitted parameters.51,52 For the MCMC sampling, the parameters were left at the default value except for the following ones: steps, increased to 5000, nburn and nthin, both set to 400. Substrate parameters are fixed from a previous analysis of bare gold NR data. Parameters related to the thiol layer are obtained by fitting the NR curve of the thiol surface in GCMW. They are then fixed for analysis of the next adsorption steps, where one more slab (two if one was not enough to have a good fit) is added to the model. More information on data reduction and fitting can be found in the ESI.†
3 Results and discussion
3.1 Thiol layer structure
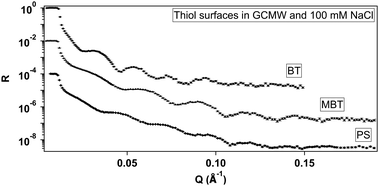
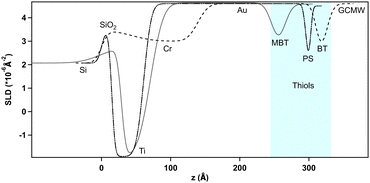
Fig. 3 shows the reduced NR curves for the three thiol surfaces in the presence of 100 mM NaCl in GCMW. Fitting of this data leads to the SLD depth profiles in Fig. 4. The three gold surfaces were prepared on different occasions, and are thus different in the three cases, i.e., BT has a Cr instead of Ti adhesion layer before gold, the deposited layers are thinner in the case of MBT, and the gold surface is smoother in the case of PS. Repeat data can be seen in the ESI,† Fig. S28 and S35.Focusing on the thiol surfaces, Table 1 shows the parameters obtained by data fitting.
| Thiol | Thickness (Å) | Hydration |
|---|---|---|
| BT | 7.0 (0.3) | 0 |
| MBT | 7.2 (0.3) | 0 |
| PS | 6.4 (0.9) | 16% |
The two hydrophobic surfaces, BT and MBT, are practically indistinguishable by NR. The layer thickness is compatible with upright chains,42 and no water is bound to the layer. The PS layer thickness suggests slightly tilted chains on the gold surface, and in this case there is approximately 16% solvent bound to the layer. In the three cases, the thiol roughness follows that of the gold layer (the profile is symmetrical at the two sides of the thiol minimum). The fitting is often rather insensitive to the roughness value, which leads to apparently high uncertainties as a result, so these values are confined to ESI† (Tables S4 and S5).
The depth profiles of Fig. 4 were subtracted from the corresponding profiles of the adsorption steps (shown in the next paragraph), to better compare the characteristics of the adsorbed layers (fitted curves and full SLD profiles can be found in the ESI,† together with the tables of fitted parameters).
3.2 Adsorption of d-SDS and chitosan
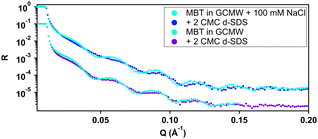
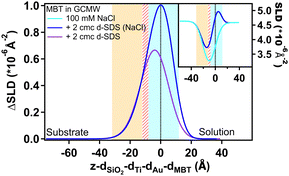
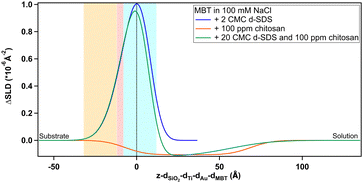
Fig. 5 shows the NR curves of MBT in GCMW, in the absence or in the presence of 100 mM NaCl, compared to the system after injection of 2 cmc d-SDS. In the presence of salt, the change of the NR signal upon d-SDS adsorption is slightly more pronounced; as the following figure shows, this is more than enough to demonstrate a better defined layer after data fitting – a new slab is of course introduced in the model to describe the d-SDS layer. This is seen in Fig. 6, which shows the distribution of the adsorbed layer (via the SLD distribution) on the thiol surface. The zero level on the x-axis is the thiol/d-SDS interface, while on the y-axis the zero is at the gold/solution SLD value (i.e., 4.6 × 10⁻⁶ Å−2).
Fig. 6 also shows as insert the depth profiles before subtraction: as in Fig. 4, the thiol profile appears as an inverse peak due to the negative value of its SLD (−0.25 × 10⁻⁶ Å−2). Adsorption of d-SDS, whose SLD value is instead largely positive, causes an apparent reduction in the depth of the thiol profile. Subtraction of the thiol contribution more clearly shows, then, the amount of adsorbed surfactant. Both profiles in Fig. 6 have nonzero values in the negative region of the x-axis. This can be mostly explained by the roughness of the thiol surface (following the underlying gold roughness), so that the interface is not a flat line at x = 0 but rather it extends in the region delimited by the light blue panel in the graph. We chose to use panels to indicate the roughness at the two sides of the thiol layer rather than its thickness, because roughness affects peak width and position especially in the case of the hydrophobic surfaces, where its value is bigger than the thiol layer thickness. The roughness values used are the mean values tabulated in the ESI† (for Fig. 6, see Table S4, ESI†). Moreover, the possibility for surfactant intercalation in a layer of hydrophobic chains is well known, and was also predicted by theoretical studies.20 As expected from a consideration of screening by electrolyte,53–55 adsorption of charged species to a hydrophobic surface increases with salt concentration and this is indeed observed. Another difference is the higher asymmetry of the profile in 100 mM NaCl, which can be explained by considering that roughness makes some space at negative z-values available for adsorbing species, but once this is filled in, any additional adsorption can only occur in the positive region of the x-axis, shifting the peak to the right.
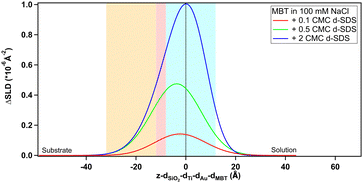
The figure confirms that d-SDS adsorbs on a hydrophobic surface already at low concentrations below the cmc. Again, there is some intercalation between the layers (portion at negative x-values, after the panel delimiting thiol roughness). The amount of adsorbed d-SDS increases with the increase of the bulk concentration, forming a compact layer of 14 Å in the case of 2 cmc d-SDS. This value suggests the formation of a tilted monolayer, as the fully extended SDS chain length is about 17 Å.56 From the fitted profiles of the adsorbed layer at the different concentrations of d-SDS, it is possible to calculate the surface excess, Γ, in terms of mol cm−2, according to the formula Γ = ϕ × τ × ρ/MW, where ϕ = (SLDsolvent − SLDlayer)/(SLDsolvent − SLDdrymolecule) is the volume fraction of the molecule of interest in the adsorbed layer, τ is the layer thickness, ρ is the density of the pure molecule of interest and MW its molecular weight.57,58 For adsorption of d-SDS on MBT, the obtained Γ are 0.1, 0.3 and 0.5 nmol cm−2 for concentrations of 0.1, 0.5 and 2 cmc (= 0.15, 0.75 and 3 mM) d-SDS, respectively (see Table S4 in the ESI† for the fitted values used in the calculations). Applying the same formula to the adsorbed layer in the absence of NaCl (Fig. 6), the surface excess is lower, 0.4 nmol cm−2, despite the molar concentration being higher (2 cmc = 16 mM in the absence of salt). These values are in line with literature data.56,59,60
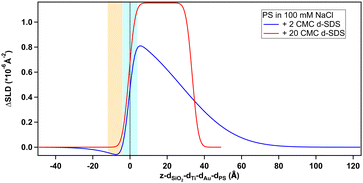
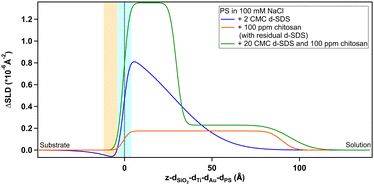
Regarding the negatively charged PS, adsorption of d-SDS was not expected due to the fact that the surfactant is also negatively charged. Nonetheless, a layer was observed on the PS surface, but its characteristics are rather different to the case of MBT (see Fig. 8).
On PS, the adsorbed layers reach their maximum not at the zero level as on MBT, but around the upper limit of thiol roughness. This suggests molecules are not in direct contact, but rather the adsorption is mediated by the solvent and the supporting electrolyte. At 2 cmc d-SDS, the formed layer is rather thick but also inhomogeneous and quite hydrated (see Table 2). The minimum below zero in Fig. 8 is an artefact, enhanced by substrate subtraction, and caused by the relative values of thiol and d-SDS layer thickness and roughness. It is within the error of the analysis, so it has no physical meaning. Calculating the surface excess as above, results in the same value of 0.5 nmol cm−2, as for MBT and BT, but spread on a thicker layer rather than organized in a monolayer.
| [d-SDS] | Thickness (Å) | Hydration (%) |
|---|---|---|
| 2 cmc | 28 (10) | 41 |
| 20 cmc | 34 (1) | 23 |
Increasing the concentration of d-SDS to 20 cmc, the anomalous adsorbed layer becomes better defined: the thickness is only slightly higher, but its associated error is definitely lower, as are the degree of hydration and roughness (this can be deduced from the shape of the depth profile in Fig. 8). The corresponding surface excess is 0.8 nmol cm−2. This unexpected result was confirmed by QCM experiments (see Fig. S47 and S48(a) in the ESI†). Note that in the QCM experiments a different (hydrogenous) SDS sample was used indicating that the phenomenon is not confined to the deuterated sample. This does not rule out contamination effects, which are well known with SDS,61 but in general the alcohol residues typically resulting from SDS hydrolysis would be solubilised at higher concentrations – leading for example to adsorption maxima close to cmc.62 It is worth recalling here that both h-SDS and d-SDS were deliberately used as received without further purification, with a view to mimicking a detergency scenario as closely as possible, so the presence of some dodecanol is expected. Greater adsorption is seen with higher concentration, above the cmc. Interestingly the adsorption increases despite the fact that both solution concentrations are above the cmc. This is potentially explained in one of two ways. Firstly that there is a preferential partitioning of dodecanol into the self-assembly structures at the negatively charged surface compared to micelles. Alternatively, that there is also a sodium concentration effect involved since the sodium ion concentration in the 20 cmc solution is 130 mM, which could then relate to screening arguments. There are in fact several observations of evidence for adsorption to like charged surfaces, for example through more negative zeta potentials. Arguments have included hydrogen bonding, and surface heterogeneity63–65 though such mechanisms appear unlikely here. The adsorbed amounts are at least comparable to an hydrophobically adsorbed layer as in Fig. 7. Given the thickness of the layer, that the surface is hydrophilic, and that polar groups should point towards the liquid phase this implies that a bilayer-like structure may form despite the headgroup repulsion to the surface charge.56 Wang et al.66 have previously observed adsorption of bis(2-ethylhexyl) sulfosuccinate (AOT – same headgroup) to a negatively charged surface in the presence of calcium ions, but not in sodium. They ascribed this to a cation bridging mechanism. In a follow-up paper,67 they studied the effect of cesium, discovering that it also allows the adsorption of an interdigitated bilayer of AOT on a negatively charged surface. They argued that the charge density of the two monovalent cations played a role in this case and was responsible for the observed behaviour. However AOT has a very different hydrocarbon structure, with a greater inverse curvature, which is more resistant to lamellar self-assembly. It may be that rather than a specific bridging it is possible to achieve an “overscreening” behaviour driven by hydrophobic association where a condensed sodium layer forms between the surface and adsorbed SDS to compensate for the charge penalty. Such an association would be assisted by the sodium concentrations used here – it has recently been shown with SANS that for anionic surfactants with the same headgroup, the self-assembly curvature changes markedly in this concentration region,68 indicating greater sodium binding, increased repulsion screening and a lower curvature assembly structure. Moreover, molecular dynamics simulations showed how a layer of sodium ions forms on a damaged hair surface, allowing the successive adsorption of polymer regions with net negative charge69 (although their model system was different from the one used in this work, as it included –OH moieties). On a gold surface image charges may also assist this type of structure.
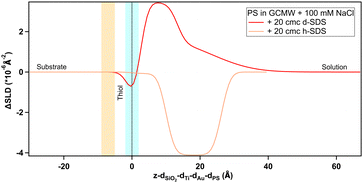
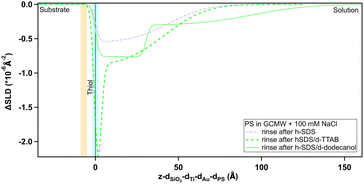
To shed further light on the mechanism behind the observed adsorption to the sulphonate surface (PS), a follow-up experiment was planned and performed on Platypus. The experimental sequence aimed to discover whether adsorption would occur from a predominantly hydrogenous SDS solution to which a neutral (dodecanol) or oppositely charged species (tetradecyltrimethylammonium bromide) was added. In both cases the additive was deuterated to reveal the nature of the adsorbing species. Results are shown in Fig. 9, 10 and in Table 3.
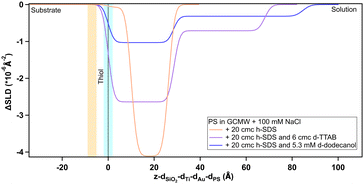 | ||
| Fig. 10 Depth profile, after subtraction of the substrate profile, of adsorbed species on PS as indicated on the graph. The blue panel, centred at the dotted line at x = 0, and the yellow panel on its left indicate, respectively, the PS/adsorbed layer and Au/PS interfaces with their associated roughness. The profile in the case of 20 cmc h-SDS is the same curve of Fig. 9. | ||
| Thickness (Å) | SLD (×10−6 Å−2) | |
|---|---|---|
| d-SDS | 2.0 (0.2) | 0.8 (0.4) |
| 11.3 (0.6) | 7.99 (0.04) | |
| 10 (1) | 6.2 | |
| h-SDS | 10.1 (0.4) | 4.3 (0.2) |
| 16.2 (0.4) | 0.29 (0.03) | |
| h-SDS/d-TTAB | 28.6 (0.4) | 1.86 (0.02) |
| 39.5 (0.9) | 3.79 (0.03) | |
| h-SDS/d-dodecanol | 28.4 (0.9) | 3.47 (0.03) |
| 56 (2) | 4.18 (0.02) | |
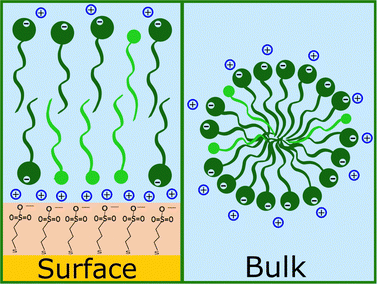
Firstly, the anomalous adsorption was confirmed for both the deuterated and the hydrogenous SDS. In the latter case a negative change in the SLD is observed reflecting the low SLD of h-SDS, and is thus entirely consistent with the deuterated data in Fig. 8. Specifically, as Table 3 shows, in the adsorbed d-SDS layer the portion closer to the surface (first row of the fitted parameters) is indicative of low-density sulphate groups and sodium ions, or of alcohol moieties (see ESI† – Fig. S29 and corresponding section – for more details on the fitting). Regarding h-SDS the fitted SLD values suggest mixing of d- and h-SDS closer to the surface (the apparent shift of the profile to the right can be due to H/D contrast-matching in the adsorbed species) and an almost complete substitution of deuterated molecules by hydrogenous ones (SLD of pure h-SDS = 0.28 × 10⁻⁶ Å−2) in the layer facing the bulk solution. On addition of d-TTAB (at a concentration corresponding to 6 cmc in the 20 cmc h-SDS solution) the layer remained, but its SLD value was less negative, and the peak was shifted closer to the surface. This suggests that TTA+ ions partially replace, or adsorb in addition to, the hydrogenous adsorbate. (Strictly this could also be due to less adsorption, but this appears unlikely given that the SDS concentration is the same. The poorer contrast between the layers, and its effect on parameters is discussed in Section S2.4 in the ESI.†) Note that the rinsing step (Fig. S18 in the ESI†) indicates a clean surface before the introduction of the h-SDS/d-TTAB mixture, which then leads to a structure with two well defined layers (see Table 3). The complex at the given h-SDS/d-TTAB ratio (20 cmc/6 cmc, i.e., 30 mM/5.3 mM) has a nominal SLD of ≈1 × 10⁻⁶ Å−2. Fitted SLDs for the adsorbed layers are bigger than the theoretical value for the mixture indicating a higher concentration of d-TTAB than in the mixture in solution, and/or the presence of solvent in the layer. The second layer is of very low SLD difference, and is likely due to a small amount of secondary adsorption or coacervate adsorption. (This would require several different contrasts to ascertain, which is not the focus of this work.) On rinsing it is not possible to completely remove the layers, which is probably explained by the documented synergistic adsorption of fatty alcohols with cationic surfactants70–72 but the composition clearly changes as indicated by the rise towards the SLD baseline (see Fig. S19 in the ESI†). When the d-dodecanol containing SDS solution (5.3 mM d-dodecanol in 20 cmc h-SDS, i.e., ≈15 mol%) is introduced, the primary adsorbate layer attains a much higher SLD (or smaller SLD difference) compared to either the pure h-SDS adsorbate or that of the TTAB/SDS mixture. Once again the trivial explanation of less adsorption is discounted and the explanation is thus that the adsorbed layer is a mixture of d-dodecanol and h-SDS, or h-dodecanol resulting from its hydrolysis. As above, defining the relative amount of each component would require repeating the experiment with multiple scattering contrasts, so one can here only qualitatively deduce that the higher SLD is due to an increase in deuterated species in the layer. (Note that the secondary layer associated with the TTA is still present indicating remaining traces.) Together, these results explain some of the earlier, anomalous observations of apparent SDS adsorption. Neutral, surface active material incorporated into micelles in the SDS solutions is clearly capable of adsorption to hydrophilic and charged surfaces. When the surface charge has the same sign as the main surfactant component, the neutral species is concentrated in the surface layer with possibly some charged surfactant through self-assembly arguments. If the surface were to be hydrophobic, then there would be no reason for concentration at the surface – the partitioning of the neutral species would be approximately the same since adsorption to a hydrophobic, neutral surface would be energetically almost indistinguishable from micelle formation. During adsorption to a negative surface however the neutral species partition preferentially due to the coulombic penalty for the charged surfactants, leading to a higher proportion of neutral species on the surface than in the micelles, as illustrated in Fig. 11. This means that in a shampoo formulation context, the neutral species are selectively delivered to the damaged regions of the hair, and left behind as a protective film upon rinsing.
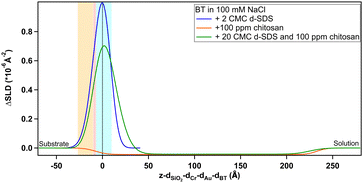
The two hydrophobic surfaces show quite a similar behaviour. The blue lines indicating the d-SDS profile have a similar shape, and the surface excess of d-SDS on BT is, similarly to MBT, 0.5 nmol cm−2. As in both cases the profile is nonzero at negative x-values, as explained in Section 3.2.1, it may be that adsorbed molecules can intercalate into both thiol layers (since MBT and BT have rather short hydrocarbon chains, their SAMs are not as closely packed structures as those that would form from long chain thiols39 – but smoother Au surfaces would be needed to prove this). In both cases the adsorption of undeuterated chitosan led to a negative ΔSLD change and a much thicker layer was observed commensurate with the larger molecular size. Based on the value of the SLD for this layer, it is assumed to consist of chitosan and predominantly solvent. It would appear that chitosan forms a thicker and more hydrated layer (97% solvent instead of 92%) on the straight-chain compared to the methyl branched thiol, but the errors on those parameters (especially thickness of chitosan on BT, due to the poor contrast to the bulk) are high enough to assume that the adsorbed layer has similar characteristics. Such high hydration percentages and thickness are in agreement with literature findings for the adsorption of polysaccharides,24,25,27,73 which have quite rigid chains.35 They have also been reported to adsorb as separate aggregates spread on the surface instead of forming a homogeneous layer27 (strictly patches of less hydrated chitosan are not distinguishable from a homogeneous film of the same thickness with much higher hydration with specular NR).
Interestingly, for both hydrophobic surfaces, the SLD profiles for the d-SDS/chitosan mixture appear to approximate a sum of the two single component profiles. A two layer model was necessary to fit the data. The polyelectrolyte–surfactant complexes in the solution thus adsorb and rearrange in such a way as to maintain the d-SDS rich layer close to the thiol, but the incorporated chitosan reaches a similar distance into solution, where it has very little SDS associated with it beyond the near surface self-assembly layer. The formation of two layers with different characteristics, for adsorption from a surfactant/polyelectrolyte mixture, has already some examples in the literature.20,69,74 It depends on a number of conditions, the main one being polyelectrolyte structure, which determines the structure of bulk aggregates and consequently of the adsorbed layers.75
In the case of the negatively charged PS, data was not sensitive to the presence of chitosan even at low Q, and the numeric solution was unstable (see Section S2.2 in the ESI† for a detailed description). Given that a d-SDS residue apparently stayed on the surface, the ΔSLD value in Fig. 14 is positive also in the case of pure chitosan. However, by comparison of the fitted SLD value for chitosan with the previous value of the rinsing step, a surface excess of ≈6% can be derived, which is in line with chitosan percentages calculated for the hydrophobic surfaces.
It is interesting to note how differently d-SDS behaves on PS compared to the hydrophobic surfaces. On MBT, there is an increase in the amount of adsorbed d-SDS with increasing bulk concentrations, but the profile keeps the same shape (Fig. 7). Also, the peak does not increase further on either MBT or BT when d-SDS concentration is ten times larger (in the d-SDS/chitosan mixture, Fig. 12 and 13). In contrast, on PS, the 20 cmc profile is completely different from the 2 cmc one (Fig. 8), suggesting a rearrangement of the layer structure with increasing surfactant concentrations. When in mixture with chitosan, the near-surface adsorbed layer resembles the layer in pure 20 cmc d-SDS. The higher concentration of d-SDS in the second adsorbed layer and its thickness, finally, suggest that electrostatic interactions play a more important role here compared to the two hydrophobic surfaces. It has been suggested, in fact, that polysaccharide adsorption on uncharged surfaces is entropy-driven, while it is enthalpy-driven when considering a charged surface.24
Quantitative information on layer thickness can be found in Table 4. Defining a hydration percentage in the case of the layers adsorbed from the d-SDS/chitosan mixture, is not straightforward, as these measurements alone do not allow ruling out the presence of one or the other molecule in any layer. What can be seen in the depth profiles, and deduced from the fitted SLD values for the two layers, is that: (1) on any thiol, the first layer closer to surface is enriched in surfactant, due to the largely positive ΔSLD, (2) similarly, on MBT and BT the second layer is enriched in chitosan as the profile goes to negative ΔSLD, and (3) on PS there is a significant fraction of d-SDS even in the second layer.
| Adsorbed species | MBT | Thickness (Å) on: BT | PS |
|---|---|---|---|
| d-SDS | 13.8 (0.3) | 14.8 (0.9) | 28 (10) |
| Chitosan | 76 (17) | 240 (12) | ND |
| Mixture | 13.3 (0.7) | 14 (10) | 30 (2) |
| 36 (6) | 218 (22) | 65 (10) |
| Thiol | Thickness (Å) | SLD (×10−6 Å−2) |
|---|---|---|
| BT (after d-SDS/chitosan) | 14 (3) | 5.6 (0.2) |
| PS (after d-SDS/chitosan) | 99 (10) | 4.9 (0.1) |
| PS (after h-SDS/d-dodecanol) | 30 (1) | 3.74 (0.02) |
| 64 (5) | 4.20 (0.03) |
4 Conclusions
Adsorption of simplified shampoo-like formulations on three model hair-mimetic surfaces was studied by neutron reflectometry. The method was chosen due to its ability to describe hierarchical adsorption from mixtures, and adapted to characterize the specific system under study. The results can be summarised in four points:(1) Effect of surfactant concentration: on a hydrophobic surface, SDS adsorbs already at very low concentrations and forms a compact monolayer at a concentration of 2 cmc. Surprisingly, there is also adsorption from the SDS solution on the negatively charged PS surface. In this case it forms an inhomogeneous layer at a concentration of 2 cmc, and evolves to a bilayer when the concentration is increased ten times. This adsorption is likely linked to the presence of dodecanol in solution, since the SDS samples are used “as is” to mimic an industrial context. We also used a deuterated cationic surfactant to study this anomalous coadsorption, and observed that there was cooperative adsorption between the cationic surfactant and the neutral fatty alcohol species. The observation of selective neutral species adsorption to the negative surface is robust and proven using different deuteration contrasts and techniques. It reveals a facile means of selectively depositing a protective neutral species on the damaged hair regions.
(2) Effect of the 18-MEA-like methyl branch: while there are some slight differences in the values obtained for BT and MBT surfaces (see Table 4), the main features of the adsorbed layers are comparable on the two surfaces suggesting that, despite it is known that the branch affects the tribological frictional properties of hair, at least for these small thiols the branch has little effect on adsorption.
(3) Effect of the surface charge/hydrophobicity: there are major differences in the adsorption of both SDS and SDS/chitosan mixture when comparing the structures formed on the hydrophilic, negatively charged surface and on the hydrophobic ones. In addition to the anomalous surfactant adsorption to the negative surfaces, it is found that in the presence of SDS/chitosan mixtures, two adsorbed layers can be identified on all three surfaces. On the hydrophobic surfaces, the near surface layer resembles a SDS monolayer, while extended chitosan molecules comprise a second layer, nearest the bulk solution. On the damaged hair model surface, instead, the first layer resembles a SDS bilayer, but the SLD values of both layers suggest that the surfactant/polyelectrolyte association is maintained to a greater extent upon adsorption.
(4) Final rinsing step: in all the cases, the adsorbed layers are not fully removed by the rinsing process. It is interesting to note that, even though the exact composition of the residual layer cannot be defined, the SLD values suggest that mostly SDS is left on the hydrophobic surfaces, whereas a larger amount of chitosan remains on the damaged surface model, which is of course exactly the desired result of a targeted delivery.
The data thus reveal the differences in interaction properties of “healthy” and “damaged” hair model surfaces, adding new details to the previous knowledge in the field. Moreover, the deposition of the natural polymer chitosan was studied, which may help the transition to sustainable hair care formulations.
The hair mimetics used here, are nonetheless rather primitive, that do not consider variables such as packing of longer hydrocarbon chains, or the intermediate hydrophobicity/lower surface charge of a mixed, “partially damaged hair”, system. This would be an interesting condition to study, and particularly relevant for the cosmetic industry. Given the success of the NR method to reveal differences in the adsorption hierarchy, further studies will be pursued along these lines.
Data availability
Data for this article are available at the following repositories: Data collected at ILL on the instrument Super-ADAM: BT: https://doi.ill.fr/10.5291/ILL-DATA.9-13-1006. MBT: https://doi.ill.fr/10.5291/ILL-DATA.9-13-1006; https://doi.ill.fr/10.5291/ILL-DATA.CRG-2741. PS: https://doi.ill.fr/10.5291/ILL-DATA.CRG-2962. Data collected at ANSTO on the instrument Platypus are available at Zenodo at https://doi.org/10.5281/zenodo.11284059.Conflicts of interest
The authors declare the following competing financial interest: G. S. L. and A. G. are full employees of L’Oréal involved in research activities.Acknowledgements
This project has received funding from the European Unions Horizon 2020 research and innovation programme under the Marie Skłodowska-Curie grant agreement no. 847439. We acknowledge the support of the Australian Centre for Neutron Scattering, ANSTO and the Australian Government through the National Collaborative Research Infrastructure Strategy (NCRIS), in supporting the neutron research and deuteration infrastructure used in this work via ACNS and NDF proposal 16984. We also acknowledge the Partnership for Soft Condensed Matter (PSCM) at ILL for providing access to the QCM-D instrumentation. M. R. and S. C. thank the Swedish Research Council (VR) for support via grant 2022-04614. We thank L’Oréal, and in particular Anne-Claude Dublanchet, for their support to the project.References
- K. E. Wilk, V. J. James and Y. Amemiya, Biochim. Biophys. Acta, Gen. Subj., 1995, 1245, 392–396 CrossRef PubMed.
- L. Kreplak, C. Mérigoux, F. Briki, D. Flot and J. Doucet, Biochim. Biophys. Acta, Protein Struct. Mol. Enzymol., 2001, 1547, 268–274 CrossRef CAS PubMed.
- V. Stanić, J. Bettini, F. E. Montoro, A. Stein and K. Evans-Lutterodt, Sci. Rep., 2015, 5, 1–8 Search PubMed.
- L. Bertrand, J. Doucet, A. Simionovici, G. Tsoucaris and P. Walter, Biochim. Biophys. Acta, Gen. Subj., 2003, 1620, 218–224 CrossRef CAS.
- H. Tanamachi, S. Tokunaga, N. Tanji, M. Oguri and S. Inoue, J. Cosmet. Sci., 2010, 61, 147–160 CAS.
- S. Tokunaga, H. Tanamachi and K. Ishikawa, Cosmetics, 2019, 6, 31 CrossRef CAS.
- G. S. Luengo, A.-L. Fameau, F. Léonforte and A. J. Greaves, Adv. Colloid Interface Sci., 2021, 290, 102383 CrossRef CAS.
- S. Breakspear, J. R. Smith and G. Luengo, J. Struct. Biol., 2005, 149, 235–242 CrossRef CAS.
- D. J. Peet, R. E. Wettenhall, D. E. Rivett and A. K. Allen, Comp. Biochem. Physiol., Part B: Biochem. Mol. Biol., 1992, 102, 363–366 CrossRef CAS.
- P. W. Wertz and D. T. Downing, Lipids, 1988, 23, 878–881 CrossRef CAS.
- M. Korte, S. Akari, H. Kühn, N. Baghdadli, H. Möhwald and G. S. Luengo, Langmuir, 2014, 30, 12124–12129 CrossRef CAS PubMed.
- N. Baghdadli, G. S. Luengo and L. Recherche, J. Phys.: Conf. Ser., 2008, 100, 052034 CrossRef.
- L. N. Jones and D. E. Rivett, Micron, 1997, 28, 469–485 CrossRef CAS PubMed.
- H. Mizuno, G. S. Luengo and M. W. Rutland, Langmuir, 2010, 26, 18909–18915 CrossRef CAS PubMed.
- E. Bergendal, PhD thesis, KTH Royal Institute of Technology, 2020.
- J. F. D. Liljeblad, E. Tyrode, E. Thormann, A.-C. Dublanchet, G. Luengo, C. Magnus Johnson and M. W. Rutland, Phys. Chem. Chem. Phys., 2014, 16, 17869–17882 RSC.
- P. A. Cornwell, Int. J. Cosmet. Sci., 2018, 40, 16–30 CrossRef CAS PubMed.
- G. Luengo, F. Léonforte, A. Greaves, R. Rubio and E. Guzmán, Green Chem., 2023, 25, 7863–7882 RSC.
- M. Philippe, B. Didillon and L. Gilbert, Green Chem., 2012, 14, 952–956 RSC.
- S. Banerjee, C. Cazeneuve, N. Baghdadli, S. Ringeissen, F. Léonforte, F. A. Leermakers and G. S. Luengo, J. Phys. Chem. B, 2017, 121, 8638–8651 CrossRef CAS.
- T. I. Morozova, N. A. García, J.-L. Barrat, G. S. Luengo and F. Léonforte, ACS Appl. Mater. Interfaces, 2021, 13, 30086–30097 CrossRef CAS PubMed.
- H. Mizuno, G. S. Luengo and M. W. Rutland, Langmuir, 2013, 29, 5857–5862 CrossRef CAS PubMed.
- Z. Besharat, D. Wakeham, C. M. Johnson, G. S. Luengo, A. Greaves, I. Odnevall Wallinder, M. Göthelid and M. W. Rutland, J. Colloid Interface Sci., 2016, 484, 279–290 CrossRef CAS.
- E. Guzmán, F. Ortega, N. Baghdadli, C. Cazeneuve, G. S. Luengo and R. G. Rubio, ACS Appl. Mater. Interfaces, 2011, 3, 3181–3188 CrossRef.
- E. Guzmán, F. Ortega, N. Baghdadli, G. S. Luengo and R. G. Rubio, Colloids Surf., A, 2011, 375, 209–218 CrossRef.
- E. Guzmán, S. Llamas, L. Fernández-Peña, F. Léonforte, N. Baghdadli, C. Cazeneuve, F. Ortega, R. G. Rubio and G. S. Luengo, Colloids Surf., A, 2020, 585, 124178 CrossRef.
- M. Hernández-Rivas, E. Guzmán, L. Fernández-Peña, A. Akanno, A. Greaves, F. Léonforte, F. Ortega, R. G. Rubio and G. S. Luengo, Colloids Interfaces, 2020, 4, 33 CrossRef.
- L. Fernández-Peña, E. Guzmán, F. Leonforte, A. Serrano-Pueyo, K. Regulski, L. Tournier-Couturier, F. Ortega, R. G. Rubio and G. S. Luengo, Colloids Surf., B, 2020, 185, 110578 CrossRef.
- A. Del Giudice, M. Gubitosi, A. Sthoer, S. Köhler, S. Ayscough, M. W. Skoda, T. Nylander and T. Halthur, Colloids Surf., A, 2024, 134365 CrossRef CAS.
- L. Braun, M. Uhlig, R. von Klitzing and R. A. Campbell, Adv. Colloid Interface Sci., 2017, 247, 130–148 CrossRef CAS PubMed.
- E. Guzmán, F. Ortega and R. G. Rubio, Cosmetics, 2022, 9, 99 CrossRef.
- J. Penfold, Curr. Opin. Colloid Interface Sci., 2002, 7, 139–147 CrossRef CAS.
- P. Mukerjee, Critical micelle concentrations of aqueous surfactant systems, NBS Publications, 1971 Search PubMed.
- I. Aranaz, A. R. Alcántara, M. C. Civera, C. Arias, B. Elorza, A. Heras Caballero and N. Acosta, Polymers, 2021, 13, 3256 CrossRef CAS.
- L. Chiappisi and M. Gradzielski, Adv. Colloid Interface Sci., 2015, 220, 92–107 CrossRef CAS PubMed.
- K. Beyer, D. Leine and A. Blume, Colloids Surf., B, 2006, 49, 31–39 CrossRef CAS PubMed.
- C. D. Bain, E. B. Troughton, Y. T. Tao, J. Evall, G. M. Whitesides and R. G. Nuzzo, J. Am. Chem. Soc., 1989, 111, 321–335 CrossRef CAS.
- J. J. Gooding, F. Mearns, W. Yang and J. Liu, Electroanalysis, 2003, 15, 81–96 CrossRef CAS.
- J. C. Love, L. A. Estroff, J. K. Kriebel, R. G. Nuzzo and G. M. Whitesides, Chem. Rev., 2005, 105, 1103–1170 CrossRef CAS.
- C. Vericat, M. E. Vela, G. A. Benitez, J. A. M. Gago, X. Torrelles and R. C. Salvarezza, J. Phys.: Condens. Matter, 2006, 18, R867 CrossRef CAS.
- F. Schreiber, Prog. Surf. Sci., 2000, 65, 151–257 CrossRef CAS.
- C. Mokrani, J. Fatisson, L. Guérente and P. Labbé, Langmuir, 2005, 21, 4400–4409 CrossRef CAS PubMed.
- M. Wolff, H. Frielinghaus, M. Cárdenas, J. F. Gonzalez, K. Theis-Bröhl, O. Softwedel, R. von Klitzing, G. A. Pilkington, M. W. Rutland, R. Dahint and P. Gutfreund, Encyclopedia of Solid-Liquid Interfaces, Elsevier, Oxford, 1st edn, 2024, pp. 305–323 Search PubMed.
- G. Fragneto-Cusani, J. Phys.: Condens. Matter, 2001, 13, 4973 CrossRef CAS.
- Neutron data booklet, ed. A. J. Dianoux and I. Laue-Langevin, Old City, Philadelphia, PA, 2nd edn, 2003 Search PubMed.
- M. Wolff and P. Gutfreund, Handbook of Modern Coating Technologies, Elsevier, Amsterdam, 2021, pp. 143–175 Search PubMed.
- A. Devishvili, K. Zhernenkov, A. J. C. Dennison, B. P. Toperverg, M. Wolff, B. Hjörvarsson and H. Zabel, Rev. Sci. Instrum., 2013, 84, 025112 CrossRef CAS.
- M. James, A. Nelson, A. Brule and J. Schulz, J. Neutron Res., 2006, 14, 91–108 CrossRef.
- G. A. Pilkington, K. Harris, E. Bergendal, A. B. Reddy, G. K. Palsson, A. Vorobiev, O. N. Antzutkin, S. Glavatskih and M. W. Rutland, J. Chem. Phys., 2018, 148, 193806 CrossRef PubMed.
- https://github.com/Alexey-Klechikov/pySAred .
- A. R. J. Nelson and S. W. Prescott, J. Appl. Crystallogr., 2019, 52, 193–200 CrossRef CAS PubMed.
- A. R. McCluskey, ArXiv, 2020, DOI:10.48550/arXiv.2003.08270.
- G. Gunnarsson, B. Joensson and H. Wennerstroem, J. Phys. Chem., 1980, 84, 3114–3121 CrossRef CAS.
- H. Evans, J. Colloid Sci., 1958, 13, 537–552 CrossRef CAS.
- A. L. Meader Jr and B. A. Fries, Ind. Eng. Chem., 1952, 44, 1636–1648 CrossRef.
- N. Li, R. K. Thomas and A. R. Rennie, J. Colloid Interface Sci., 2012, 378, 152–158 CrossRef CAS PubMed.
- R. A. Campbell, Curr. Opin. Colloid Interface Sci., 2018, 37, 49–60 CrossRef CAS.
- A. R. Mazzer, L. A. Clifton, T. Perevozchikova, P. D. Butler, C. J. Roberts and D. G. Bracewell, J. Chromatogr. A, 2017, 1499, 118–131 CrossRef CAS PubMed.
- A. M. Poskanzer and F. Goodrich, J. Phys. Chem., 1975, 79, 2122–2126 CrossRef CAS.
- I. Umlong and K. Ismail, Colloids Surf., A, 2007, 299, 8–14 CrossRef CAS.
- E. L. Correia, N. Brown, A. Ervin, D. V. Papavassiliou and S. Razavi, Langmuir, 2022, 38, 7179–7189 CrossRef CAS PubMed.
- R. D. Vold and N. H. Sivaramakrishnan, J. Phys. Chem., 1958, 62, 984–989 CrossRef CAS.
- J. Hedberg, M. Lundin, T. Lowe, E. Blomberg, S. Wold and I. O. Wallinder, J. Colloid Interface Sci., 2012, 369, 193–201 CrossRef CAS PubMed.
- E. L. Correia, S. Thakur, A. Ervin, E. Shields and S. Razavi, Colloids Surf., A, 2023, 676, 132142 CrossRef CAS.
- L. L. Schramm, E. N. Stasiuk and D. G. Marangoni, Annu. Rep. Prog. Chem., Sect. C: Phys. Chem., 2003, 99, 3–48 RSC.
- X. Wang, S. Y. Lee, K. Miller, R. Welbourn, I. Stocker, S. Clarke, M. Casford, P. Gutfreund and M. W. A. Skoda, Langmuir, 2013, 29, 5520–5527 CrossRef CAS PubMed.
- F. J. Allen, L. R. Griffin, R. M. Alloway, P. Gutfreund, S. Y. Lee, C. L. Truscott, R. J. Welbourn, M. H. Wood and S. M. Clarke, Langmuir, 2017, 33, 7881–7888 CrossRef CAS PubMed.
- A. S. Rafique, S. Khodaparast, A. S. Poulos, W. N. Sharratt, E. S. J. Robles and J. T. Cabral, Soft Matter, 2020, 16, 7835–7844 RSC.
- B. J. Coscia, J. C. Shelley, A. R. Browning, J. M. Sanders, R. Chaudret, R. Rozot, F. Léonforte, M. D. Halls and G. S. Luengo, Phys. Chem. Chem. Phys., 2023, 25, 1768–1780 RSC.
- K. Wunsch, P. Relkin, G. Cuvelier, F. Clement, L. Nicolas-Morgantini, H. Benkhelifa and D. Flick, J. Therm. Anal. Calorim., 2016, 123, 1411–1417 CrossRef.
- K. Sakamoto, R. Y. Lochhead, H. I. Maibach and Y. Yamashita, Cosmetic science and technology: theoretical principles and applications, Elsevier, 2017 Search PubMed.
- K. Šindelka, A. Kowalski, M. Cooke, C. Mendoza and M. Lsal, J. Mol. Liq., 2023, 375, 121385 CrossRef.
- A. Tiraferri, P. Maroni, D. Caro Rodríguez and M. Borkovec, Langmuir, 2014, 30, 4980–4988 CrossRef CAS PubMed.
- N. Dhopatkar, J. H. Park, K. Chari and A. Dhinojwala, Langmuir, 2015, 31, 1026–1037 CrossRef CAS PubMed.
- S. Banerjee, C. Cazeneuve, N. Baghdadli, S. Ringeissen, F. A. M. Leermakers and G. S. Luengo, Soft Matter, 2015, 11, 2504–2511 RSC.
- A. Dėdinaitė and M. Ernstsson, J. Phys. Chem. B, 2003, 107, 8181–8188 CrossRef.
Footnote |
| † Electronic supplementary information (ESI) available: Production of d-dodecanol, NR data fitting, quartz-crystal microbalance. See DOI: https://doi.org/10.1039/d4sm00784k |
| This journal is © The Royal Society of Chemistry 2024 |

