 Open Access Article
Creative Commons Attribution 3.0 Unported Licence
Segregative phase separation of strong polyelectrolyte complexes at high salt and high polymer concentrations†
Conner H.
Chee
,
Rotem
Benharush
,
Lexi R.
Knight
and
Jennifer E.
Laaser
 *
*
Department of Chemistry, University of Pittsburgh, 219 Parkman Ave, Pittsburgh, PA, USA. E-mail: j.laaser@pitt.edu
First published on 9th October 2024
Abstract
The phase behavior of polyelectrolyte complexes and coacervates (PECs) at low salt concentrations has been well characterized, but their behavior at concentrations well above the binodal is not well understood. Here, we investigate the phase behavior of stoichiometric poly(styrene sulfonate)/poly(diallyldimethylammonium) mixtures at high salt and high polymer concentrations. Samples were prepared by direct mixing of PSS/PDADMA PECs, water, and salt (KBr). Phase separation was observed at salt concentrations approximately 1 M above the binodal. Characterization by thermogravimetric analysis, FTIR, and NMR revealed that both phases contained significant amounts of polymer, and that the polymer-rich phase was enriched in PSS, while the polymer-poor phase was enriched in PDADMA. These results suggest that high salt concentrations drive salting out of the more hydrophobic polyelectrolyte (PSS), consistent with behavior observed in weak polyelectrolyte systems. Interestingly, at the highest salt and polymer concentrations studied, the polymer-rich phase contained both PSS and PDADMA, suggesting that high salt concentrations can drive salting out of partially-neutralized complexes as well. Characterization of the behavior of PECs in the high concentration limit appears to be a fruitful avenue for deepening fundamental understanding of the molecular-scale factors driving phase separation in these systems.
1. Introduction
Polyelectrolyte complexes (PECs) are a class of materials that form when oppositely charged polyelectrolytes are mixed in solution. Under the right solution conditions, such mixtures can undergo associative phase separation to form a polymer rich phase called a polyelectrolyte complex (if the polymer-rich phase is solid or gel-like) or coacervate (if the polymer-rich phase is liquid-like) below a polymer-poor supernatant.1 The polymer-rich polyelectrolyte complex and coacervate phases have a wide range of applications, including drug delivery,2–5 underwater adhesives,6–8 and salt-processable materials,9–11 to name only a few. These applications are enabled by the specific phase behavior and viscoelasticity of the polymer-rich phase. Thus, developing a comprehensive understanding of the phase behavior in these systems is critical to inform design of functional materials with well-controlled properties.Over the past few decades, a number of experimental and theoretical efforts have yielded a deep understanding of the phase behavior of PEC systems.1 Polyelectrolyte complex coacervation is typically observed at low salt and low polymer concentrations, where the initial complexation is driven by the entropic gains upon release of counterions from the polyelectrolyte chains and rearrangement of water molecules around the charged species.12–15 At high salt concentrations, this driving force is reduced, and there is a critical salt concentration above which no phase separation is observed. The phase boundary is typically described by a binodal curve, which separates the 2-phase region at low salt and low polymer fractions from the 1-phase region observed at higher salt concentrations. Binodal curves have been experimentally mapped out for many different polyelectrolyte systems,16–19 and the phase behavior of these systems is found to depend on both the chemical compositions of the polyelectrolytes17,18,20–22 and solution conditions such as pH,16,23 temperature,24,25 and the identity of the salt used to set the total ionic strength.26,27 A number of theoretical models have also been developed that successfully describe much of the experimentally-observed phase behavior of these systems. One of the earliest and most widely-used models is the Voorn–Overbeek model, which describes the free energy of mixing in terms of the charge interactions and entropies of different species.28 Development of both more sophisticated theoretical models and computer simulations that account for chain connectivity, charge sequence, and ion pairing, among other features, have since refined the field's understanding of the thermodynamics of the complexation process.1,15,29–38
While a small number of studies have investigated the phase behavior of polyelectrolyte complexes at high polymer concentrations,16,39,40 the vast majority of experimental and theoretical work to date has focused on the low salt and low polymer concentration limits. In practice, most applications of polyelectrolyte complexes and coacervates occur in this limit, and theoretical models have generally predicted that there should be no further phase separation above the binodal. Recently, however, experiments at high salt and high polymer concentrations challenged this assumption. Mixtures of poly(acrylic acid) (PAA) with PDADMA were found to exhibit “re-entrant” phase separation at salt concentrations well above the critical salt concentration,41,42 while mixtures of PAA with poly(allylamine hydrochloride) (PAH) exhibit a continuous two-phase region up to 6 M NaCl.16 The unexpected observation of phase separation at high salt and at high polymer concentrations suggests that the phase behavior of polyelectrolyte complexes in this regime is more complex than previously understood. Li et al. suggested that these observations could be explained for systems containing PAA by accounting for changes in the polymer–water interaction parameter when PAA is partially protonated below its pKa.42 Using a thermodynamic model that included a Flory–Huggins interaction parameter describing the non-electrostatic interactions between the polyelectrolytes and solvent, they showed that a second phase separated regime emerged at high salt and high polymer concentrations when the polymer–water interaction parameter was above approximately 0.5. Interestingly, the phase separation at high salt concentrations was predicted to be segregative, with the polyanion and polycation partitioning into different phases, in contrast to the associative phase separation observed at low salt concentrations. While experimental characterization of the separated phases produced at high salt concentrations was limited, the prediction of segregative phase separation was consistent with 13C NMR measurements on a PAA/PDADMA sample prepared at high salt concentration,42 and with both molecular dynamics simulations43 and the enrichment of PAA in the polymer-rich phase of PAA/PAH and PAA/PDADMA complexes observed in other work.40,41
Across this work, segregative phase separation at high salt concentrations was predicted to depend strongly on the protonation state of the poly(acrylic acid), with phase separation emerging only once the PAA was partially neutralized and hydrophobic effects began to dominate.42 Some experiments suggest, however, that a second two-phase window may also emerge at high salt concentrations in complexes of strong polyelectrolytes. In 2020, Morin et al. prepared samples of poly(styrene sulfonate) (PSS) and poly(diallyldimethylammonium) (PDADMA) at salt and polymer concentrations well above the binodal curve, in an effort to decouple salt and polymer-dependent contributions to the materials' dynamics. While all of the samples were expected to be homogeneous, signs of phase separation were observed at salt concentrations above approximately 2 M.44 This result suggests that the occurrence of a second critical salt concentration above the standard binodal may be a more universal feature of polyelectrolyte complex materials.
Here, we test this hypothesis by preparing stoichiometrically-balanced mixtures of PSS and PDADMA (both strong polyelectrolytes) whose polymer and salt concentrations lie well above the binodal. We find that at salt concentrations up to approximately 1 M above the binodal, the mixtures form a single-phase solution. At higher salt concentrations, however, phase separation is observed. TGA, FTIR, and NMR reveal that the PDADMA and PSS indeed partition to separate phases, although the extent of the PSS/PDADMA partitioning decreases with further increases in the polymer and salt concentrations. These results suggest that segregative phase separation occurs at high salt concentrations even in strong polyelectrolyte systems, and provide evidence for a continuous transition to a third phase-separated regime in which both polyelectrolytes salt out. This work highlights the need to account for non-ionic interactions to fully understand the phase behavior of polyelectrolyte complexes and coacervates, and suggests that further exploration of the high salt regime offers new opportunities to understand the fundamental interactions that drive phase separation in these materials.
2. Experimental methods
2.1. Materials
Poly(sodium 4-styrene sulfonate) (PSSNa, Mw = 200![[thin space (1/6-em)]](https://www.rsc.org/images/entities/char_2009.gif) 000 g mol−1, 20 wt%) solution and poly(diallyldimethylammonium chloride) (PDADMAC, Mw = 200
000 g mol−1, 20 wt%) solution and poly(diallyldimethylammonium chloride) (PDADMAC, Mw = 200![[thin space (1/6-em)]](https://www.rsc.org/images/entities/char_2009.gif) 000–350
000–350![[thin space (1/6-em)]](https://www.rsc.org/images/entities/char_2009.gif) 000 g mol−1, 23 wt%) solution were purchased from Sigma Aldrich. Potassium bromide (KBr) was purchased from Fisher Scientific. All samples were prepared using Milli-Q water obtained from a Synergy UV water purification system purchased from Millipore Sigma. All materials, except for PSSNa and PDADMAC, were used as received. PSSNa and PDADMAC were dialyzed before use using standard RC dialysis tubing with a molecular weight cutoff of 6–8 kg mol−1 (Spectra/Por, 08-670D).
000 g mol−1, 23 wt%) solution were purchased from Sigma Aldrich. Potassium bromide (KBr) was purchased from Fisher Scientific. All samples were prepared using Milli-Q water obtained from a Synergy UV water purification system purchased from Millipore Sigma. All materials, except for PSSNa and PDADMAC, were used as received. PSSNa and PDADMAC were dialyzed before use using standard RC dialysis tubing with a molecular weight cutoff of 6–8 kg mol−1 (Spectra/Por, 08-670D).
2.2. Sample preparation
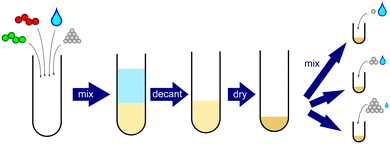
Samples were prepared by direct mixing of dried PEC, salt, and water, as shown in Fig. 1. Briefly, a bulk PEC was first prepared by dissolving stoichiometric amounts of PSSNa and PDADMAC in a 2.5 M KBr solution. Milli-Q water was then added slowly until the KBr concentration was below 0.1 M, resulting in precipitation of the PSS/PDADMA complex. The supernatant was decanted, replaced with milliQ water, and the PEC was allowed to sit for 24 hours to wash out excess salt. This process was repeated a total of three times. The bulk PEC was then dried using a lyophilizer and ground with a mortar and pestle, yielding a white powder. NMR revealed that this parent PEC was stoichiometrically balanced, containing 50.7% PSS and 49.3% PDADMA repeat units (see ESI†). Samples with targeted PEC and salt concentrations were then prepared by combining the requisite amounts of dry PEC, KBr, and water in an Eppendorf tube. To ensure complete mixing, the samples were vortexed for 1 minute at 2000 rpm after each addition. Samples were then centrifuged for 1 hour at 4000 rpm, left to equilibrate for 2 days, centrifuged again for 1 hour, and left to equilibrate for at least 1 week before characterization.2.3. Thermogravimetric analysis
Thermogravimetric analysis (TGA) measurements were carried out on a Q5000 IR Thermogravimetric Analyzer (TA Instruments) using a protocol adapted from Li et al.16 For each measurement, approximately 15 mg of sample was loaded onto a platinum pan. The sample was held at 25 °C for 5 minutes, and was then heated to 100 °C at 20 °C min−1 and held at this temperature for 1 hour to drive off water. The temperature was then ramped to 600 °C at a rate of 10 °C min−1 and the sample was held at 600 °C for an additional 1 hour to ensure complete removal of organic components of the sample. The temperature was then finally ramped to 680 °C at 10 °C min−1 to complete the measurement. All measurements were carried out under air to facilitate the complete removal of the organic components. Measurements on standard solutions with known compositions indicated that this protocol yielded compositions accurate to within 1 wt%.2.4. Infrared spectroscopy
Attenuated total reflection-Fourier transform infrared spectroscopy (ATR-FTIR) measurements were carried out on a spectrum two (PerkinElmer) instrument. Measurements were acquired at a resolution of 1 cm−1 with a sampling interval of 0.25 cm−1 and were averaged over 16 scans. For the polymer rich phases, the sample was compressed with the instrument's pressure gauge until the pressure read 100 Pa to ensure sufficient contact between the polymer sample and the ATR crystal.2.5. Nuclear magnetic resonance
1H-NMR (Avance 400 MHz, Bruker) spectra were used to determine the polymer stoichiometry in each sample. The polymer rich and polymer poor phases of the phase-separated samples were separated and dried with a lyophilizer. The dried samples, which consisted of polymer and salt, were ground with a mortar and pestle, and were then dissolved in a 2.5 M KBr solution in D2O, targeting a polymer concentration of 15 mg ml−1. NMR measurements were finally carried out using a relaxation delay (d1 time) of 10 seconds to ensure accurate integrations.3. Results
3.1. PEC sample preparation
Following the methods described in the previous section, a bulk polyelectrolyte complex composed of PSS and PDADMA with weight average molecular weights of 200 and 200–350 kg mol−1, respectively, was prepared. NMR measurements on the salt-free, dry PEC confirmed that the PEC was stoichiometric (see ESI†). Samples with salt and polymer concentrations well above the binodal were then prepared from this dried PEC, as illustrated in Fig. 2(a). The targeted sample compositions primarily had salt concentrations above 20 wt% and polymer concentrations above 16 wt% because this is the regime in which phase separation was previously suggested to occur.44 We note that these compositions are well above the normal binodal curve and, as such, should be in the single-phase regime. Photographs of representative samples obtained after equilibration are shown in Fig. 2(b). As seen in this figure, phase separation was indeed observed in this composition range, and generally became more pronounced with increasing salt or increasing polymer concentration. At the lowest salt concentrations studied, the samples were clear and homogeneous. As the salt concentration increased, the samples became cloudy and then separated into two distinct phases, with an opaque, gel-like lower phase and a liquid-like upper phase that became increasingly clear and transparent with increasing salt concentration. Similar trends were observed with increasing polymer concentration, with the volume of the gel-like lower phase increasing as the polymer concentration increased. At the highest salt and polymer concentrations studied, the gel-like and liquid-like phases did not separate cleanly into distinct lower and upper phases, but were instead somewhat intermixed, likely because the relaxation dynamics were too slow for the gel-like phase to flow to the bottom of the tube. No significant changes to the appearance of the samples were noted over more than four weeks at room temperature, or in selected samples heated to 60 °C for more than one week. Finally, we note that the appearance and qualitative properties of the phases in this upper phase window (UPW) were different from those of phase-separated samples prepared below the binodal. Below the binodal, the polymer-rich lower phase was a translucent, viscous liquid, while in the UPW, the lower phase was an opaque gel. Interestingly, however, the upper phase was a relatively transparent, low-viscosity liquid in both regimes.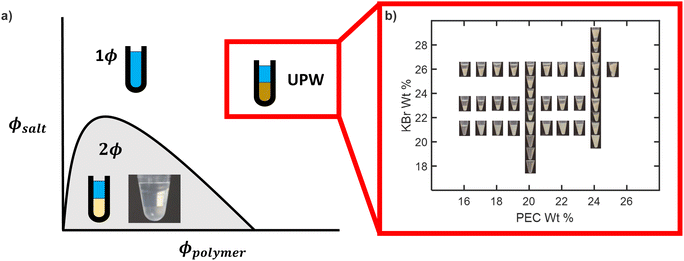 | ||
| Fig. 2 (a) Schematic of a polyelectrolyte complex coacervate phase diagram illustrating both the binodal (solid line) and the sample compositions targeted in this work, and (b) representative images of samples prepared in the upper phase window at high salt and high polymer concentrations. Larger copies of all images shown in panel (b) are provided in the ESI.† | ||
3.2. Phase behavior
The phase behavior of the samples prepared in the UPW was quantified via TGA. Representative TGA traces of the upper and lower phases of a sample prepared in the normal binodal regime are shown in Fig. 3(a), while TGA traces of the upper and lower phases of a sample prepared in the UPW are shown in Fig. 3(b). The TGA traces for all samples exhibit a sharp mass loss at 100 °C, which is attributed to the evaporation of water from the sample. Mass loss between 100 and 600 °C is attributed to decomposition of the organic components of the sample (PSS and PDADMA), while the remaining mass at temperatures above 600 °C comes from the salt and any other inorganic residue from decomposition of the polymer. As seen in Fig. 3(a), only the lower/denser phase of the sample prepared below the binodal shows an appreciable drop between 100 and 600 °C, indicating that this phase is polymer-rich while the upper phase/supernatant is polymer poor. The supernatant correspondingly has a higher mass loss attributed to water, while both phases have similar inorganic fractions. By contrast, as seen in Fig. 3(b), both the lower and upper phases of the sample prepared in the UPW show a significant mass loss in the 100–600 °C range, indicating that both phases have significant polymer content. The upper phase again has a higher water content, while the lower phase has a higher inorganic fraction. Interestingly, for samples prepared in the UPW, the mass loss corresponding to the polymer occurs at different temperatures in the upper and lower phases. The upper phase exhibits a sharp mass loss starting at about 350 °C, while the lower phase only begins losing mass around 500 °C. This is consistent with the possibility that the PSS and PDADMA, which have different combustion temperatures,45,46 partition into separate phases.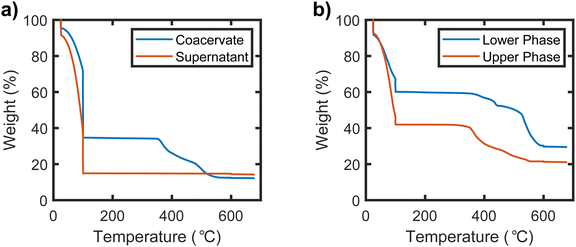 | ||
| Fig. 3 TGA traces for (a) the coacervate and supernatant phases of a PSS−PDADMA+ sample prepared below the binodal and (b) the dense and dilute phase of a sample prepared at a composition far above the binodal. The sample prepared under the binodal had a target composition of 3% PEC and 14% KBr by mass. The sample prepared in the upper phase window had a target composition of 20% PEC and 21% KBr by mass. TGA traces of all other samples prepared in both the UPW and the normal binodal regime exhibited similar trends (see ESI†). | ||
Full TGA traces for all samples are provided in the ESI,† and their mass losses in the temperature ranges corresponding to their organic and inorganic components are summarized in Fig. 4. We note that at first glance, this data suggests that the salt content of the phase-separated samples might be different in the UPW than in the normal binodal region. In particular, the amount of inorganic residue at high temperatures is higher in the polymer-rich lower phase of the UPW samples than in the polymer-poor upper phase, in stark contrast to the behavior observed for samples prepared under the binodal. However, in stoichiometrically-imbalanced samples the mass fraction of this residue does not necessarily reflect the true salt content of the material (see ESI†), and correcting for this imbalance requires knowledge of the actual PSS/PDADMA stoichiometry in each sample.
3.3. Polymer partitioning
To accurately determine the PSS/PDADMA ratios in each phase, we used the 1H-NMR analysis described by Shamoun et al.47 NMR spectra of the upper and lower phases of a representative sample are shown in Fig. 5. In this spectrum, the peaks between 5.5 and 9 ppm correspond to the 4 aromatic protons on PSS, while the peaks between 0 and 4.5 ppm correspond to the aliphatic protons on both PSS and PDADMA. For each phase, the fraction of all charged repeat units coming from PSS (xPSS) in that phase was determined from the integrals of these peaks using | (1) |
![[thin space (1/6-em)]](https://www.rsc.org/images/entities/char_2009.gif) :
:![[thin space (1/6-em)]](https://www.rsc.org/images/entities/char_2009.gif) 1 mixture of PSS and PDADMA to within 1%, indicating that it provides accurate quantitative information about the sample composition. NMR spectra of all analyzed samples and the standard sample are provided in the ESI.†
1 mixture of PSS and PDADMA to within 1%, indicating that it provides accurate quantitative information about the sample composition. NMR spectra of all analyzed samples and the standard sample are provided in the ESI.†
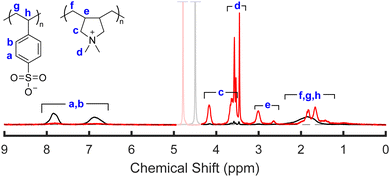 | ||
| Fig. 5 Representative 1H-NMR spectrum of the lower and upper phases of a sample prepared at high salt and high polymer concentrations (21% and 20% KBr and PEC, respectively). Samples were dried and dissolved in a 2.5 M solution of KBr in D2O prior to measurement. Spectra are normalized to the same number of charged repeat units, and the greyed-out peak indicates the D2O peak from the solvent. A detailed discussion of the NMR peak assignments is provided in the ESI.† | ||
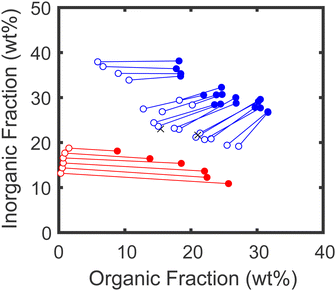
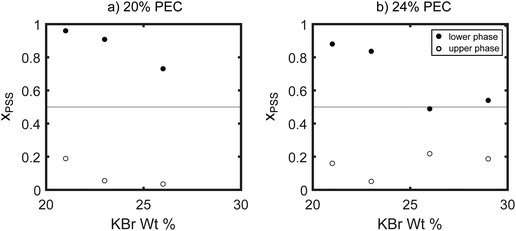
The compositions of the samples extracted using NMR are summarized in Fig. 6 and 7. As seen in these figures, at the lowest salt and polymer concentrations studied, the lower, denser phase contained almost exclusively PSS, while the PDADMA was primarily in the upper, less-dense phase. Increasing the PEC concentration while holding the KBr concentration constant (Fig. 6) and increasing the KBr concentration while holding the PEC concentration constant (Fig. 7) both brought the composition of the lower, denser phase back toward stoichiometric (xPSS = 0.5). The trends in the composition of the upper, less-dense phase were less consistent; however, the volume of this phase also decreased dramatically with increasing PEC and KBr concentration, and the vast majority of the polymer was thus in the lower, denser phase. ATR-FTIR measurements yielded similar qualitative trends in the polymer partitioning as observed by NMR (see ESI†).
3.4. Phase diagram of the UPW
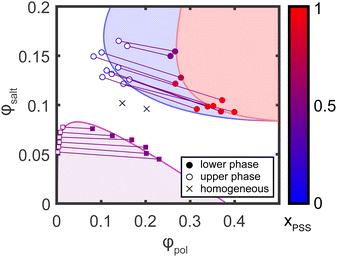
Using the stoichiometry data obtained from NMR, the TGA data was corrected to obtain the true organic and inorganic mass fractions of each sample, as described in the ESI.† The corrected mass fractions of polymer, salt, and water in each sample were then converted to volume fractions using the bulk densities of each component (1.00 g cm−3 for water, 1.27 g cm−3 for PSS/PDADMA ion paired polymers,48,49 and 2.75 g cm−3 for KBr; note that for the purposes of this analysis, the entire organic fraction of the sample was analyzed using the PSS/PDADMA density and the inorganic fraction was analyzed using the KBr density, even if the samples were not stoichiometric). The resulting phase diagram is shown in Fig. 8. For samples prepared at low salt and polymer concentrations, shown in red, the points form the characteristic concave down binodal curve typically observed for polyelectrolyte complexes. The tie lines connecting the compositions in this regime are relatively flat, with only a slight negative slope, consistent with prior measurements and the athermal mixing observed in the PSS/PDADMA/KBr system.49 For samples prepared at high salt and polymer concentrations, shown in blue, the points form a tilted, concave-up curve. In this regime, both phases contain a significant amount of polymer, in contrast to the phase behavior at lower salt concentrations. The tie lines connecting the dense and dilute phases also have a pronounced negative slope, indicating that the salt has a much stronger tendency to partition to the polymer poor phase than it does at lower salt concentrations.3.5. Salting out of component polymers
As noted in the introduction, segregative phase separation at high salt concentrations in systems containing poly(acrylic acid) is thought to be driven by PAA's unfavorable polymer–water interactions when protonated, which can drive salting out of PAA alone at high salt concentrations.42 To determine whether similar factors drive the segregative phase separation observed in the PSS/PDADMA system, independent samples of PSS and PDADMA were finally prepared at high salt concentrations. A polymer fraction of 15 wt% was chosen to approximate the concentration of each individual polyelectrolyte in the PEC samples. The compositions of the prepared samples, and their phase behaviors, are summarized in Table 1. As seen in this table, no phase separation was observed for any of the PDADMA samples. The PSS samples, however, phase separated at KBr fractions of 28% or higher. As in the rest of the UPW, the denser, lower phase was enriched in polymer while the less dense upper phase was enriched in salt. Interestingly, however, both the polymer-rich and polymer-poor phases of the samples prepared with both PSS and PDADMA had higher polymer content than the those of the samples prepared with PSS alone at similar salt concentrations, suggesting that interactions with PDADMA change the salting out behavior of the PSS, as described in more detail below.| Polymer | Prepared composition | Phasea | Measured composition | Corrected compositionb | |||
|---|---|---|---|---|---|---|---|
| PEC (wt%) | KBr (wt%) | Organic (wt%) | Inorganic (wt%) | ϕ pol | ϕ KBr | ||
| a H = homogeneous, T = top/dilute layer, B = bottom/dense layer. b Corrected according to the method described in the ESI. | |||||||
| PSS | 15 | 26 | H | — | — | — | — |
| PSS | 15 | 27 | H | — | — | — | — |
| PSS | 15 | 28 | T | 3.4 | 33.2 | 0.046 | 0.148 |
| B | 15.7 | 32.4 | 0.211 | 0.126 | |||
| PSS | 15 | 29 | T | 2.1 | 35.4 | 0.029 | 0.162 |
| B | 17.6 | 33.3 | 0.238 | 0.128 | |||
| PSS | 15 | 30 | T | 1.7 | 36.7 | 0.024 | 0.171 |
| B | 13.8 | 35.1 | 0.189 | 0.144 | |||
| PDADMA | 15 | 26 | H | — | — | — | — |
| PDADMA | 15 | 27 | H | — | — | — | — |
| PDADMA | 15 | 28 | H | — | — | — | — |
| PDADMA | 15 | 29 | H | — | — | — | — |
| PDADMA | 15 | 30 | H | — | — | — | — |
4. Discussion
As noted in the introduction, the phase behavior of polyelectrolyte complexes and coacervates is typically well-described by a binodal curve with an upper critical salt concentration above which no phase separation occurs. Recently, however, studies have suggested that a second, segregatively phase-separated regime can occur at high salt concentrations in PECs prepared from weak, hydrophobic polyelectrolytes.40–42 Here, we aimed to (1) determine whether a similar segregative phase separation occurs in strong polyelectrolyte systems, such as PSS/PDADMA; (2) characterize the phase behavior in this regime; and (3) provide detailed insight into the mechanism behind this phenomenon. As described above, these efforts were successful. As seen in Fig. 2, phase separation was indeed observed over a wide range of PSS/PDADMA and KBr concentrations at salt concentrations approximately 1 M above the binodal. Rigorous characterization by TGA, FTIR, and NMR showed that phase separation in this regime was indeed segregative, with PSS preferentially partitioning to the dense phase and PDADMA preferentially partitioning to the less dense supernatant. Interestingly, however, at the highest salt and polymer concentrations studied, both polymers were again found in the same polymer-dense phase. These observations provide useful new insights into the interplay between complexation and salting out of charged polymers, as discussed in more detail, below.Segregative phase separation in neutral and like-charged polymer mixtures can occur when the individual polymer-solvent interactions are more favorable than the interactions between the different polymers.50–54 Mixtures of oppositely-charged polymers typically undergo associative, rather than segregative, phase separation.1 In polyelectrolyte mixtures containing poly(acrylic acid) (PAA) under conditions where the PAA is only partially charged,40,42 however, segregative phase behavior at high salt concentrations has been observed and attributed to increases in both the hydrophobicity and hydrogen bonding of PAA upon protonation.40 As noted in the Introduction, Li et al. recently showed that this behavior can be predicted in theoretical models by increasing the Flory-Huggins interaction parameter for PAA–water interactions. Partial protonation of the PAA was suggested to be necessary to increase the polymer–water interaction parameter enough to drive re-entrant phase separation. However, Li et al.'s model does predict that when the polymer–water interaction parameter is high enough, re-entrant segregative phase separation may occur for mixtures of fully charged polyelectrolytes as well. Our work demonstrates that this can indeed occur: poly(styrene sulfonate) is a strong polyelectrolyte, with no pH dependent protonation behaviors, but segregative phase separation of PSS/PDADMA mixtures at high salt concentrations is clearly observed.
Strong polyelectrolytes are typically viewed as hydrophilic polymers because of their high charge content. From a chemical perspective, however, poly(styrene sulfonate) has substantial hydrophobic character,55 with both a nonpolar, aliphatic backbone and nonpolar aromatic rings on every repeat unit. Phase separation at high salt concentrations can thus be driven by favorable interactions between the polymer chains that dominate once the charge interactions are sufficiently screened, analogous to the salting-out effect observed in many biological systems.56,57 As in protein solutions at high salt concentrations, salt–water interactions may also out-complete polymer–water interactions and effectively dehydrate the polymers, allowing hydrophobic interactions to drive aggregation.56 Similar dehydration-driven coacervation has been observed in polyelectrolyte mixtures prepared in the presence of poly(ethylene glycol), which attracts water strongly enough to pull it away from the polyelectrolytes in the mixture.14 This dehydration process effectively weakens the water–water and water–polyelectrolyte interactions and increases the polymer–water interaction parameter, in turn driving both the observed salting out of PSS from high-concentration KBr solutions and the segregative phase separation of PSS from PSS/PDADMA/KBr mixtures. We note, however, that in the UPW, samples typically contain only 5–10 water molecules per ionic site, in which limit mean field treatments and an average polymer–water interaction parameter may not accurately capture the physics of the system. The further preferential partitioning of water into the PDADMA-rich phase after phase separation is also consistent with a hydrophobicity-driven mechanism for this process, although the water content in the PSS-rich phase may also be affected by osmotic deswelling following phase separation.
Interestingly, while Li et al.'s model predicts that the dense phase should almost exclusively contain the more hydrophobic polyelectrolyte (or, the polyelectrolyte with the highest polymer–water interaction parameter), we find that at the highest salt and polymer concentrations studied, the composition of the dense phase shifts back toward stoichiometric (Fig. 7 and 8). This suggests that at very high salt and polymer concentrations, both PSS and PDADMA salt out. Whether they salt out as individual polymers or as neutralized or partially-neutralized polyelectrolyte complexes, however, is not clear from the present data. We also note that comparison of the data in Table 1 with the phase diagram in Fig. 8 (see also ESI†) suggests that at high salt concentrations, both the polymer-rich phase and the supernatant of samples prepared with PSS and PDADMA contain more polymer than the polymer-rich and polymer-poor phases of samples containing PSS alone. While this is expected for the supernatant (which, in PSS/PDADMA samples, must still contain PDADMA once the PSS salts out), it is somewhat less expected for the dense/polymer-rich phase (which would, in the absence of some type of PSS/PDADMA interaction, be expected to have the same polymer concentration as that of samples prepared by salting out of PSS alone). This result thus suggests that the presence of PDADMA moderates the salting out of PSS, consistent with Li et al.'s prediction that the presence of both polyanion and polycation increases the polymer–water interaction parameter necessary to drive re-entrant phase separation.42
A number of open questions remain about the re-entrant phase behavior observed in the upper phase window of the PSS/PDADMA system. First, the extent of hydrophobicity necessary to drive re-entrant, segregative phase behavior is not clear. While not the primary focus of our present work, we note that mixtures of PDADMA with poly(sulfopropyl acrylate) appear to exhibit similar phase behavior at high salt concentrations (see ESI†). Investigation of other, more hydrophilic strong polyanions, such as poly(2-acrylamido-2-methyl-1-propanesulfonate) or poly(vinyl sulfonate) may be useful for determining how much hydrophobic character is necessary to drive this behavior. Careful characterization of the viscoelasticity of the polymer-rich phase in these systems, if one is observed, may also help elucidate the role of hydrophobic interactions in driving the apparent gelation of the polymer-rich phase. Second, samples prepared at salt concentrations just above the critical salt concentration have been found to exhibit LCST behavior, phase separating upon moderate temperature increases.24 While this behavior has been attributed to the temperature dependence of the dielectric constant of water, hydrophobic effects typically also increase in strength as temperature is increased.58 Temperature dependent studies of the re-entrant, segregative phase separation observed at high salt concentrations should further elucidate the role of hydrophobic interactions in this phenomenon. Third, we note that the PSS and PDADMA samples used in this work were commercial samples which typically have very broad molecular weight distributions. Higher molecular weight polymers typically precipitate earlier than lower molecular weight polymers, and the phase behavior in Fig. 8 may be complicated by fractionation of the polymers. Studies on samples with narrower molecular weight distributions would be useful for determining the molecular weight dependence of re-entrant, segregative phase separation in these systems. Finally, at high polymer concentrations such as those used in our experiments, contributions from macromolecular crowding may be non-negligible.59–61 Further experiments on polyelectrolyte mixtures at high concentrations with neutral crowders rather than salt may be useful for helping determine the relative contributions of salting out and crowding to the observed behavior. Together, these investigations will provide detailed insight into the polymer–water, polymer–salt, and salt–water interactions that govern the properties of polyelectrolyte complexes and coacervates, and inform understanding of these systems across a wide range of solution conditions.
5. Conclusion
Most studies of polyelectrolyte complexes and coacervates have focused on compositions under the binodal, with compositions above this boundary assumed to form only single-phase solutions. However, phase separation at high salt concentrations has been predicted for weak polyelectrolytes. Here, we showed that a second two-phase regime also emerges at high salt and high polymer concentrations in mixtures of strong polyelectrolytes. In a series of experiments on PSS/PDADMA samples, we observed phase separation in mixtures with polymer concentrations above approximately 16 wt% and salt concentrations above approximately 20 wt%. Critically, preparing samples by direct mixing of pre-formed PEC, KBr, and water enabled us to access samples with much higher concentrations of salt and polymer than achievable by conventional methods. As observed in weak polyelectrolyte systems, the phase-separated samples were not stoichiometric, even though the starting PEC was, suggesting that phase separation in this regime is segregative phase separation driven by salting out of the more hydrophobic polymer (PSS). The unexpectedly rich phase behavior observed in this upper phase window should provide exciting opportunities for furthering understanding of the chemistry and physics of these materials.Data availability
Supporting data for this manuscript (including all photographs and TGA, NMR, and FTIR traces) are provided in the ESI.† The corresponding raw data files are also available via the authors institutional data repository, D-Scholarship@Pitt, at https://dx.doi.org/10.18117/9svg-9v48.Conflicts of interest
There are no conflicts of interest to declare.Acknowledgements
This work was supported by a grant from the National Science Foundation (CHE-2203857). The authors thank Leanne Gilbertson for access to instrumentation used in this work.References
- C. E. Sing and S. L. Perry, Soft Matter, 2020, 16, 2885–2914 RSC
.
- Y. Wang, S. Gao, W.-H. Ye, H. S. Yoon and Y.-Y. Yang, Nat. Mater., 2006, 5, 791–796 CrossRef CAS
.
- S. K. Samal, M. Dash, S. V. Vlierberghe, D. L. Kaplan, E. Chiellini, C. van Blitterswijk, L. Moroni and P. Dubruel, Chem. Soc. Rev., 2012, 41, 7147 RSC
.
- K. Osada, Polym. J., 2014, 46, 469–475 CrossRef CAS
.
- D. Sprouse and T. M. Reineke, Biomacromolecules, 2014, 15, 2616–2628 CrossRef CAS
.
- H. Shao, K. N. Bachus and R. J. Stewart, Macromol. Biosci., 2009, 9, 464–471 CrossRef CAS
.
- W. Wei, Y. Tan, N. R. Martinez Rodriguez, J. Yu, J. N. Israelachvili and J. H. Waite, Acta Biomater., 2014, 10, 1663–1670 CrossRef CAS
.
- H. J. Kim, B. Yang, T. Y. Park, S. Lim and H. J. Cha, Soft Matter, 2017, 13, 7704–7716 RSC
.
- P. Schaaf and J. B. Schlenoff, Adv. Mater., 2015, 27, 2420–2432 CrossRef CAS
.
- C. H. Porcel and J. B. Schlenoff, Biomacromolecules, 2009, 10, 2968–2975 CrossRef CAS
.
- X. Meng, S. L. Perry and J. D. Schiffman, ACS Macro Lett., 2017, 6, 505–511 CrossRef CAS
.
- M. T. Record, C. F. Anderson and T. M. Lohman, Q. Rev. Biophys., 1978, 11, 103–178 CrossRef CAS
.
- Z. Ou and M. Muthukumar, J. Chem. Phys., 2006, 124, 154902 CrossRef
.
- S. Park, R. Barnes, Y. Lin, B.-J. Jeon, S. Najafi, K. T. Delaney, G. H. Fredrickson, J.-E. Shea, D. S. Hwang and S. Han, Commun. Chem., 2020, 3, 83 CrossRef CAS
.
- S. Chen and Z.-G. Wang, Proc. Natl. Acad. Sci. U. S. A., 2022, 119, e2209975119 CrossRef CAS
.
- L. Li, A. M. Rumyantsev, S. Srivastava, S. Meng, J. J. de Pablo and M. V. Tirrell, Macromolecules, 2020, 54, 105–114 CrossRef
.
- A. E. Neitzel, Y. N. Fang, B. Yu, A. M. Rumyantsev, J. J. de Pablo and M. V. Tirrell, Macromolecules, 2021, 54, 6878–6890 CrossRef CAS
.
- K. Sadman, Q. Wang, Y. Chen, B. Keshavarz, Z. Jiang and K. R. Shull, Macromolecules, 2017, 50, 9417–9426 CrossRef CAS
.
- Y. Luo, M. Gu, C. E. R. Edwards, M. T. Valentine and M. E. Helgeson, Soft Matter, 2022, 18, 3063–3075 RSC
.
- A. B. Kayitmazer, A. F. Koksal and E. K. Iyilik, Soft Matter, 2015, 11, 8605–8612 RSC
.
- J. Lou, S. Friedowitz, J. Qin and Y. Xia, ACS Cent. Sci., 2019, 5, 549–557 CrossRef CAS
.
- J. Huang and J. E. Laaser, ACS Macro Lett., 2021, 10, 1029–1034 CrossRef CAS
.
- Z. Sui, J. A. Jaber and J. B. Schlenoff, Macromolecules, 2006, 39, 8145–8152 CrossRef CAS
.
- S. Ali, M. Bleuel and V. M. Prabhu, ACS Macro Lett., 2019, 8, 289–293 CrossRef CAS
.
- A. S. Ylitalo, C. Balzer, P. Zhang and Z.-G. Wang, Macromolecules, 2021, 54, 11326–11337 CrossRef CAS
.
- D. Priftis and M. Tirrell, Soft Matter, 2012, 8, 9396–9405 RSC
.
- J. Fu, H. M. Fares and J. B. Schlenoff, Macromolecules, 2017, 50, 1066–1074 CrossRef CAS
.
- J. T. G. Overbeek and M. J. Voorn, J. Cell. Comp. Physiol., 1957, 49, 7–26 CrossRef CAS
.
- K. T. Delaney and G. H. Fredrickson, J. Chem. Phys., 2017, 146, 224902 CrossRef
.
- M. Radhakrishna, K. Basu, Y. Liu, R. Shamsi, S. L. Perry and C. E. Sing, Macromolecules, 2017, 50, 3030–3037 CrossRef CAS
.
- T. K. Lytle and C. E. Sing, Soft Matter, 2017, 13, 7001–7012 RSC
.
- A. M. Rumyantsev, E. B. Zhulina and O. V. Borisov, Macromolecules, 2018, 51, 3788–3801 CrossRef CAS
.
- M. Andreev, V. M. Prabhu, J. F. Douglas, M. Tirrell and J. J. de Pablo, Macromolecules, 2018, 51, 6717–6723 CrossRef CAS
.
- M. Rubinstein, Q. Liao and S. Panyukov, Macromolecules, 2018, 51, 9572–9588 CrossRef CAS
.
- M. Ghasemi, S. Friedowitz and R. G. Larson, Macromolecules, 2020, 53, 6928–6945 CrossRef CAS
.
- J. J. Madinya and C. E. Sing, Macromolecules, 2022, 55, 2358–2373 CrossRef CAS
.
- A. M. Rumyantsev, A. Johner, M. V. Tirrell and J. J. de Pablo, Macromolecules, 2022, 55, 6260–6274 CrossRef CAS
.
- C. E. Sing and J. Qin, Macromolecules, 2023, 56, 5941–5963 CrossRef CAS
.
-
I. Konko, PhD thesis, Universite de Strasbourg, 2015
.
- L. Li, S. Srivastava, S. Meng, J. M. Ting and M. V. Tirrell, Macromolecules, 2020, 53, 7835–7844 CrossRef CAS
.
- M. V. A. Queirós and W. Loh, Polymers, 2021, 13, 2259 CrossRef
.
- H. Li, Y. Liu, F. Lan, M. Ghasemi and R. G. Larson, Macromolecules, 2023, 56, 7909–7920 CrossRef CAS
.
- P. Jha, P. Desai, J. Li and R. Larson, Polymers, 2014, 6, 1414–1436 CrossRef
.
- F. J. Morin, M. L. Puppo and J. E. Laaser, Soft Matter, 2021, 17, 1223–1231 RSC
.
- X. Lyu, B. Clark and A. M. Peterson, J. Polym. Sci., Part B: Polym. Phys., 2017, 55, 684–691 CrossRef CAS
.
- Q. Yao and C. A. Wilkie, Polym. Degrad. Stab., 1999, 66, 379–384 CrossRef CAS
.
- R. F. Shamoun, H. H. Hariri, R. A. Ghostine and J. B. Schlenoff, Macromolecules, 2012, 45, 9759–9767 CrossRef CAS
.
- H. M. Fares, Q. Wang, M. Yang and J. B. Schlenoff, Macromolecules, 2018, 52, 610–619 CrossRef
.
- J. B. Schlenoff, M. Yang, Z. A. Digby and Q. Wang, Macromolecules, 2019, 52, 9149–9159 CrossRef CAS
.
- K. Bergfeldt, L. Piculell and P. Linse, J. Phys. Chem., 1996, 100, 3680–3687 CrossRef CAS
.
- M. W. Edelman, E. van der Linden, E. de Hoog and R. H. Tromp, Biomacromolecules, 2001, 2, 1148–1154 CrossRef CAS
.
- M. Vis, V. F. D. Peters, R. H. Tromp and B. H. Erné, Langmuir, 2014, 30, 5755–5762 CrossRef CAS
.
- I. K. Voets, A. de Keizer, P. de Waard, P. M. Frederik, P. H. H. Bomans, H. Schmalz, A. Walther, S. M. King, F. A. M. Leermakers and M. A. Cohen Stuart, Angew. Chem., Int. Ed., 2006, 45, 6673–6676 CrossRef CAS
.
- M. Feric, N. Vaidya, T. S. Harmon, D. M. Mitrea, L. Zhu, T. M. Richardson, R. W. Kriwacki, R. V. Pappu and C. P. Brangwynne, Cell, 2016, 165, 1686–1697 CrossRef CAS
.
- B. A. Thurston, G. S. Grest and M. J. Stevens, ACS Macro Lett., 2022, 11, 217–222 CrossRef CAS
.
- T. Arakawa and S. N. Timasheff, Biochemistry, 1984, 23, 5912–5923 CrossRef CAS
.
-
K. C. Duong-Ly and S. B. Gabelli, Methods in Enzymology, Elsevier, 2014, pp. 85–94 Search PubMed
.
- J. Schellman, Biophys. J., 1997, 73, 2960–2964 CrossRef CAS
.
- H.-X. Zhou, G. Rivas and A. P. Minton, Annu. Rev. Biophys., 2008, 37, 375–397 CrossRef CAS
.
- Q. Bai, Q. Zhang, H. Jing, J. Chen and D. Liang, J. Phys. Chem. B, 2020, 125, 49–57 CrossRef
.
- B. Monterroso, W. Margolin, A. J. Boersma, G. Rivas, B. Poolman and S. Zorrilla, Chem. Rev., 2024, 124, 1899–1949 CrossRef CAS
.
Footnote |
| † Electronic supplementary information (ESI) available: Additional characterization data (TGA, FTIR, and NMR) for reported materials. See DOI: https://doi.org/10.1039/d4sm00994k |
| This journal is © The Royal Society of Chemistry 2024 |

