 Open Access Article
Creative Commons Attribution 3.0 Unported Licence
Rolling and ordering of micro rods in shear flow induced by rod wall interactions†
Martin
Wittmann
a,
Igor M.
Kulić
 b,
Antonio
Stocco
 b and
Juliane
Simmchen
 *c
*c
aPhysical Chemistry, TU Dresden, Zellescher Weg 19, 01069 Dresden, Germany
bInstitut Charles Sadron, CNRS UPR-22, 23 rue du Loess, Strasbourg, France
cPure and applied chemistry, University of Strathclyde, Cathedral Street, Glasgow, UK. E-mail: juliane.simmchen@strath.ac.uk
First published on 25th October 2024
Abstract
Dynamics of micro particles close to interfaces is a relevant topic in Soft Matter. Translational and rotational dynamics of particles possessing different shapes govern a broad range of interfacial phenomena from biofilm formation, drug delivery and particle active rolling motion. These dynamics usually occur in the presence of external fields such as shear flows, electric fields and gravity. By experiments and theoretical models, we investigate the rolling and translational motion of rod-shaped micro particles close to a solid wall in the presence or absence of a shear flow. Hydrodynamics, long-range surface forces and Brownian motion act on the micro rods, which show non-trivial dynamics such as translational motion orthogonal to the flow direction and preferential ordering with the rod long axis perpendicular to the flow direction.
1 Introduction
Considered one of mankind's greatest inventions and the basis of modern mobility, the wheel has enabled many economic and technological developments. While rolling of wheels and spheres is a broad concept in everyday life, the main definitions can be reduced to (a) moving by turning over and over on an axis,1 or (b) moving across a surface by turning over and over.2 In classic inertia on a macro scale, rolling combines rotation and translation by coupling to a nearby wall where rotation around an axis becomes translation. This means that the translated distance l = n·d·π where n is the number of revolutions and d is the diameter of the wheel. The conditions for colloidal particle rolling differ from the previous one because when we look at the microscale viscous forces become dominant and inertia does not play any role. When the particle and substrate are in contact without being completely stuck,3 there is usually a lubricating fluid layer between two surfaces. This fluid layer invalidates this simple correlation between distance and revolution and hydrodynamic coupling leads to more complex relationships. For the slow viscous motion of a sphere parallel to a wall, for the combined translation (v) – rotation (ω) dynamics in the absence of an external torque and in the limiting case where the sphere approaches the plane, it is predicted that v ≈ 4ωr pointing to strong slip effects.4 On the contrary, for very long (i.e. infinite) cylinder moving near a wall, the translation is expected to be independent of its rotation.5 This hydrodynamic coupling depends on the particle–wall distance and the shape of the particle.6 For simplicity, we will use the term “rolling” in the broadest sense to refer to the motion that repeats near the surface, even when separated by a thin layer of fluid.A number of different mechanisms have been developed to study the rotational and rolling motions of colloids, and a recent review summarised different rotational types of motion for active and driven matter.7 Approaches that have been used to induce rotation include the use of electric fields, most notably the well-known Quincke rotation: Quincke himself considered different geometries from spheres to cylinders8 and this approach was later extended to the microscale and shapes beyond spheres.9,10 When rolling is induced by rotating magnetic fields, the orientation of the rotations can be controlled by an external trigger,11,12 which has been studied as a proof-of-concept.13 Notably rod-like viruses with catalytic spike proteins roll on glycane-covered substrates.14,15 A chemical analogue of these rolling viruses was also recently realised in the synthetic realm using rod-like DNA nanotubes and enzymatic degradation of RNA strands between the rod and substrate16 The importance of particle surface interactions was demonstrated by applying lateral force microscopy combined with fluorescence microscopy, which also enabled the measurement of rolling friction.17 Polymeric rods have been demonstrated to roll on hot substrates,18 while hydrogel rods roll on wet surfaces.19
In most of these approaches, some kind of elongated shape has been used, which brings advantages in increased interactions with substrates. Among these systems, we want to focus on rod-shaped micrometre-sized particles,20 which are feasible micro-analogues wheels whose rotations can be measured by monitoring edge imperfections or chemical defects.
Here, we want to investigate one of the simplest, purely physically-driven ways of introducing a rolling motion of micro rods: we apply an external flow to sedimented, density mismatched micro rods near a surface, which acts as a driving force for rolling motion and dictates a predominant direction for translational motion. The flow profile of the shear flow has different magnitudes over the cross-section of the rod and as a result, we expect the onset of rotations around the axis of the rods, to some extent coupled with the substrate. The behaviour is governed by the rod orientation, which results from the interactions between rod, flow and substrate. These interactions are strongly impacted by the thickness of the lubrication layer between the rod and the substrate which will be tuned by adding salt. There we analyse the impact on the translational and rotational motion. A closer look at the translational motion reveals a component perpendicular to the flow direction which a theoretical model will rationalise. Finally, we observe an ordering of the micro rods in the shear flow and explain it using a theoretical model considering the hydrodynamic interactions with the shear flow combined with the rod wall interactions. The paper is organized as follows: Section 2 reports the main experimental results and the main equations of the theoretical analysis, which is extensively described in SI. Material and methods are described in Section 4, after the conclusions (Section 3).
2 Results and discussion
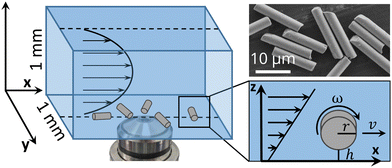
In our setup (Fig. 1), we observe the behaviour of glass micro rods in a square-shaped glass capillary with a 1 × 1 mm cross-section (Section 4.1). The rods consist of borosilicate glass with a radius r = 1.5 μm, a length L of around 18 μm a zeta potential of −36 mV and a density of 2.6 g cm−3. After allowing the rods to sediment to the bottom of the capillary where they orient their long axis parallel to the xy-plane, a flow is applied using a syringe pump. To avoid interactions between the rods we use a low rod concentration, where they cover around 2% of the surface. Driven by the shear flow the rods will move with a velocity v and at a Reynolds number in the order of 10−4. We observe the motion of the rods at the bottom of the capillary (xy-plane, z ≈ 0) and in the centre of the y-direction. There, the gradient of velocity is mainly in the z-direction with a shear rate (see ESI,† Section S3.1), where Q is the flow rate and H the width and height of the capillary (1 mm). Because the fluid layer on the upper side of the rod moves faster than on the bottom, a rotation with an angular frequency ω around its long axis is expected as illustrated in Fig. 1. In addition to the hydrodynamic forces from the flow, the rods are influenced by gravity, electrostatic repulsion with the wall and thermal fluctuations.
The velocity of a rod in the flow direction depends on the flow rate and the height between the rod and substrate. We can estimate the height of the rod in DI water considering the balance between the electrostatic double layer and gravity, which leads to an approximate height h of around 1500 nm between the bottom of the rod and the substrate (more details in ESI,† Section S2 and S3.2). Experimentally, the height can be tuned by adding NaCl, which decreases the Debye length and quenches the electrostatic repulsion between rod and substrate.
Fig. 2A shows that the rod velocity increases linearly with the flow rate and decreases drastically by adding NaCl (also see ESI,† Video S2). When comparing the velocity in 10−4 M NaCl to DI water we observe a decrease by about 58%. At even higher concentrations of NaCl, most rods stick to the substrate. We explain the lower velocity after the addition of salt by the decreased height between rod and substrate. Therefore, the rods are exposed to fluid layers moving with lower velocity and also experience higher friction from the wall as illustrated in Fig. 2B. If we assume, that a rod is moving with the velocity of the fluid at its centre of mass (v(z) = ![[small gamma, Greek, dot above]](https://www.rsc.org/images/entities/i_char_e0a2.gif) ·z), we can estimate the height between the bottom of the rod and the substrate knowing the channel geometry and the flow rate (see ESI,† Section S3.1). In DI water this predicts a height h = z − r = 940 nm between the bottom of the rod and the substrate. However, if we apply the same equation for the rods in 10−4 M NaCl, we would get a negative height of −470 nm, meaning that the rods are moving slower than the fluid at the height corresponding to their radius (vrod < vfluid(z = r)). Based on this, we conjecture, that in 10−4 M NaCl the rods are very close to the substrate and strongly influenced by friction with the wall. The observation of frequent sticking events underpins this.
·z), we can estimate the height between the bottom of the rod and the substrate knowing the channel geometry and the flow rate (see ESI,† Section S3.1). In DI water this predicts a height h = z − r = 940 nm between the bottom of the rod and the substrate. However, if we apply the same equation for the rods in 10−4 M NaCl, we would get a negative height of −470 nm, meaning that the rods are moving slower than the fluid at the height corresponding to their radius (vrod < vfluid(z = r)). Based on this, we conjecture, that in 10−4 M NaCl the rods are very close to the substrate and strongly influenced by friction with the wall. The observation of frequent sticking events underpins this.
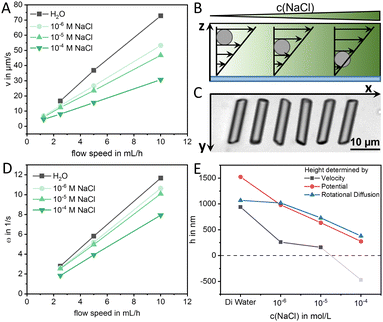 | ||
| Fig. 2 (A) Average velocity v of glass micro rods in flow direction in the centre of the capillary (in the y-direction) at different flow speeds and concentrations of NaCl, (B) scheme showing the impact of adding NaCl on the height between rod and substrate, (C) superimposed microscopy images of a glass rod in 5 mL h−1 flow (Δt = 0.55 s), (D) average angular velocity ω of glass micro rods around their long axis (if it is oriented perpendicular to the flow direction) at different flow speeds and concentrations of NaCl, (E) height between rod and substrate at different concentrations of NaCl determined by different methods (more details in ESI,† Section S3). | ||
The rotation of rods around their long axis can be observed by small asymmetries at the ends of the rods as shown in the superimposed image in Fig. 2C. The rotation originates from the vorticity of the flow and if the long axis is oriented perpendicular to the flow direction we expect that the angular velocity:  . Looking at the angular velocities at different flow speeds and different concentrations of NaCl (Fig. 2D) we observe a linear increase with the flow rate. Although the vorticity close to the wall does not depend on the height, we observe a decrease in ω after adding NaCl. As for the rod velocity, we explain this decrease by an increase in the rotational drag of the rod, which becomes closer to the wall.
As the height between the rod and substrate has a decisive influence on its motion, we apply two different methods to determine the height as a function of the salt concentration:
1. The equilibrium position from the energy potential as the sum of the electrostatic interaction with the wall and gravity.
2. The rotational diffusion coefficient around an axis parallel to the surface normal Drot (from experiment without flow).
The details about these methods are given in the ESI† (Section S3). Looking at the results in Fig. 2E, we see that the values from the potential and the diffusion agree well, and are above the values of the simple prediction using the rod velocity. As discussed before, this demonstrates that the rods move significantly slower than the fluid velocity at their centre of mass which agrees with analytical results.21
In addition to the velocity in the flow direction and the angular velocity, we also observe a motion component orthogonal to the original flow direction. We quantify this component by the angle β between the flow direction and the direction of motion. Relating this to the orientation of the rod, which is given by the normal angle α, we obtain the correlation displayed in Fig. 3. Each data point corresponds to an individual rod's average orientation and motion direction in the centre of the channel over at least 20 s in DI water at a flow rate of 2.5 mL h−1. To explain this behaviour two different effects have to be taken into account:
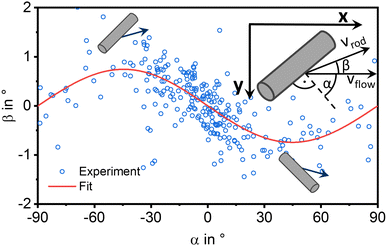 | ||
| Fig. 3 Relation between the rod orientation angle α and the angle of motion direction β at a flow rate of 2.5 mL h−1 with a fit using eqn (1). The definition of α and β is shown in the inset. | ||
1. The coupling between rotational and translational motion near a wall (i.e. rolling).
2. The anisotropic translational mobility of rods perpendicular and parallel to the rod's long axis.
These two effects point in opposite directions and therefore we can identify the dominant one: The coupling between rotational and translational motion converts the rotational motion around the rod's long axis close to a wall into translational motion in the direction normal to the rod's long axis. This corresponds to the opposite direction of the experimental result shown in Fig. 3. Numeric simulations carried out by Teng et al. came to the result that the rotational–translational coupling contribution is minimal.6 This is because the coupling originates from end effects, which are strong for disks and much weaker for rods. Using their data from OpenFoam simulations we calculate a coupling velocity of 0.1 μm s−1 for an angular velocity of 6 s−1 which is the experimental angular velocity for 5 mL h−1 (details in ESI,† Section S4.1). This coupling velocity is several orders of magnitude smaller than the experimental velocity, which results mainly from the flow.
Looking at the anisotropic mobility of a rod, the translational bulk drag (ξb‖ and ξb⊥) and the surface drag (ξs‖ and ξs⊥) have to be considered. The translational bulk drag comes from the mismatch of the rod's velocity vector with the bulk flow while the surface drag originates from the close-to-surface lubrication contact. These lead to the following relation between α and β (eqn (1)), where rfr is the friction ratio (eqn (2)). The derivation can be found in the ESI,† Section S4.2.
 | (1) |
 | (2) |
As the friction in the perpendicular direction is higher than in the parallel direction (with respect to the long axis), this would result in a drift in the parallel direction, qualitatively matching our experimental findings. Fitting eqn (1) to our experimental data (Fig. 3), we get a friction ratio of rfr = 38 in DI water and smaller values down to rfr = 13 with increasing concentration of NaCl (see ESI,† Fig. S3).
Finally, we analyse the orientation of the rods in flow. In bulk shear flow, rod-shaped particles are known to perform so-called “Jeffery orbits”, which is a periodic motion predicted more than 100 years ago by the British physicist George B. Jeffery.22 These orbits were experimentally observed on different length scales including millimetre-sized spheroids made from aluminium wires placed in a viscous sodium silicate solution23 or different micro rods in density-matched solutions.24,25 The behaviour near a wall has been analysed theoretically.21,26–28 Experimentally, a periodic kayaking motion was observed for SiO2 rods with a length of 3–4 μm and a diameter of 500–700 nm.29
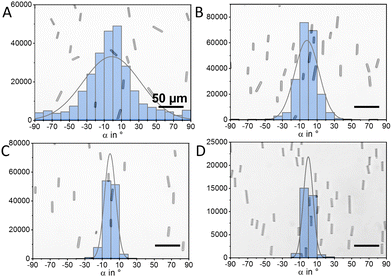
In contrast to these previous works, our rods are strongly density mismatched and we do not observe periodic changes in orientation similar to Jeffery orbits or “kayaking motion”. The rods show a preferred orientation of the normal angle α = 0, corresponding to an orientation with the long axis perpendicular to the flow direction. This effect becomes more pronounced with increasing flow speed as displayed in the histograms and snapshots in Fig. 4 and in ESI,† Video S1. Additionally, we observe random changes, which appear to be Brownian.
We conjecture that these resulting dynamics originate from an interplay of the rod–wall and the rod–flow interactions. To understand the impact on the orientation in a shear flow, we build a theoretical model considering the torque from the hydrodynamic interaction with the shear flow and the rod wall interaction. The latter is introduced through a tilting potential, coming from the electrostatic interaction of a rod with the nearby wall and is characterised by the stiffness constant a of the harmonic tilting potential. The derivation of the model is given in the ESI† (Sections S5 and S6) and results in the following equations of motion, for a rod with the unit vector t (see Fig. 6A):
 | (3) |
 | (4) |
 is the hydrodynamic aspect ratio. ξrot is the friction constant for the rotational motion around the short axis and can be determined experimentally from the rotational diffusion coefficient Drot: ξrot = kBT/Drot, which gives a value of ξrot = 1150kBTs for rods with a length of 18 μm. Looking at the phase plane (Fig. 5), we see a trivial equilibrium point for tx = 0 and tz = 0 corresponding to the preferred orientation observed in the experiment. Additionally, there are two saddle points close to tx = ±1. A linear stability analysis of the system close to tx, tz = 0 reveals that this state is always a stable attractor. However, depending on the rod's aspect ratio, shear rate and confinement strength, the rod's orientation can either relax exponentially, for strong confinement a ≥ 2ε
![[small gamma, Greek, dot above]](https://www.rsc.org/images/entities/i_char_e0a2.gif) ξrot, or in an oscillatory kayaking-like fashion, for weak confinement a < 2ε
ξrot, or in an oscillatory kayaking-like fashion, for weak confinement a < 2ε![[small gamma, Greek, dot above]](https://www.rsc.org/images/entities/i_char_e0a2.gif) ξrot (see ESI,† Section S6.1.5). The notable absence of any kayaking motion in our experiments can be attributed to the very strong confinement of our long and heavy rods, as estimated further below.
ξrot (see ESI,† Section S6.1.5). The notable absence of any kayaking motion in our experiments can be attributed to the very strong confinement of our long and heavy rods, as estimated further below.
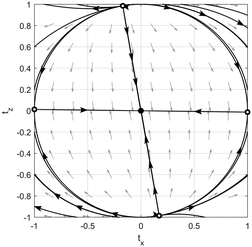 | ||
Fig. 5 The (full non-linear system) (tx, tz) phase plane with ξrot = 1150kBTs, ![[small gamma, Greek, dot above]](https://www.rsc.org/images/entities/i_char_e0a2.gif) = 15 s−1, ε = 0.273 and a = 100 = 15 s−1, ε = 0.273 and a = 100![[thin space (1/6-em)]](https://www.rsc.org/images/entities/char_2009.gif) 000kBT.30 000kBT.30 | ||
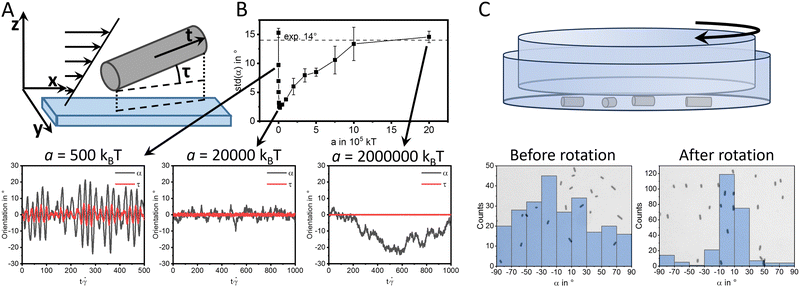
To elucidate the contribution of thermal fluctuations on the orientation distribution, we perform Python simulations, where Brownian white noise is added to the system in form of a random angular torque satisfying the fluctuation dissipation relation (see ESI,† Section S6.2). We evaluate the magnitude of the thermal fluctuations by the friction constant for the rotational motion ξrot which was determined from the rotational diffusion coefficient, which has a value of around Drot = 8.6 × 10⁻⁴ s−1 for a rod with a length of 18 μm in DI water. The orientation is described by the rod normal angle α and the tilting angle with respect to the xy-plane τ (Fig. 6A). We now analyse the effect of the rod wall interaction by tuning the stiffness constant a of the harmonic tilting potential. As expected, increasing a leads to a clear confinement of τ around a value of 0 (bottom of Fig. 6B). The behaviour of the α distribution is more complex and can be quantified by its standard deviation (top of Fig. 6B). For small a (500kBT), the confinement is weak and periodic reorientations mathematically similar to Jeffery orbits with a large standard deviation of α are observed, which is comparable to the results found for smaller SiO2 rods in ref. 29. A Fourier transformation of both angles gives a period of these oscillations of around To = 23.8/![[small gamma, Greek, dot above]](https://www.rsc.org/images/entities/i_char_e0a2.gif) which matches well with the analytical result
which matches well with the analytical result  described in the ESI,† Section S6.1.5. At intermediate a values (20
![[thin space (1/6-em)]](https://www.rsc.org/images/entities/char_2009.gif) 000kBT), these orbits disappear and α and τ are close to 0. The fluctuations of τ have a magnitude of ±1° and occur at a fast timescale of around 2/
000kBT), these orbits disappear and α and τ are close to 0. The fluctuations of τ have a magnitude of ±1° and occur at a fast timescale of around 2/![[small gamma, Greek, dot above]](https://www.rsc.org/images/entities/i_char_e0a2.gif) . At even larger (a > 20
. At even larger (a > 20![[thin space (1/6-em)]](https://www.rsc.org/images/entities/char_2009.gif) 000kBT), the fluctuations of τ decrease further to a magnitude of ±0.1° and the standard deviation of α increases again. This is because the coupling with the shear flow requires a z-component of the orientation, and therefore vanishes if the surface interaction strongly confines this component. The a value in our experiment can be estimated by comparing the standard deviation of α to its experimental value (e.g. dashed line in Fig. 6B for DI water and 5 mL h−1) resulting in an order of magnitude of 106kBT. We can also estimate a theoretically by the rod wall interaction (ESI† – eqn (S12)), which gives us a value of 26
000kBT), the fluctuations of τ decrease further to a magnitude of ±0.1° and the standard deviation of α increases again. This is because the coupling with the shear flow requires a z-component of the orientation, and therefore vanishes if the surface interaction strongly confines this component. The a value in our experiment can be estimated by comparing the standard deviation of α to its experimental value (e.g. dashed line in Fig. 6B for DI water and 5 mL h−1) resulting in an order of magnitude of 106kBT. We can also estimate a theoretically by the rod wall interaction (ESI† – eqn (S12)), which gives us a value of 26![[thin space (1/6-em)]](https://www.rsc.org/images/entities/char_2009.gif) 000kBT.
000kBT.
To allow a simple visual proof of ordering micro rods by shear flow, we confine the rods between two Petri dishes and create a shear flow by slowly rotating the upper one by hand. Similar to the controlled flow, observation with an optical microscope revealed a clear ordering of the rods similar to the experiments in flow as illustrated in Fig. 6C.
3 Conclusion
In this work, we demonstrate that a rolling type of motion of micro rods can be induced by an external shear flow when the rods are sedimented close to the bottom substrate. The translational and rotational components of the motion are influenced by the height between the rod and substrate, which can be tuned by adding NaCl. Additionally, we observe a translational component orthogonal to the flow direction, which we explain by the anisotropic mobility of the rod in orthogonal and parallel directions. Looking at the rod orientation, an ordering of the micro rods with their long axis perpendicular to the flow direction is observed. We explain this experimental result by building a theoretical model, considering the hydrodynamic interactions between the rod and flow and the rod wall interactions, which are introduced by a tilting potential. Finally, we design a proof of concept experiment to demonstrate, that these findings can be applied to order a large number of micro rods using a simple setup.4 Materials and methods
4.1 Experimental methods
Microscopy experiments in flow were conducted in a square glass capillary (1 mm × 1 mm, 0.2 mm wall thickness, 50 mm length) from Vitrocom. The capillaries were cleaned by an adapted procedure from Pallavicini et al.31 The capillaries were first rinsed with DI water and placed in a 40 mL glass vial with 25 mL DI water, 5 mL NH3 (28%) and 5 mL H2O2 (37%), followed by 15 m ultrasonication. After rinsing with DI water, a second cleaning step in 25 mL DI water, 5 mL HCl (37%) and 5 mL H2O2 (37%) at 80 °C was applied. After that, the capillaries were rinsed multiple times with DI water and stored in DI water.Glass micro rods with a diameter of 3 μm (PF-30S) were purchased from Nippon Electric Glass Co., Ltd, the micro rods were dispersed in DI water or the NaCl solution and 20 μL were added to the capillary before it was connected to a syringe pump with polyethylene tubings. The capillary was fitted on an inverted Carl Zeiss microscope using a home-built 3D-printed microscope stage. The rods were allowed to sediment to the substrate before starting the flow. Videos were recorded with a frame rate of 40 fps at least 20 s after starting the flow. Experiments with different flow rates were carried out with increasing flow rates because higher flow rates lead to higher ordering.
SEM images of the micro rods were taken using a ZEISS Gemini SEM 300 using the SE detector.
Zeta potential was determined using a Malvern Zetasizer Nano ZSP.
4.2 Data analysis
Data analysis was carried out using custom MATLAB scripts. Images were segmented into binary images and position, dimensions, and orientation of rods were measured using the regionprops command. Velocities were determined as average instantaneous speeds. To minimize the impact of a gradient of flow speed in the y-direction only tracks in a window of ±100 pixels (58.6 μm) from the centre in the y-direction (determined by the maximum flow speed) were analyzed.The angular velocity ω was determined by manually counting the number of complete rotations (Nrot) per time Δt taking benefit of asymmetries at the ends of the rods (see Fig. 2C): ω = 2πNrot/Δt. This was done for at least 7 rotations and 5 rods per condition. Mean-square-displacement (MSD) analysis was done for videos without flow of more than 100 tracks longer than 4000 frames using the msdanalyzer MATLAB class.32 The diffusion coefficient was determined by the slope of the MSD plot divided by 2.
4.3 Simulations
Simulations were performed according to the theoretical model in the ESI.† The following parameters were used for the simulation:![[small gamma, Greek, dot above]](https://www.rsc.org/images/entities/i_char_e0a2.gif) = 15.1 s−1 (which corresponds to a flow rate of 5 mL h−1), 2r = 3 μm, L = 18 μm, ξrot = 1150kBTs (experimental value for 18 μm rod in DI water). The preferred orientation of tx = 0, ty = 1 and tz = 0 was chosen as the start orientation of the rod. Simulations were performed over a time of t = 1000/
= 15.1 s−1 (which corresponds to a flow rate of 5 mL h−1), 2r = 3 μm, L = 18 μm, ξrot = 1150kBTs (experimental value for 18 μm rod in DI water). The preferred orientation of tx = 0, ty = 1 and tz = 0 was chosen as the start orientation of the rod. Simulations were performed over a time of t = 1000/![[small gamma, Greek, dot above]](https://www.rsc.org/images/entities/i_char_e0a2.gif) with time steps of Δt = 0.01/
with time steps of Δt = 0.01/![[small gamma, Greek, dot above]](https://www.rsc.org/images/entities/i_char_e0a2.gif) .
.
Author contributions
Conceptualization MW, JS; data curation MW, IK; funding acquisition JS, IK, AS; investigation MW, IK; visualization MW; writing MW, IK, JS, AS.Data availability
The data supporting this article is available within the article or its ESI.† Any further request can be directed to the corresponding author.Conflicts of interest
There are no conflicts to declare.Acknowledgements
All Authors acknowledge the DFG-ANR project Rodrolls - 490954343, ANR-21-CE30-0058. MW and JS acknowledge the German Fulbright Foundation for a Fulbright Cottrell Fellowship.Notes and references
- Britannica, Britannica Dictionary definition of ROLL, 2024 Search PubMed.
- OxfordLanguages, Oxford Languages definition of rolling, 2024 Search PubMed.
- O. T. Sari, G. G. Adams and S. Müftü, J. Appl. Mech., 2005, 72, 633–640 CrossRef.
- A. Goldman, R. Cox and H. Brenner, Chem. Eng. Sci., 1967, 22, 637–651 CrossRef CAS.
- D. Jeffrey and Y. Onishi, Q. J. Mech. Appl. Math., 1981, 34, 129–137 CrossRef.
- J. Teng, B. Rallabandi, H. A. Stone and J. T. Ault, J. Fluid Mech., 2022, 938, A30 CrossRef CAS.
- X. Lyu, J. Chen, R. Zhu, J. Liu, L. Fu, J. L. Moran and W. Wang, ACS Nano, 2023, 17, 11969–11993 CrossRef CAS PubMed.
- G. Quincke, Ann. Phys., 1896, 295, 417–486 CrossRef.
- B. Zhang, H. Karani, P. M. Vlahovska and A. Snezhko, Soft Matter, 2021, 17, 4818–4825 RSC.
- A. Mauleon-Amieva, M. P. Allen, T. B. Liverpool and C. P. Royall, Sci. Adv., 2023, 9, eadf5144 CrossRef PubMed.
- P. Tierno, R. Golestanian, I. Pagonabarraga and F. Sagués, Phys. Rev. Lett., 2008, 101, 218304 CrossRef PubMed.
- T. O. Tasci, P. S. Herson, K. B. Neeves and D. W. M. Marr, Nat. Commun., 2016, 7, 10225 CrossRef CAS PubMed.
- F. Martinez-Pedrero and P. Tierno, Phys. Rev. Appl., 2015, 3, 051003 CrossRef.
- T. Sakai, S. I. Nishimura, T. Naito and M. Saito, Sci. Rep., 2017, 7, 45043 CrossRef CAS PubMed.
- F. Ziebert and I. M. Kulić, Phys. Rev. Lett., 2021, 126, 218101 CrossRef CAS PubMed.
- A. Bazrafshan, T. A. Meyer, H. Su, J. M. Brockman, A. T. Blanchard, S. Piranej, Y. Duan, Y. Ke and K. Salaita, Angew. Chem., Int. Ed., 2020, 59, 9514–9521 CrossRef CAS PubMed.
- S. Scherrer, S. N. Ramakrishna, V. Niggel, N. D. Spencer and L. Isa, Langmuir, 2024, 40, 6750–6760 CrossRef CAS PubMed.
- A. Baumann, A. Sanchez-Ferrer, L. Jacomine, P. Martinoty, V. Houérou, F. Ziebert and I. Kulić, Nat. Mater., 2018, 17, 523–527 CrossRef CAS PubMed.
- A. Bazir, A. Baumann, F. Ziebert and I. M. Kulić, Soft Matter, 2020, 16, 5210–5223 RSC.
- M. Wittmann, K. Henze, K. Yan, V. Sharma and J. Simmchen, Colloid Polym. Sci., 2023, 301, 783–799 CrossRef CAS.
- J.-T. Jeong and C.-S. Jang, Phys. Fluids, 2014, 26, 123104 CrossRef.
- G. B. Jeffery and L. N. G. Filon, Proc. R. Soc. London, Ser. A, 1922, 102, 161–179 Search PubMed.
- G. I. Taylor, Proc. R. Soc. London, Ser. A, 1923, 103, 58–61 Search PubMed.
- J. Einarsson, A. Johansson, S. K. Mahato, Y. N. Mishra, J. R. Angilella, D. Hanstorp and B. Mehlig, Acta Mech., 2013, 224, 2281–2289 CrossRef.
- J. Einarsson, B. M. Mihiretie, A. Laas, S. Ankardal, J. R. Angilella, D. Hanstorp and B. Mehlig, Phys. Fluids, 2016, 28, 013302 CrossRef.
- R. G. Cox, J. Fluid Mech., 1971, 45, 625–657 CrossRef.
- M. Zurita-Gotor, J. Bławzdziewicz and E. Wajnryb, J. Rheol., 2007, 51, 71–97 CrossRef CAS.
- M. L. Ekiel-Jeżewska, K. Sadlej and E. Wajnryb, J. Chem. Phys., 2008, 129, 041104 CrossRef PubMed.
- A. Zöttl, K. E. Klop, A. K. Balin, Y. Gao, J. M. Yeomans and D. G. A. L. Aarts, Soft Matter, 2019, 15, 5810–5814 RSC.
- Y. Zhang and Y. Zhang, Phase Portrait Plotter on 2D phase plane, 2024, https://www.mathworks.com/matlabcentral/fileexchange/110785-phase-portrait-plotter-on-2d-phase-plane, Accessed: 2024-07-24.
- P. Pallavicini, G. Dacarro, M. Galli and M. Patrini, J. Colloid Interface Sci., 2009, 332, 432–438 CrossRef CAS PubMed.
- N. Tarantino, J.-Y. Tinevez, E. F. Crowell, B. Boisson, R. Henriques, M. Mhlanga, F. Agou, A. Israël and E. Laplantine, J. Cell Biol., 2014, 204, 231–245 CrossRef CAS PubMed.
Footnote |
| † Electronic supplementary information (ESI) available. See DOI: https://doi.org/10.1039/d4sm00999a |
| This journal is © The Royal Society of Chemistry 2024 |

