Co-electrolysis SOEC and internal reforming SOFC for achieving a carbon-neutral society
Received
24th February 2024
, Accepted 21st April 2024
First published on 25th April 2024
Abstract
Solid oxide electrolysis cells (SOECs) can produce carbon monoxide (CO) from carbon dioxide (CO2) in addition to hydrogen (H2) from steam using renewable energy sources such as solar and wind power. Methanol (MeOH) and dimethyl ether (DME) are industrially synthesized from syngas (H2 + CO mixture) with an H2/CO ratio of 2. Solid oxide fuel cells (SOFCs) can generate power using MeOH and DME in addition to H2. To achieve a carbon-neutral society, H2O/CO2 co-electrolysis SOECs and internal reforming SOFCs using MeOH and DME were investigated using the same negatrode-supported microtubular cells. As a result of quantitative analysis of the gas composition, the H2/CO ratios of the product gases were identical to the H2O/CO2 ratios of the input gases during the co-electrolysis. The gas diffusion resistance increased with decreasing H2O/CO2 ratios for co-electrolysis SOECs, and increased with time during co-electrolysis at H2O/CO2 = 2 and internal reforming of MeOH and DME. H2O/CO2 co-electrolysis SOECs and internal reforming SOFCs using MeOH and DME were successfully operated for 100 h.
Sustainability spotlight
To achieve a carbon-neutral society, converting carbon dioxide (CO2) into raw materials and synthetic fuels (e-fuel) is very important. Solid oxide electrolysis cells (SOECs) can produce syngas (H2 + CO mixture) from steam and CO2 using renewable energy sources such as solar and wind power. Syngas can be converted into methanol (MeOH) and dimethyl ether (DME) in addition to e-fuel such as gasoline, kerosene, and diesel via Fischer–Tropsch synthesis. MeOH and DME are fuels for solid oxide fuel cells (SOFCs) in addition to raw materials for commodity plastics (e-chemical). The reversible SOECs and SOFCs using carbon-containing fuels contribute to the following UN sustainable development goals: affordable and clean energy (SDG 7), responsible consumption and production (SDC 12), and climate action (SDG 13).
|
1. Introduction
Solid oxide fuel cells (SOFCs) are expected to be power generation systems with high energy conversion efficiencies. SOFCs can directly use hydrocarbon and alcohol fuels in addition to hydrogen (H2), because oxide ions (O2−) conduct through an electrolyte and the electrochemical oxidation occurs at the negatrode (fuel electrode) at high temperatures above 600 °C.1–3 Power generation with internal partial oxidation reforming of butane and steam reforming of ethanol has been investigated using microtubular SOFCs supported on a Ni-Gd-doped ceria (GDC) negatrode.4 A long-term flight of a drone (UAV; unmanned aerial vehicle) was demonstrated using a portable SOFC system powered by liquefied petroleum gas (LPG) cartridges.5 Because LPG is a fossil fuel, replacing LPG with carbon-neutral fuels is desirable. Although bio-ethanol helps to reduce carbon dioxide (CO2) emissions, sulfur-containing bio-fuels deteriorate Ni-based SOFC negatrodes by promoting carbon deposition.6
Solid oxide cells can be used as electrolyzers as shown in Fig. 1. Solid oxide electrolysis cells (SOECs) can produce carbon monoxide (CO) from CO2 in addition to H2 from steam via the reverse reaction of SOFCs with O2− conduction through the electrolyte. Alkaline and polymer electrolyte membrane (PEM) electrolysis are widely demonstrated for H2 production.7 Some researchers have investigated low-temperature CO2 electrolysis using alkaline aqueous electrolytes and PEMs. However, these require a high cell voltage above 2.5 V, and these exhibit a low faradaic efficiency.8 On the contrary, SOECs can produce CO at 1.4 V via high-temperature CO2 electrolysis, resulting in faradaic and energy efficiencies of 100% in principle. If external thermal energy can compensate for the latent heat of water vaporization and endothermic electrolysis, a further decrease in cell voltage and an increase in efficiency are possible.
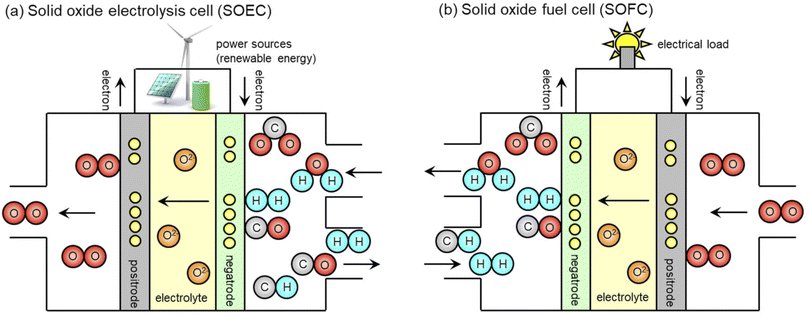 |
| | Fig. 1 Schematics of (a) co-electrolysis SOEC and (b) internal reforming SOFC. | |
CO2 capture is one of the most important technologies for achieving a carbon-neutral society. Chemical adsorption method involving monoethanolamine and gas separation membranes have been demonstrated for CO2 capture.9 The initial target is treating the exhaust gases from plants, which contain 4–14 vol% CO2. Recently, direct air capture (DAC), which extracts CO2 directly from the atmosphere at any location, has been investigated.10 Mixed ionic liquid membranes exhibit a high CO2 permeability of 2.5983 × 10⁻⁶ cm3(STP)·cm cm−2 s−1 cmHg−1 and a high CO2/N2 selectivity of 1.0059 × 10⁴ at 400 ppm CO2.11
SOECs can simultaneously perform steam and CO2 electrolysis, known as co-electrolysis.12–16 Syngas, a mixture of H2 and CO, is produced via the co-electrolysis SOECs. Syngas can be converted into many useful sources and fuels as follows:
| | | Methanation: 3H2 + CO → CH4 + H2O | (1) |
| | | Fischer–Tropsch synthesis: (2n + 1)H2 + nCO → CnH2n+2 + nH2O | (2) |
| | | Methanol synthesis: 2H2 + CO → CH3OH | (3) |
| | | Dimethyl ether (DME) synthesis: 4H2 + 2CO → CH3OCH3 + H2O | (4) |
Methanation is used to produce synthetic natural gas,17 with the advantage of utilizing existing pipelines and infrastructure. However, the SOFCs using synthetic natural gas require a high temperature of 790 °C for methane reforming. Fischer–Tropsch (FT) synthesis is used to produce synthetic fuels (e-fuel) such as gasoline, kerosene, and diesel for airplanes, vessels, and large vehicles.18 A Co/SiO2 catalyst yields 1500 and 815 g kg-cat−1 h−1 of C5+ and C10–20 hydrocarbons, respectively, via FT synthesis at 776 °C and 1.1 MPa.19 However, SOFCs easily deteriorate because of carbon deposition, when hydrocarbons with high carbon number are used as fuels. Therefore, the author focuses on methanol (MeOH) and dimethyl ether (DME). MeOH is industrially produced from syngas generated by natural gas reforming using Cu/ZnO-based catalysts.20–22 Direct methanol fuel cells (DMFCs) using PEM electrolyte have been investigated owing to their low reforming temperatures below 150 °C.23 However, DMFCs suffer from CO poisoning on a negatrode and MeOH crossover through an electrolyte. For SOFCs, MeOH is a promising fuel, because it does not cause CO poisoning and MeOH crossover.24–27 In addition, DME can be easily produced by the dehydration of methanol.28
| | | DME synthesis: 2CH3OH → CH3OCH3 + H2O | (5) |
The reforming temperature of DME is less than 180 °C, and its characteristics are similar to those of LPG, because it is easily liquified at 0.6 MPa. Thus, DME is a possible alternative to LPG as a fuel for portable SOFC systems.29,30
In the present work, co-electrolysis SOECs and internal reforming SOFCs were investigated using microtubular negatrode-supported cells with the same cell configuration. Numerous researchers have demonstrated reversible SOFC/SOEC operation using H2 and steam.31–33 However, there have been few demonstrations of reversible operation using carbon-containing fuels. The H2/CO ratio of the syngas should be 2 for MeOH, DME, and FT syntheses. To investigate the effect of CO2 concentration on electrochemical characteristics, co-electrolysis was performed with varying H2O/CO2 ratios from 0 to infinity (∞). The compositions of the product gases after co-electrolysis were analyzed using gas chromatography. Assuming that MeOH and DME are synthesized from syngas, internal reforming SOFCs were demonstrated using MeOH and DME. Steam reforming was investigated for MeOH, because it is a liquid with water solubility. Partial oxidation reforming was investigated for DME in addition to steam reforming, since it easily mixes with ambient air at ordinary temperatures and pressures. Short-term durability tests of the co-electrolysis SOECs using an input gas at H2O/CO2 = 2 and internal reforming SOFCs using MeOH and DME were conducted for 100 h.
2. Experimental
2.1 Cell preparation
Similar to previously reported internal reforming of butane and ethanol,4 negatrode-supported microtubular cells with the same cell configuration were used for co-electrolysis SOECs and internal reforming SOFCs using MeOH and DME. Negatrode microtube substrates were constructed using 60 wt% NiO (Sumitomo Metal Mining)-40 wt% Ce0.9Gd0.1O1.95 (GDC; Shin-Etsu Chemical) adding pore former (acrylic resin; Sekisui Plastic) and binder (cellulose; Yuken Kogyo) powders. These powders were mixed using a kneading machine with adding an appropriate amount of water, and the negatrode microtubes were extruded using a piston cylinder. After extrusion, the microtubes were dried overnight in air at room temperature. A slurry was prepared by mixing (Y2O3)0.08(ZrO2)0.92 (YSZ; Tosoh), binder (polyvinyl butyral; Sekisui Chemical) dispersant (tallow propylene diamine, Kao Chemicals) and plasticizer (dioctyl adipate; Wako Pure Chemical Industries) with ethanol and toluene solvents. The YSZ electrolyte was formed by dip-coating. The YSZ electrolyte thin-film and the NiO–GDC negatrode microtube were co-sintered in air for 3 h at 1400 °C. The GDC interlayer and the positrode (air electrode) of 70 wt% La0.6Sr0.4Co0.2Fe0.8O3−δ (LSCF; Kusaka Rare Metal)-30 wt% GDC were coated in a similar manner. The interlayer and positrode thin-film layers were sintered sequentially in air for 2 h at 1200 °C and for 1 h at 1050 °C, respectively. The microtube diameter and positrode area after sintering were 2.8 mm and 2.6 cm2, respectively. The thicknesses of the negatrode, electrolyte, interlayer, and positrode were 640, 10, 1, and 20 μm, respectively.
2.2 Evaluation of co-electrolysis SOECs and internal reforming SOFCs
Table 1 and Fig. 2 show the experimental conditions and setup for evaluating the co-electrolysis SOECs and internal reforming SOFCs. For internal steam reforming of MeOH, an aqueous MeOH solution (82 vol% at S/C = 0.5 and 69 vol% at S/C = 1.0) was supplied to the negatrode using a pump and vaporizer heated at 250 °C. For co-electrolysis and internal steam reforming of DME, steam was fed to the negatrode using a temperature-controlled bubbler. Before evaluation, a mixture of 20% H2-3% H2O-77% N2 was supplied to the negatrode for 2 h at 700 °C for Ni catalyst reduction. Subsequently, the input gases were adjusted to the flow rates listed in Table 1, and air was supplied to the positrode at a rate of 100 mL min−1. Hydrogen was supplied during co-electrolysis SOEC to prevent Ni catalyst oxidation in the negatrode under open circuit voltage (OCV). Current–voltage (I–V) characteristics were evaluated using a potentiostat/galvanostat (Solartron Analytical 1470E) by varying the voltage from OCV to 0.4 and 1.4 V for SOECs and SOFCs, respectively, at a sweep rate of 5 mV s−1. Using a frequency response analyzer (Solartron Analytical 1455), the electrochemical impedance between the negatrode and positrode was measured in the frequency range of 100 kHz–0.1 Hz with 20 steps per logarithmic decade. The polarization impedance can be deconvoluted using the distribution of relaxation times (DRT) analysis.34,35 The DRT analysis was performed using Z-Assist software (Toyo Corp.).36 It used FTIKREG software37 to solve an ill-posed inverse problem in the DRT analysis via Tikhonov regularization. Real impedance was used for the DRT analysis because the impact of measurement errors and inductive components was lower than that with imaginary impedance.38 Kramers–Kronig validation was performed using K–K test39 and Lin-KK Tool40 software. Residuals between measured and Kramers–Kronig transformed impedances were within 0.5%. The parameters obtained DRT analysis were refined by complex non-linear least squares (CNLS) fitting using ZView software (Scribner Associates), assuming an equivalent circuit model with a series connection of resistance (R0) and parallel resistance-capacitance (RkCk) elements. The thermodynamic equilibrium compositions were calculated using HSC Chemistry 5.11 (Outokumpu). During co-electrolysis, the flow rates of the product gases were analyzed with a thermal conductivity detector (TCD) in a micro gas chromatograph (Agilent Technologies 490; Molsieve 5A column with Ar as the carrier gas for H2, N2, CH4, and CO, and PoraPLOT Q column with He as the carrier gas for CO2). Steam flow rates in the product gases were not measured by micro gas chromatography, because steam was removed using a condenser as shown in Fig. 2. The steam flow rates of the product gases were estimated by considering the mass balance of the hydrogen, oxygen and carbon species. Unfortunately, the flow rates of the reformate gases during internal reforming could not be analyzed, because MeOH and DME are soluble in water. Short-term durability tests of co-electrolysis SOECs and internal reforming SOFCs were conducted for 100 h at a constant voltage of 1.28 V and a constant current density of 0.3 A cm−2, respectively.
Table 1 Flow rates (mL min−1) of the input gases for co-electrolysis SOECs and internal steam (SR) and partial oxidation (POx) reforming SOFCs
|
|
H2O/CO2 |
H2 |
H2O |
CO2 |
O2 |
MeOH or DME |
N2 |
| Co-electrolysis |
H2O/CO2 = 0 |
3.0 |
0.0 |
20.0 |
|
|
77.0 |
| H2O/CO2 = 1/3 |
3.0 |
5.0 |
15.0 |
|
|
77.0 |
| H2O/CO2 = 1 |
3.0 |
10.0 |
10.0 |
|
|
77.0 |
| H2O/CO2 = 2 |
3.0 |
13.3 |
6.7 |
|
|
77.0 |
| H2O/CO2 = 3 |
3.0 |
15.0 |
5.0 |
|
|
77.0 |
| H2O/CO2 = ∞ |
3.0 |
20.0 |
0.0 |
|
|
77.0 |
| MeOH SR |
S/C = 0.5 |
|
5.0 |
|
|
10.0 |
85.0 |
| S/C = 1.0 |
|
10.0 |
|
|
10.0 |
80.0 |
| DME SR |
S/C = 1.0 |
|
10.0 |
|
|
5.0 |
85.0 |
| S/C = 1.5 |
|
15.0 |
|
|
5.0 |
80.0 |
| DME POx |
O/C = 1.0 |
|
|
|
10.0 |
10.0 |
61.4 |
| O/C = 1.5 |
|
|
|
15.0 |
10.0 |
56.4 |
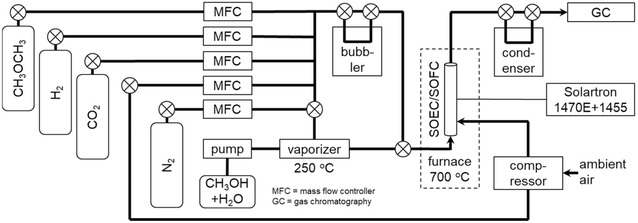 |
| | Fig. 2 Schematic of experimental setup for evaluation of co-electrolysis SOECs and internal reforming SOFCs. | |
3. Results and discussion
3.1 Co-electrolysis SOECs
Fig. 3 shows the equilibrium amounts of the product gases as a function of H2O + CO2 utilization at (a) H2O/CO2 = 0 and (b) H2O/CO2 = 2 at 700 °C. The input gases are 0.2 mol of H2O/CO2 and 0.03 mol of H2. The product amounts of the H2/CO mixtures are assumed to obey faradaic law. At H2O/CO2 = 0, carbon is deposited, when H2O + CO2 utilization exceeds 0.8. At low temperatures, carbon is easily deposited, even at lower H2O/CO2 ratios. Moreover, methane is slightly produced, when H2O + CO2 utilization is above 0.6 at H2O/CO2 = 2. When carbon and/or methane are not produced, the amounts of H2 and CO produced increase linearly with the H2O + CO2 utilization, and the H2/CO ratios of the product gases are identical to the H2O/CO2 ratios of the input gases. Co-electrolysis is desirable to be operated at high temperatures to prevent carbon and methane production.
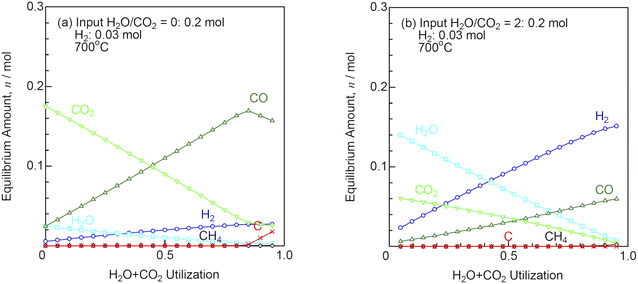 |
| | Fig. 3 Equilibrium amounts of the product gases as a function of H2O + CO2 utilization at (a) H2O/CO2 = 0 and (b) H2O/CO2 = 2 (input H2O/CO2: 0.2 mol, H2: 0.03 mol) at 700 °C. | |
Fig. 4 shows the I–V characteristics for co-electrolysis SOEC at various H2O/CO2 ratios and 700 °C. The flow rates of the input gases are listed in Table 1. The theoretical electromotive forces (EMFs) are 0.910, 0.906, 0.902, 0.899, 0.898, and 0.894 V at H2O/CO2 = 0, 1/3, 1, 2, 3, and ∞, respectively. The OCVs were 20–30 mV lower than the theoretical EMFs under all conditions, owing to slight gas leakage. The slopes of I–V curves increased with decreasing H2O/CO2 ratios. The H2O + CO2 utilizations were 0.27–0.32 under 1.28 V at H2O/CO2 = 0 − ∞. The performances during H2O/CO2 co-electrolysis and CO2 electrolysis were lower than that during steam electrolysis.12,13,15,16 The performance of the co-electrolysis SOEC decreased with increasing CO2 concentrations in the input gases.
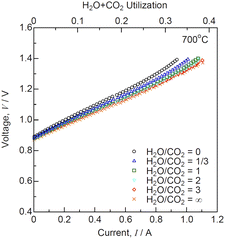 |
| | Fig. 4 Current–voltage characteristics for co-electrolysis SOEC at various H2O/CO2 ratios and 700 °C. | |
Fig. 5(a) and (b) show the Nyquist plots of impedance spectra for co-electrolysis SOEC under OCV and 1.28 V, respectively, at various H2O/CO2 ratios and 700 °C. The ohmic losses (R0) derived from the intersections of the impedance arcs at high frequencies with the real axis remained unchanged with the H2O/CO2 ratios. The ohmic losses under 1.28 V were slightly larger than those under OCV, because endothermic reaction of H2O/CO2 co-electrolysis decreased the local temperature at the interface between electrolyte and electrode. The polarization resistances at low frequencies below 10 Hz increased with decreasing H2O/CO2 ratios. DRT analysis was performed to deconvolute the impedance spectra as shown in Fig. 5(c) and (d). Six DRT peaks were observed under all the conditions, corresponding to the following physicochemical origins of the rate-determining elementary processes for negatrode-supported microtubular SOECs:36
 |
| | Fig. 5 (a and b) Impedance, (c and d) DRT spectra, and (e and f) resistances for co-electrolysis SOEC under (a, c and e) OCV and (b, d and f)1.28 V at various H2O/CO2 ratios and 700 °C. | |
P
1 (10–100 kHz): physical impedance originating from the grain boundaries, pores, and reaction products between the electrolyte and positrode
P
2, P3 (20 Hz–10 kHz): charge transfer and ionic conduction processes at the negatrode
P
4 (2–200 Hz): oxygen surface exchange and diffusion processes at the positrode
P
5, P6 (0.1–20 Hz): gas diffusion and nonstoichiometric oxygen variation processes at the Ni-GDC negatrode
Fig. 5(e) and (f) show the resistance against H2O/CO2 ratios derived from the CNLS fitting using the equivalent circuit model with a series connection of R0 and six RkCk (k = 1–6) elements. R5 and R6 increased with decreasing H2O/CO2 ratios. Graves et al.12 reported that the polarization resistance resulting from gas diffusion process at the negatrode increased at high CO2 concentrations. This suggests that the CO/CO2 mixture diffuses more difficultly than the H2/H2O mixture in the SOEC negatrode.
Syngas with an H2/CO ratio of 2 is desirable for methanol, DME, and FT syntheses. Therefore, a quantitative analysis of product gas compositions is important for the co-electrolysis SOEC evaluation. Table 2 shows the estimated flow rates of the product gases for co-electrolysis SOEC under equilibrium, OCV and 1.28 V using gas chromatography. The steam flow rates were estimated in consideration for mass balance of hydrogen, oxygen and carbon species assuming no carbon deposition. The faradaic law for electrolysis is as follows:
where
I is the current (A),
ṅ is the molar product rate (mol s
−1),
z is the valency of the ions (2), and
F is the faradaic constant (96
![[thin space (1/6-em)]](https://www.rsc.org/images/entities/char_2009.gif)
485C mol
−1). The ideal gas law is as follows:
| | p![[v with combining dot above]](https://www.rsc.org/images/entities/i_char_0076_0307.gif) = 60ṅRgT = 60ṅRgT | (7) |
where
p is the pressure (kPa),
![[v with combining dot above]](https://www.rsc.org/images/entities/i_char_0076_0307.gif)
is the flow rate of the product gas (L min
−1),
Rg is the gas constant (8.3145 J mol
−1 K
−1), and
T is the absolute temperature (K). In the standard state (
p = 101.325 kPa and
T = 273.15 K),
![[v with combining dot above]](https://www.rsc.org/images/entities/i_char_0076_0307.gif)
is derived from the following equation:
| | ![[v with combining dot above]](https://www.rsc.org/images/entities/i_char_0076_0307.gif) = 6.9652 × 10⁻³I = 6.9652 × 10⁻³I | (8) |
Table 2 Estimated flow rates (mL min−1) of the product gases for co-electrolysis SOEC under equilibrium, OCV, and 1.28 V using gas chromatography. The steam flow rates of the product gases were estimated in consideration for mass balance of hydrogen, oxygen and carbon species
| H2O/CO2 |
V
|
I
|
H2 |
H2O |
CO |
CO2 |
CH4 |
N2 |
| 0 |
Equilibrium |
0.543 |
2.46 |
2.46 |
17.5 |
1 × 10⁻⁶ |
77.0 |
| OCV |
0 A |
0.947 |
1.65 |
2.72 |
17.7 |
0 |
77.0 |
| 1.28 V |
0.770 A |
1.12 |
2.43 |
7.70 |
11.7 |
0 |
77.0 |
| 1/3 |
Equilibrium |
1.33 |
6.68 |
1.68 |
13.3 |
5 × 10⁻⁶ |
77.0 |
| OCV |
0 A |
1.58 |
6.74 |
1.21 |
13.5 |
0 |
77.0 |
| 1.28 V |
0.830 A |
3.13 |
5.33 |
5.51 |
9.03 |
0 |
77.0 |
| 1 |
Equilibrium |
1.98 |
11.0 |
1.02 |
8.98 |
6 × 10⁻⁶ |
77.0 |
| OCV |
0 A |
1.86 |
10.7 |
0.720 |
9.70 |
0 |
77.0 |
| 1.28 V |
0.871 A |
4.96 |
7.61 |
3.80 |
6.63 |
0 |
77.0 |
| 2 |
Equilibrium |
2.35 |
14.0 |
0.647 |
6.05 |
5 × 10⁻⁶ |
77.0 |
| OCV |
0 A |
2.13 |
13.4 |
0.538 |
6.91 |
0 |
77.0 |
| 1.28 V |
0.886 A |
6.22 |
10.0 |
2.44 |
4.31 |
0 |
77.0 |
| 3 |
Equilibrium |
2.53 |
15.5 |
0.469 |
4.53 |
4 × 10⁻⁶ |
77.0 |
| OCV |
0 A |
2.38 |
15.3 |
0.394 |
4.95 |
0 |
77.0 |
| 1.28 V |
0.902 A |
7.22 |
10.6 |
1.84 |
3.39 |
0 |
77.0 |
| ∞ |
Equilibrium |
3.00 |
20.0 |
0 |
0 |
0 |
77.0 |
| OCV |
0 A |
3.08 |
19.9 |
0 |
0 |
0 |
77.0 |
| 1.28 V |
0.909 A |
9.46 |
13.5 |
0 |
0 |
0 |
77.0 |
This indicates the production of approximately 7 mL min−1 of syngas per 1 A current. Under OCV, the equilibrium compositions differed from the input gas compositions owing to the reverse water gas shift reaction.
The differences between the equilibrium and measured gas flow rates were less than 1 mL min−1 under OCV. Under 1.28 V, the H2 + CO flow rates in the range of 5.15–6.38 mL min−1 increased, when the current was 0.770–0.909 A at H2O/CO2 = 0 − ∞. The faradaic efficiencies were 0.96–1, because carbon and methane were not produced in the H2O + CO2 utilizations ranges of 0.27–0.32. Fig. 6 shows the evolution rates of the product gases for co-electrolysis SOEC at various H2O/CO2 ratios and 700 °C. The H2/CO ratios of the product gases were almost the identical to the H2O/CO2 ratios of the input gases. CO2 electrolysis was slightly more difficult than steam electrolysis, because the polarization resistances increased with decreasing H2O/CO2 ratios as shown in Fig. 5. However, CO was produced via the reverse water gas shift reaction (eqn (9)) in addition to co-electrolysis. Thus, the product gas compositions easily reached equilibrium compositions.
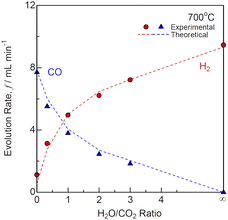 |
| | Fig. 6 Evolution rates of the product gases for co-electrolysis SOEC at various H2O/CO2 ratios and 700 °C. | |
The short-term durability test was performed under a constant voltage of 1.28 V at H2O/CO2 = 2 and 700 °C as shown in Fig. 7. Under 1.28 V, the initial current was 0.886 A, which decreased to 0.756 A after 100 h. The slope of the I–V curves increased, although the OCV remained unchanged during the durability test for 100 h. Fig. 8 shows the (a) impedance, (b) DRT spectra, and (c) resistances for co-electrolysis SOEC during the durability test under a constant voltage of 1.28 V at H2O/CO2 = 2 and 700 °C. The ohmic loss remained unchanged, whereas the polarization resistances at low frequencies below 10 Hz increased after 100 h. The DRT analysis suggested that R5 and R6 related to the gas diffusion process at the negatrode increased with time. The gas diffusion resistance should be decreased to improve durability in addition to the initial performance for co-electrolysis SOECs. Fig. 9 shows the evolution rates of the product gases during the durability test of the co-electrolysis SOEC under a constant voltage of 1.28 V at H2O/CO2 = 2 and 700 °C. The evolution rates of H2 and CO decreased with time, because the current decreased from 0.886 A to 0.756 A under 1.28 V after 100 h. The faradaic efficiency was remained above 0.95, confirming that the co-electrolysis SOEC produced syngas with a constant H2/CO ratio of 2. MeOH and DME syntheses from syngas have been industrially established. Internal reforming SOFCs using MeOH and DME are discussed in the next section.
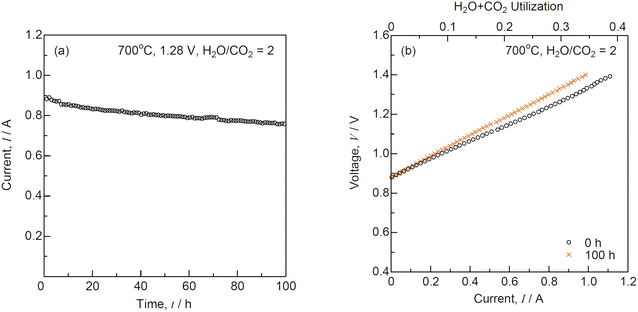 |
| | Fig. 7 (a) Time course of current under a constant voltage of 1.28 V and (b) current–voltage characteristics for co-electrolysis SOEC before and after the durability test at H2O/CO2 = 2 and 700 °C. | |
 |
| | Fig. 8 (a and b) Impedance, (c and d) DRT spectra, and (e) resistances for co-electrolysis SOEC during the durability test under a constant voltage of 1.28 V at H2O/CO2 = 2 and 700 °C. | |
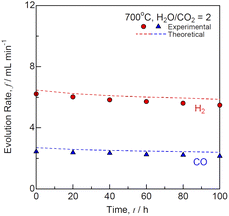 |
| | Fig. 9 Evolution rates of the product gases during the durability test of co-electrolysis SOEC under a constant voltage of 1.28 V at H2O/CO2 = 2 and 700 °C. | |
3.2 Internal reforming SOFCs
MeOH and DME are easily reformed at low temperatures. The conversion of MeOH and DME reaches 99% at 150 and 180 °C, respectively, in thermodynamic equilibrium. The stoichiometric reaction for MeOH decomposition is as follows:| | CH3OH → 2H2 + CO![[thin space (1/6-em)]](https://www.rsc.org/images/entities/char_2009.gif) ΔH25 °C = +90.5 kJ mol−1 ΔH25 °C = +90.5 kJ mol−1 | (10) |
Fig. 10(a) shows the equilibrium amounts of the reformate gases as a function of S/C ratio during steam reforming of MeOH at 700 °C. Steam is not required stoichiometrically for MeOH decomposition as shown in eqn (10). However, steam reforming is required to prevent carbon deposition, because carbon is deposited at S/C ratios below 0.3 in equilibrium. Internal reforming SOFCs can be easily supplied with 82 vol% (S/C = 0.5) or 69 vol% (S/C = 1.0) MeOH water solutions. Meanwhile, DME can be reformed using partial oxidation (eqn (12)) in addition to steam (eqn (11)).
| | CH3OCH3 + H2O → 4H2 + 2CO![[thin space (1/6-em)]](https://www.rsc.org/images/entities/char_2009.gif) ΔH25 °C = +205 kJ mol−1 ΔH25 °C = +205 kJ mol−1 | (11) |
| | CH3OCH3 + ½O2 → 3H2 + 2CO![[thin space (1/6-em)]](https://www.rsc.org/images/entities/char_2009.gif) ΔH25 °C = −37.0 kJ mol−1 ΔH25 °C = −37.0 kJ mol−1 | (12) |
 |
| | Fig. 10 Equilibrium amounts of the reformate gases as a function of S/C and O/C ratios for (a) steam reforming of MeOH, (b) steam reforming of DME, and (c) partial oxidation reforming of DME (input MeOH or DME: 1 mol) at 700 °C. | |
Fig. 10(b) and (c) show the equilibrium amounts of the reformate gases as a function of S/C and O/C ratios during steam reforming and partial oxidation reforming of DME at 700 °C. The stoichiometric S/C and O/C ratios are 0.5 for steam reforming and partial oxidation reforming of DME. However, carbon is deposited at S/C ratios <0.8 and O/C ratios <0.9 in equilibrium. The gas characteristics of DME are similar to those of LPG. Therefore, partial oxidation reforming can be easily performed by supplying DME/air mixture.
Fig. 11 shows the I–V characteristics for SOFCs during (a) steam reforming of MeOH, (b) steam reforming of DME, and (c) partial oxidation of DME before and after the durability tests at 700 °C. The theoretical EMFs, OCVs, and voltages at 0.3 A cm−2 are summarized in Table 3. Unfortunately, the flow rate of the reformate gases during internal reforming could not be determined using the setup as shown in Fig. 2, because water-soluble MeOH and DME were removed from the condenser. The OCVs were almost identical to the theoretical EMFs under all the conditions, suggesting that MeOH and DME were reformed into H2 and CO by steam and partial oxidation. The OCVs remained unchanged during the durability tests. The I–V characteristics were similar during internal reforming of MeOH and DME. Fig. 12 shows the time course of voltage for SOFCs during (a) steam reforming of MeOH, (b) steam reforming of DME, and (c) partial oxidation of DME during the durability test at a constant current density of 0.3 A cm−2 and 700 °C. Internal reforming SOFCs using MeOH and DME were continuously operated for 100 h. The degradation rates at different S/C ratios were almost the same during steam reforming of MeOH and DME, whereas the degradation rate at O/C = 1.0 was larger than that at O/C = 1.5 during partial oxidation reforming of DME. Previously, the voltage rapidly dropped during internal reforming of butane at O/C ≤1.0 and ethanol at S/C ≤1.5,4 although Ni-ceria based negatrodes exhibit high tolerance against carbon deposition.3,24 The voltage was stable during internal reforming of MeOH and DME, and no carbon deposition was detected at the Ni-GDC negatrode after the durability test. MeOH and DME contain C–O bonds but no C–C bonds, making carbon deposition difficult.25
 |
| | Fig. 11 Current–voltage characteristics for SOFCs during (a) steam reforming (SR) of MeOH, (b) SR of DME, and (c) partial oxidation reforming (POx) of DME before and after the durability tests at 700 °C. | |
Table 3 Theoretical EMFs, OCVs, voltages at 0.3 A cm−2, ohmic losses and total polarization resistances under OCV for SOFCs during steam reforming (SR) of MeOH, SR of DME, and partial oxidation reforming (POx) of DME before and after the durability test at a constant current density of 0.3 A cm−2 and 700 °C
|
|
MeOH SR |
DME SR |
DME POx |
| Ratio |
S/C = 0.5 |
S/C = 1.0 |
S/C = 1.0 |
S/C = 1.5 |
O/C = 1.0 |
O/C = 1.5 |
| Theoretical EMF |
1.04 V |
1.02 V |
1.04 V |
1.02 V |
1.03 V |
0.997 V |
| OCV |
1.05 V |
1.02 V |
1.05 V |
1.04 V |
1.05 V |
1.03 V |
|
V
0 h@0.3 A cm−2 |
0.764 V |
0.772 V |
0.758 V |
0.754 V |
0.777 V |
0.780 V |
|
V
100 h@0.3 A cm−2 |
0.749 V |
0.748 V |
0.734 V |
0.733 V |
0.730 V |
0.761 V |
|
R
0,0 h
|
0.182 Ω |
0.160 Ω |
0.200 Ω |
0.180 Ω |
0.184 Ω |
0.165 Ω |
|
R
0,100 h
|
0.182 Ω |
0.166 Ω |
0.202 Ω |
0.179 Ω |
0.186 Ω |
0.163 Ω |
|
R
p,0 h
|
0.114 Ω |
0.115 Ω |
0.114 Ω |
0.121 Ω |
0.122 Ω |
0.115 Ω |
|
R
p,100 h
|
0.137 Ω |
0.145 Ω |
0.151 Ω |
0.154 Ω |
0.162 Ω |
0.145 Ω |
 |
| | Fig. 12 Time courses of voltage for SOFCs during (a) steam reforming (SR) of MeOH, (b) SR of DME, and (c) partial oxidation reforming (POx) of DME during the durability test at a constant current density of 0.3 A cm−2 and 700 °C. | |
The impedance spectra before and after the durability tests at 700 °C are shown in Fig. 13. Table 3 lists the ohmic losses (R0) and total polarization resistances (Rp) before and after 100 h. The R0 values almost remained unchanged during the durability test, whereas those of Rp increased with time. The DRT analysis was performed to deconvolute the impedance spectra as shown in Fig. 14. Four DRT peaks corresponding to P2–P5 were detected under all the conditions. Fig. 15 shows the time course of the resistances derived from CNLS fitting using the equivalent circuit model with a series connection of R0 and four RkCk (k = 2–5) elements. The values of R3 and R5, which were ascribed to charge transfer and ionic conduction processes, and gas diffusion processes in the negatrode, respectively, increased with time. The DRT peaks of P3 and P5 shifted to lower frequencies as shown in Fig. 14. The gas diffusion resistance of the negatrode-supported microtubular cells used in this work was large, degrading the negatrode performance in charge transfer and gas diffusion processes during internal reforming of MeOH and DME. Thus, optimizing the negatrode microstructure is important for improving the initial performance and durability of co-electrolysis SOECs and internal reforming SOFCs.
 |
| | Fig. 13 Impedance spectra for SOFCs during (a and b) steam reforming (SR) of MeOH, (c and d) SR of DME, and (e and f) partial oxidation reforming (POx) of DME before and after the durability tests at 700 °C. | |
 |
| | Fig. 14 DRT spectra for SOFCs with (a and b) steam reforming (SR) of MeOH, (c and d) SR of DME, and (e and f) partial oxidation reforming (POx) of DME before and after the durability tests at 700 °C. | |
 |
| | Fig. 15 Time courses of resistances for SOFCs with (a and b) steam reforming (SR) of MeOH, (c and d) SR of DME, and (e and f) partial oxidation reforming (POx) of DME during the durability test at a constant current density of 0.3 A cm−2 and 700 °C. | |
3.3 Carbon-neutral energy system using co-electrolysis SOECs and internal reforming SOFCs
Fig. 16 shows a schematic of the carbon-neutral energy system using co-electrolysis SOECs and internal reforming SOFCs. CO2 is captured from the exhaust gas of plants and directly from the air (DAC).9–11 Renewable energy sources such as solar and wind power are supplied to consumers such as houses, buildings, and plants. The excess electric power is converted into chemical energy. Hydrogen is produced using SOECs in addition to alkaline and PEM electrolysis, and can be used in stationary fuel cells and fuel cell vehicles.7 Syngas is also produced using SOECs, and converted into MeOH and DME.20–22,28 Synthetic gasoline, kerosene, and diesel (e-fuel) are produced from syngas via FT synthesis, and can be used for airplanes, vessels, and large vehicles.18,19 Methanol can be converted into gasoline (MTG; methanol to gasoline), olefin (MTO; methanol to olefins) such as ethylene and propylene, and aromatics (MTA; methanol to aromatics) such as benzene, toluene, and xylene. MTO widely contributes to carbon-neutral manufacturing processes for commodity plastics (e-chemical), whereas the raw materials of engineering plastics such as polycarbonate and polyurethane are directly synthesized from CO2.41 MeOH is a liquid at ordinary temperatures and pressures, and DME is easily liquified at 0.6 MPa. Therefore, MeOH and DME are promising energy carriers and fuels for internal reforming SOFCs. Biomass is also used as a fuel in SOFCs after desulfurization and reforming. Although CO2 is exhausted from internal reforming SOFCs, it can be used for co-electrolysis SOECs. Mass and heat balance should be considered to achieve carbon neutrality. Thus, co-electrolysis SOECs and internal reforming SOFCs significantly contribute to achieving a carbon-neutral society.
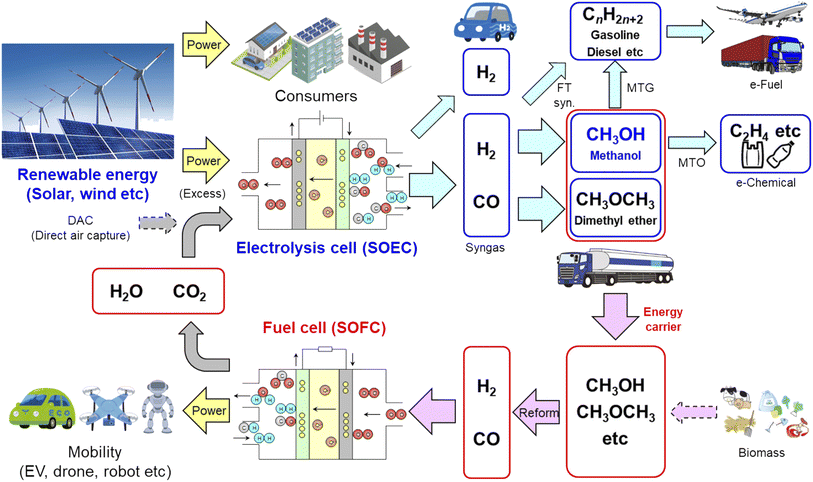 |
| | Fig. 16 Schematic of carbon-neutral energy system using co-electrolysis SOECs and internal reforming SOFCs. | |
4. Conclusion
In the present work, H2O/CO2 co-electrolysis SOECs and internal reforming SOFCs using MeOH and DME were investigated using negatrode-supported microtubular cells with the same cell configuration. The co-electrolysis performance decreased with increasing CO2 concentration in the input gas owing to an increase in polarization resistance related to gas diffusion process at the negatrode. The diffusion of CO/CO2 mixture was more difficult than that of H2/H2O mixture in the SOEC negatrode. The gas diffusion resistance increased with time during co-electrolysis SOECs at H2O/CO2 = 2 and 700 °C. At various H2O/CO2 ratios, the faradaic efficiencies exceeded 96%, and the H2/CO ratios of the product gases were almost identical to the H2O/CO2 ratios of the input gases. During the durability test at H2O/CO2 = 2, the faradaic efficiency and H2/CO ratio of the product gas were stable for 100 h.
MeOH and DME can be produced industrially from syngas with an H2/CO ratio of 2. The I–V characteristics were similar during internal reforming of MeOH and DME. The polarization resistances related to charge transfer and gas diffusion processes increased with time during internal reforming of MeOH and DME. Thus, the gas diffusion resistance should be decreased to improve the initial performance and durability of co-electrolysis SOECs and internal reforming SOFCs. In thermodynamic equilibrium, carbon is deposited at S/C <0.3 for MeOH, and at S/C <0.8 and O/C <0.9 for DME during steam and partial oxidation reforming, respectively. The internal reforming SOFCs successfully operated for 100 h at S/C ≥0.5 for MeOH, S/C ≥1.0 and O/C ≥1.0 for DME. Therefore, MeOH and DME syntheses from syngas via co-electrolysis SOECs and power generation via internal reforming SOFCs using MeOH and DME will contribute to achieving a carbon-neutral society.
Author contributions
Hirofumi Sumi: conceptualization, methodology, resources, data curation, investigation, writing – original draft preparation.
Conflicts of interest
There are no conflicts to declare.
References
- K. Eguchi, H. Kojo, T. Takeguchi, R. Kikuchi and K. Sasaki, Fuel Flexibility in Power Generation by Solid Oxide Fuel Cells, Solid State Ionics, 2002, 152–153, 411–416 CrossRef CAS.
- H. Sumi, K. Ukai, Y. Mizutani, H. Mori, C.-J. Wen, H. Takahashi and O. Yamamoto, Performance of Nickel-Scandia-Stabilized Zirconia Cermet Anodes for SOFCs in 3% H2O-CH4, Solid State Ionics, 2004, 174, 151–156 CrossRef CAS.
- H. Sumi, T. Yamaguchi, K. Hamamoto, T. Suzuki and Y. Fujishiro, Impact of Direct Butane Microtubular Solid Oxide Fuel Cells, J. Power Sources, 2012, 220, 74–78 CrossRef CAS.
- H. Sumi, T. Yamaguchi, H. Shimada, Y. Fujishiro and M. Awano, Internal Partial Oxidation Reforming of Butane and Steam Reforming of Ethanol for Anode-supported Microtubular Solid Oxide Fuel Cells, Fuel Cells, 2017, 17, 875–881 CrossRef CAS.
- H. Sumi, S. Nakabayashi, T. Kawada, Y. Uchiyama, N. Uchiyama and K. Ichihara, Demonstration of SOFC Power Sources for Drones (UAVs; Unmanned Aerial Vehicles), ECS Trans., 2019, 91(1), 149–157 CrossRef CAS.
- Y. Shiratori, T. Ijichi, T. Oshima and K. Sasaki, Internal Reforming SOFC Running on Biogas, Int. J. Hydrogen Energy, 2010, 35, 7905–7912 CrossRef CAS.
- S. A. Grigoriev, V. N. Fateev, D. G. Bessarabov and P. Millet, Current Status, Research Trends, and Challenges in Water Electrolysis Science and Technology, Int. J. Hydrogen Energy, 2020, 45, 26036–26058 CrossRef CAS.
- R. Küngas, Review-Electrochemical CO2 Reduction for CO Production: Comparison of Low- and High-temperature Electrolysis Technologies, J. Electrochem. Soc., 2020, 167, 044508 CrossRef.
- A. A. Olajire, CO2 Capture and Separation Technologies for End-of-pipe Applications - A Review, Energy, 2010, 35, 2610–2628 CrossRef CAS.
- F. Bisotti, K. A. Hoff, A. Mathisen and J. Hovland, Direct Air capture (DAC) Deployment: A Review of the Industrial Deployment, Chem. Eng. Sci., 2024, 283, 119416 CrossRef CAS.
- Y. Kohno, M. Kanakubo, M. Iwaya, Y. Yamato and T. Makino, Ionic Liquid Mixtures for Direct Air Capture: High CO2 Permeation Driven by Superior CO2 Absorption with Lower Absolute Enthalpy, ACS Omega, 2022, 7, 42155–42162 CrossRef CAS PubMed.
- C. Graves, S. D. Ebbesen and M. Mogensen, Co-electrolysis of CO2 and H2O in Solid Oxide Cells: Performance and Durability, Solid State Ionics, 2011, 192, 398–403 CrossRef CAS.
- S. D. Ebbesen, R. Knibbe and M. Mogensen, Co-electrolysis of Steam and Carbon Dioxide in Solid Oxide Cells, J. Electrochem. Soc., 2012, 159, F482–F489 CrossRef CAS.
- D. M. A. Duenas, M. Riedel, M. Riegraf, R. Costa and K. A. Friedrich, High Temperature Co-electrolysis for Power-to-X, Chem. Ing. Tech., 2020, 92, 45–52 CrossRef CAS.
- C. Xi, J. Sang, A. Wu, J. Yang, X. Qi, W. Guan, J. Wang and S. C. Singhal, Electrochemical Performance and Durability of Flat-tube Solid Oxide Electrolysis Cells for H2O/CO2 Co-electrolysis, J. Catal., 2021, 404, 174–186 CrossRef.
- E. Ioannidou, M. Chavani, S. G. Neophytides and D. K. Niakolas, Effect of the PH2O/PCO2 and PH2 on the Intrinsic Electro-catalytic Interactions and the CO Production Pathway on Ni/GDC during Solid Oxide H2O/CO2 Co-electrolysis, Int. J. Hydrogen Energy, 2022, 47, 10166–10174 CrossRef.
- C. Mebrahtu, M. Nohl, L. Dittrich, S. R. Foit, L. G. J. de Haart, R.-A. Eichel and R. Palkovits, Integrated Co-Electrolysis and Syngas Methanation for the Direct Production of Synthetic Natural Gas from CO2 and H2O, ChemSusChem, 2021, 14, 2295–2302 CrossRef CAS PubMed.
- M. E. Dry, The Fischer-Tropsch Process: 1950-2000, Catal. Today, 2002, 71, 227–241 CrossRef CAS.
- N. Koizumi, T. Mochizuki and M. Yamada, Preparation of Highly Active Catalysts for Ultra-clean Fuels, Catal. Today, 2009, 141, 34–42 CrossRef CAS.
- G. Bozzano and F. Manenti, Efficient Methanol Synthesis: Perspectives, Technologies and Optimization Strategies, Prog. Energy Combust. Sci., 2016, 56, 71–105 CrossRef.
- S. Mbatha, R. C. Everson, N. M. Musyoka, H. W. Langmi, A. Lanzini and W. Brilman, Power-to-methanol Process: A review of Electrolysis, Methanol Catalysts, Kinetics, Reactor Designs and Modelling, Process Integration, Optimisation, and Techno-economics, Sustain. Energy Fuels, 2021, 5, 3490–3569 RSC.
- Y. Choi, K. Futagami, T. Fujitani and J. Nakamura, The Difference in the Active Sites for CO2 and CO Hydrogenations on Cu/ZnO-based Methanol Synthesis Catalysts, Catal. Lett., 2001, 73, 27–31 CrossRef CAS.
- A. S. Arico, S. Srinivasan and V. Antonucci, DMFCs: From Fundamental Aspects to Technology Development, Fuel Cells, 2001, 1, 133–161 CrossRef CAS.
- T. Kim, K. Ahn, J. M. Vohs and R. J. Gorte, Deactivation of Ceria-based SOFC Anodes in Methanol, J. Power Sources, 2007, 164, 42–48 CrossRef CAS.
- M. Liu, R. Peng, D. Dong, J. Gao, X. Liu and G. Meng, Direct Liquid Methanol-fueled Solid Oxide Fuel Cell, J. Power Sources, 2008, 185, 188–192 CrossRef CAS.
- M. Lo Faro, A. Stassi, V. Antonucci, V. Modafferi, P. Frontera, P. Antonucci and A. S. Aricò, Direct Utilization of Methanol in Solid Oxide Fuel Cells: An Electrochemical and Catalytic Study, Int. J. Hydrogen Energy, 2011, 36, 9977–9986 CrossRef CAS.
- Z. Gao, R. Raza, B. Zhu and Z. Mao, Development of Methanol-fueled Low-temperature Solid Oxide Fuel Cells, Int. J. Energy Res., 2011, 35, 690–696 CrossRef CAS.
- K. Omata, Y. Watanabe, T. Umegaki, G. Ishiguro and M. Yamada, Low-pressure DME Synthesis with Cu-based Hybrid Catalysts using Temperature-gradient Reactor, Fuel, 2002, 81, 1605–1609 CrossRef CAS.
- S. Wang, T. Ishihara and Y. Takita, Dimethyl Ether Fueled Intermediate Temperature SOFC Using LaGaO3-Based Perovskite Electrolytes, Electrochem. Solid-State Lett., 2002, 5, A177–A180 CrossRef CAS.
- C. Su, W. Wang, H. Shi, R. Ran, H. J. Park, C. Kwak and Z. Shao, Reducing the Operation Temperature of a Solid Oxide Fuel Cell Using a Conventional Nickel-based Cermet Anode on Dimethyl Ether Fuel through Internal Partial Oxidation, J. Power Sources, 2011, 196, 7601–7608 CrossRef CAS.
- M. A. Laguna-Bercero, Recent Advances in High Temperature Electrolysis using Solid Oxide Fuel Cells: A Review, J. Power Sources, 2012, 203, 4–16 CrossRef CAS.
- K. Hosoi, H. Hagiwara, S. Ida and T. Ishihara, La0.8Sr0.2FeO3-δ as Fuel Electrode for Solid Oxide Reversible Cells Using LaGaO3-Based Oxide Electrolyte, J. Phys. Chem. C, 2016, 120, 16110–16117 CrossRef CAS.
- H. Uchida, H. Nishino, P. Puengjinda and K. Kakinuma, Remarkably Improved Durability of Ni-Co Dispersed Samaria-Doped Ceria Hydrogen Electrodes by Reversible Cycling Operation of Solid Oxide Cells, J. Electrochem. Soc., 2020, 167, 134516 CrossRef CAS.
- H. Schichlein, A. C. Muller, M. Voigts, A. Krugel and E. Ivers-Tiffée, Deconvolution of Electrochemical Impedance Spectra for the Identification of Electrode Reaction Mechanisms in Solid Oxide Fuel Cells, J. Appl. Electrochem., 2002, 32, 875–882 CrossRef CAS.
- A. Leonide, B. Rüger, A. Weber, W. A. Meulenberg and E. Ivers-Tiffée, Evaluation and Modeling of the Cell Resistance in Anode-supported Solid Oxide Fuel Cells, J. Electrochem. Soc., 2010, 157, B234–B239 CrossRef CAS.
- H. Sumi, H. Shimada, Y. Yamaguchi, T. Yamaguchi and Y. Fujishiro, Degradation Evaluation by Distribution of Relaxation Times Analysis for Microtubular Solid Oxide Fuel Cells, Electrochim. Acta, 2020, 339, 135913 CrossRef CAS.
- J. Weese, A Reliable and Fast Method for the Solution of Fredhol Integral Equations of the First Kind Based on Tikhonov Regularization, Comput. Phys. Commun., 1992, 69, 99–111 CrossRef.
- E. Ivers-Tiffée and A. Weber, Evaluation of Electrochemical Impedance Spectra by the Distribution of Relaxation Times, J. Ceram. Soc. Jpn., 2017, 125, 193–201 CrossRef.
- B. A. Boukamp, A Linear Kronig-Kramers Transform Test for Immittance Data Validation, J. Electrochem. Soc., 1995, 142, 1885–1894 CrossRef CAS.
- M. Schönleber, D. Klotz and E. Ivers-Tiffée, A Method for Improving the Robustness of Linear Kramers-Kronig Validity Tests, Electrochim. Acta, 2014, 131, 20–27 CrossRef.
- W. S. Putro, A. Ikeda, S. Shigeyasu, S. Hamura, S. Matsumoto, V. Y. Lee, J.-C. Choi and N. Fukaya, Sustainable Catalytic Synthesis of Diethyl Carbonate, ChemSusChem, 2021, 14, 842–846 CrossRef CAS PubMed.
|
| This journal is © The Royal Society of Chemistry 2024 |
Click here to see how this site uses Cookies. View our privacy policy here.  Open Access Article
 *
*


![[thin space (1/6-em)]](https://www.rsc.org/images/entities/char_2009.gif) 485C mol−1). The ideal gas law is as follows:
485C mol−1). The ideal gas law is as follows:![[v with combining dot above]](https://www.rsc.org/images/entities/i_char_0076_0307.gif) = 60ṅRgT
= 60ṅRgT![[v with combining dot above]](https://www.rsc.org/images/entities/i_char_0076_0307.gif) is the flow rate of the product gas (L min−1), Rg is the gas constant (8.3145 J mol−1 K−1), and T is the absolute temperature (K). In the standard state (p = 101.325 kPa and T = 273.15 K),
is the flow rate of the product gas (L min−1), Rg is the gas constant (8.3145 J mol−1 K−1), and T is the absolute temperature (K). In the standard state (p = 101.325 kPa and T = 273.15 K), ![[v with combining dot above]](https://www.rsc.org/images/entities/i_char_0076_0307.gif) is derived from the following equation:
is derived from the following equation:![[v with combining dot above]](https://www.rsc.org/images/entities/i_char_0076_0307.gif) = 6.9652 × 10⁻³I
= 6.9652 × 10⁻³I


![[thin space (1/6-em)]](https://www.rsc.org/images/entities/char_2009.gif) ΔH25 °C = +90.5 kJ mol−1
ΔH25 °C = +90.5 kJ mol−1![[thin space (1/6-em)]](https://www.rsc.org/images/entities/char_2009.gif) ΔH25 °C = +205 kJ mol−1
ΔH25 °C = +205 kJ mol−1![[thin space (1/6-em)]](https://www.rsc.org/images/entities/char_2009.gif) ΔH25 °C = −37.0 kJ mol−1
ΔH25 °C = −37.0 kJ mol−1


