Utilization of CO2-captured poly(allylamine) as a polymer surfactant for nanoarchitecture production in a closed CO2 cycle†
Received
10th March 2024
, Accepted 3rd May 2024
First published on 6th May 2024
Abstract
Intensified global warming, due to increased atmospheric CO2, is an urgent worldwide issue. To reduce atmospheric CO2 concentrations, various absorbents have been developed for its effective capture and storage. However, the CO2 stores could become another form of waste unless they are utilized as valuable materials. This study focuses on the utilization of a CO2-captured absorbent as a surfactant to produce nanoarchitectures in a closed loop of the CO2 cycle. Poly(allylamine) (PAA) effectively captured carbonic acid (CA) in an aqueous medium upon the introduction of gaseous CO2, loading the ammonium bicarbonate onto the side chains. The molecular weight of PAA showed no significant difference in its ability and efficiency to capture CA. The CA-captured PAA released the CA at room temperature upon introducing N2 due to the transformation of the bicarbonate into carbamate – a process that was reversible and repeatable with alternating introductions of CO2 and N2. The CA-captured PAA was converted into a polymer surfactant through the partial ion exchange of the bicarbonate with sodium dodecyl sulfate (SDS). At concentrations below the SDS critical micelle concentration (CMC), the surfactant self-assembled into monodisperse nanospheres, which transformed into worm-like morphologies upon increasing the polymer concentration. The utilization of the CO2 store, in this study employing ion exchange, involves releasing bicarbonate, which is recyclable as a CO2 source. This CO2 capture-storage-utilization in a closed loop shows promise in diminishing CO2 emissions.
Sustainability spotlight
To address accelerated global warming, effective CO2 storage and its utilization are crucial for reducing CO2 emissions. Although much attention has been paid to improving the CO2 capacity and regenerability of absorbents, this study focuses not only on the effective capture of CO2 as carbonic acid but also on the utilization of the CO2-captured absorbent for a surfactant that produces nanoarchitectures. The breakthrough in CO2 storage lies in utilizing the CO2 stores in its closed loop employing simple ion exchange, which facilitates industrial innovations in CO2 utilization and promises to diminish CO2 emissions. This study particularly emphasizes its alignment with SDG 13 (Climate Action), SDG 14 (Life Below Water), and SDG 9 (Industry, Innovation, and Infrastructure).
|
Introduction
Accelerated CO2 concentrations have been exacerbating global warming.1,2 The rise in global temperatures, due to increased CO2 emissions, has generated heatwaves, leading to destructive droughts and extensive wildfires.3 These frequent wildfires have further increased CO2 emissions, creating a vicious cycle of warming. A rise in ocean temperatures has caused sea levels to rise by melting ice sheets,4–7 resulting in the reduction of terrestrial habitats8,9 and changes in marine ecosystems.10–13 These environmental changes have led to significant losses in biodiversity13,14 and impacts on the global economy.15,16 If CO2 emissions continue to increase at the current rate, it is anticipated that the global temperatures will rise at an even more accelerated pace by 2035,2 which will lead to further environmental, ecological and economic damage.
To reduce atmospheric CO2, numerous efforts employing various innovative methods have been made, including the reduction of CO2 through photochemical,17–19 electrochemical20–23 and biological approaches24 into valuable compounds such as formic acid, formaldehyde, methanol and hydrocarbons; the co-reduction with nitrate to produce urea;25 the incorporation of CO2 into polymer main chains via copolymerization;26–28 and composting with biomass.29,30 These methods offer new avenues for fixing CO2 and producing materials composed of it. However, these methods have not yet been effective enough to significantly reduce atmospheric CO2 concentrations.
Currently, carbon capture and storage (CCS) technology, including direct air capture,31 is the most promising approach to address global warming.32,33 CCS involves three distinct processes: capturing CO2, compressing it for transportation and injecting it deep underground for its permanent storage in a dense phase under high pressure.34 Efficient CO2 absorption and subsequent desorption to regenerate the absorbents are crucial for executing all these processes in an energy-efficient manner. Numerous systems for CO2 absorption and desorption have been developed to improve CO2 capacity, absorbent regenerability, cyclic stability and durability. These systems involve the use of physical35–37 or chemical solvent dissolving absorbents,38 solid absorbents,39–41 gas separation membranes,42–45 calcium looping46,47 and inherent CO2 trapping.48 The chemical solvent-based systems are convenient, widely available, easily prepared and well-studied for CCS. Various amines for the chemical solvents have been designed and fabricated to enhance the performance of CO2 absorption and desorption.38,49–52 The performance often depends on the amine class and its CO2 absorption mechanism; tertiary amines simply undergo an acid–base reaction with CO2 to produce their ammonium bicarbonate or carbonate due to the lack of hydrogen atoms in the amino group.53,54 On the other hand, primary and secondary amines covalently bond with CO2 to form the ammonium carbamate, which often requires a much higher temperature to release the CO2.55–57
PAA is an effective CO2 absorbent and offers many advantages over low-molecular-weight amines, including non-volatility, high CO2 capacity,58 thermal stability,33 resistance to oxidative degradation,59 durability against high-pressure gas streams38 and low regeneration energy.60 Regarding thermal stability and resistance to oxidative degradation,61–64 PAA, which is loaded with primary amines on its side chains, is more suitable for CO2 sorption than poly(ethylenimine) (PEI) that incorporates secondary amines in its main chain, although PAA is less effective in CO2 adsorption capacity and amine efficiency than PEI.65 Additionally, the commercial availability and easy modifiability of PAA allow for broad design and conversion into unique materials,66 including not only CO2 absorbents67,68 but also polymer surfactants69 and biocompatible polymers for medical use.70 Material design aimed at replacing existing functional materials with PAA that has stored CO2, facilitates industrial utilization of CO2-captured absorbents. Utilizing CO2 stores is environmentally significant because allowing them to increase without utilization could cause additional pollution from the CO2 stores, further contributing to global environmental degradation.
With the aim of effectively utilizing CO2-captured absorbents, this study demonstrated the efficient capture of CO2 as carbonic acid (CA) using PAA, followed by the sequential use of the CO2-captured PAA as a polymer surfactant to produce nanoarchitectures. This paper describes the reversible capture and release of CA by PAA and the conversion of the CA-captured PAA into a polymer surfactant that self-assembles into nanoarchitectures through ion exchange.
Experimental
Instrumentation
Electroconductivity (EC) and pH were measured using a Hanna Instruments HI99300N portable EC/TDS/°C meter and a HI991002N portable pH/ORP/°C meter, respectively. 1H and 13C NMR measurements were conducted using Jeol ECS500 and ECS400 FT NMR spectrometers. The viscosity was measured at 25 °C using an A&D SV-10 vibro viscometer equipped with an Eyela digital Uni Ace UA-100 temperature circulator. UV spectra were obtained at 25 °C using a Shimadzu UV-160A UV-Vis recording spectrophotometer, equipped with an Eyela NCB-1200 temperature circulator. FT-IR spectra were obtained using a Jasco FT/IR-4100 Fourier transform infrared spectrometer. Light scattering measurements were performed at 25 °C with a Photal Otsuka Electronics ELS-8000 electrophoretic light scattering spectrophotometer, equipped with a system controller, an ELS controller and a He–Ne laser operating at λ = 632.8 nm.
Materials
PAAs with weight-average molecular weights (Mw) of 1600, 5000 and 15![[thin space (1/6-em)]](https://www.rsc.org/images/entities/char_2009.gif) 000 were supplied by Nittobo Co., Ltd as their aqueous solutions; 15 wt% solutions for PAAs with Mw = 1600 and 15
000 were supplied by Nittobo Co., Ltd as their aqueous solutions; 15 wt% solutions for PAAs with Mw = 1600 and 15![[thin space (1/6-em)]](https://www.rsc.org/images/entities/char_2009.gif) 000, and a 20 wt% solution for that with Mw = 5000. Poly(allylamine hydrochloride) (PAH-Cl), with Mw = 1600, 5000 and 15
000, and a 20 wt% solution for that with Mw = 5000. Poly(allylamine hydrochloride) (PAH-Cl), with Mw = 1600, 5000 and 15![[thin space (1/6-em)]](https://www.rsc.org/images/entities/char_2009.gif) 000, was also supplied by Nittobo Co., Ltd as aqueous solutions; a 34 wt% solution for Mw = 1600, 40 wt% solution for Mw = 5000 and 50 wt% solution for Mw = 15
000, was also supplied by Nittobo Co., Ltd as aqueous solutions; a 34 wt% solution for Mw = 1600, 40 wt% solution for Mw = 5000 and 50 wt% solution for Mw = 15![[thin space (1/6-em)]](https://www.rsc.org/images/entities/char_2009.gif) 000. 1,6-Diaminohexane (DA-Hex), purchased from Tokyo Chemical Industry, was purified by distillation over calcium hydride under reduced pressure. Ammonium bicarbonate, ammonium carbonate and ammonium carbamate were purchased from Sigma-Aldrich and used as received. Sodium dodecyl sulfate (SDS), purchased from Kishida Chemical, and sodium ethyl sulfate (SES), obtained from Tokyo Chemical Industry, were used as received. Ultrapure water was obtained using a Merck Milli-Q® Integral MT-5 water purification system. CO2 with over 99.995% vol purity and N2 with over 99.9995% vol purity were purchased from Taiyo Nippon Sanso Corporation.
000. 1,6-Diaminohexane (DA-Hex), purchased from Tokyo Chemical Industry, was purified by distillation over calcium hydride under reduced pressure. Ammonium bicarbonate, ammonium carbonate and ammonium carbamate were purchased from Sigma-Aldrich and used as received. Sodium dodecyl sulfate (SDS), purchased from Kishida Chemical, and sodium ethyl sulfate (SES), obtained from Tokyo Chemical Industry, were used as received. Ultrapure water was obtained using a Merck Milli-Q® Integral MT-5 water purification system. CO2 with over 99.995% vol purity and N2 with over 99.9995% vol purity were purchased from Taiyo Nippon Sanso Corporation.
CO2 capture by PAA; general procedure
Ultrapure water (20 mL) was poured into PAA with Mw = 15![[thin space (1/6-em)]](https://www.rsc.org/images/entities/char_2009.gif) 000 (10.161 g as a 15 wt% solution containing 1.524 g (26.7 mmol) of the allylamine unit, AA, and 8.637 g of water), resulting in an initial AA concentration of [AA]0 = 0.932 mol L−1. CO2 was introduced by bubbling at a flow rate of 300 mL min−1, using a flow meter, into the solution contained in a 50 mL round-bottom flask situated in a water bath maintained at 25 °C, with stirring. The pH of the solution was measured at designated times. At these times, a portion of the solution (1 mL) was extracted using a syringe and diluted with water (14 mL) to facilitate an EC measurement, owing to the upper limitation of the EC meter.
000 (10.161 g as a 15 wt% solution containing 1.524 g (26.7 mmol) of the allylamine unit, AA, and 8.637 g of water), resulting in an initial AA concentration of [AA]0 = 0.932 mol L−1. CO2 was introduced by bubbling at a flow rate of 300 mL min−1, using a flow meter, into the solution contained in a 50 mL round-bottom flask situated in a water bath maintained at 25 °C, with stirring. The pH of the solution was measured at designated times. At these times, a portion of the solution (1 mL) was extracted using a syringe and diluted with water (14 mL) to facilitate an EC measurement, owing to the upper limitation of the EC meter.
Isolation of CA-captured PAA
The solution of CA-captured PAA with Mw = 15![[thin space (1/6-em)]](https://www.rsc.org/images/entities/char_2009.gif) 000, obtained by the procedure mentioned above using 3.010 g of PAA (as a 15 wt% solution containing 7.91 mmol of AA) and 5.9 mL of water with CO2 introduced for 30 min, was freeze-dried for 1 h at room temperature, followed by 3.5 h at 25 °C in a water bath, resulting in a white powder (0.910 g) with a 97% yield based on the bicarbonate. Following the same procedure, PAA with Mw = 5000 (2.253 g as a 20 wt% solution containing 7.89 mmol of AA) and 6.6 mL of water produced a powder (0.818 g) with an 87% yield. Similarly, PAA with Mw = 1600 (3.004 g as a 15 wt% solution containing 7.89 mmol of AA) and 5.9 mL of water resulted in a powder (0.888 g) with a 94% yield.
000, obtained by the procedure mentioned above using 3.010 g of PAA (as a 15 wt% solution containing 7.91 mmol of AA) and 5.9 mL of water with CO2 introduced for 30 min, was freeze-dried for 1 h at room temperature, followed by 3.5 h at 25 °C in a water bath, resulting in a white powder (0.910 g) with a 97% yield based on the bicarbonate. Following the same procedure, PAA with Mw = 5000 (2.253 g as a 20 wt% solution containing 7.89 mmol of AA) and 6.6 mL of water produced a powder (0.818 g) with an 87% yield. Similarly, PAA with Mw = 1600 (3.004 g as a 15 wt% solution containing 7.89 mmol of AA) and 5.9 mL of water resulted in a powder (0.888 g) with a 94% yield.
Release of CA from the CA-captured PAA by N2 introduction
A solution ([AA]0 = 0.932 mol L−1) of CA-captured PAA was prepared using 5.078 g of PAA with Mw = 15![[thin space (1/6-em)]](https://www.rsc.org/images/entities/char_2009.gif) 000 (as a 15 wt% solution containing 13.3 mmol of AA) and 10 mL of water, by introducing CO2 for 1 h. N2 was then introduced into the solution with stirring at a flow rate of 300 mL min−1 for 1 h, after which the solution was subjected to NMR measurements.
000 (as a 15 wt% solution containing 13.3 mmol of AA) and 10 mL of water, by introducing CO2 for 1 h. N2 was then introduced into the solution with stirring at a flow rate of 300 mL min−1 for 1 h, after which the solution was subjected to NMR measurements.
Ion exchange of the CA-captured PAA with SDS
A solution of CA-captured PAA was prepared using PAA with Mw = 15![[thin space (1/6-em)]](https://www.rsc.org/images/entities/char_2009.gif) 000 (283.0 mg as a 15 wt% solution containing 0.744 mmol of AA) and 207 mL of water, with CO2 introduced for 30 min. The solution was then divided into 20 mL sample bottles in 10 mL portions while under the CO2 flow. SDS (103.7 mg, 0.360 mmol) was dissolved in 10 mL of water to prepare a solution with a concentration of 3.60 × 10⁻² mol L−1. Next, the SDS solution (0.1 mL, 3.60 × 10⁻³ mmol) was added to the CA-captured PAA solution (10 mL, 3.59 × 10⁻² mmol) with stirring on a water bath at 25 °C. The resulting mixture, with a molar ratio of SDS/AA = 0.1, was subjected to UV and light scattering measurements at 25 °C. Following the same procedure, mixtures with other ratios were prepared using the designated amounts of the SDS solution. Light scattering measurements were performed at an angle θ = 90°. The hydrodynamic diameter (Dh) of the polymer was determined using cumulant analysis, while the number conversion distribution of the Dh was obtained using Marquadt analysis.71
000 (283.0 mg as a 15 wt% solution containing 0.744 mmol of AA) and 207 mL of water, with CO2 introduced for 30 min. The solution was then divided into 20 mL sample bottles in 10 mL portions while under the CO2 flow. SDS (103.7 mg, 0.360 mmol) was dissolved in 10 mL of water to prepare a solution with a concentration of 3.60 × 10⁻² mol L−1. Next, the SDS solution (0.1 mL, 3.60 × 10⁻³ mmol) was added to the CA-captured PAA solution (10 mL, 3.59 × 10⁻² mmol) with stirring on a water bath at 25 °C. The resulting mixture, with a molar ratio of SDS/AA = 0.1, was subjected to UV and light scattering measurements at 25 °C. Following the same procedure, mixtures with other ratios were prepared using the designated amounts of the SDS solution. Light scattering measurements were performed at an angle θ = 90°. The hydrodynamic diameter (Dh) of the polymer was determined using cumulant analysis, while the number conversion distribution of the Dh was obtained using Marquadt analysis.71
FE-SEM observations
The CA-captured PAA solution ([AA]0 = 3.59 × 10⁻³ mol L−1) and SDS solution (3.60 × 10⁻² mol L−1) were used. The SDS solution (0.26 mL, 9.38 × 10⁻³ mmol) was added to the CA-captured PAA solution (5.2 mL containing 1.87 × 10⁻² mmol of AA) at 25 °C on a water bath, with stirring. The mixture ([AA] = 3.42 × 10⁻³ mol L−1) was maintained at 25 °C with stirring for 5 min, and then left to stand at 25 °C for an additional 5 min. A drop of the mixture, thus prepared, was placed onto a cover glass (18 × 18 mm) and then put in an oven set at 25 °C for drying. The aggregates on the cover glass were subjected to FE-SEM measurements at 0.7 kV without coating. Morphologies and sizes of the aggregates were determined by the FE-SEM observations, while the size distribution was calculated as previously reported.72
Results and discussion
CO2 capture and release by PAA
To control the reversible capture and release of CO2 by PAA, the ability to capture CA in an aqueous medium was evaluated using pH and EC variability. As gaseous CO2 was introduced by bubbling into an aqueous solution of PAA (Mw = 15![[thin space (1/6-em)]](https://www.rsc.org/images/entities/char_2009.gif) 000), the solution immediately turned opaque within a few seconds, then gradually became clear and completely homogeneous in 5 min. During the very early stage, a slight amount of the ammonium carbamate and carbonate,73,74 which are in equilibrium,75 electrostatically cross-links the polymer chains, causing gelation; however, the gel is disrupted by further capture of CA (Fig. 1). This reasoning agrees with the mechanism of reactions between CO2 and aqueous ammonia, which is based on substance stability as inferred from their reaction enthalpies.76,77 Ammonia (NH3) initially reacts with gaseous CO2 to produce ammonium carbamate, NH2COONH4 (eqn (1)). This compound then converts into ammonium carbonate, (NH4)2CO3, in the presence of water (eqn (2)).
000), the solution immediately turned opaque within a few seconds, then gradually became clear and completely homogeneous in 5 min. During the very early stage, a slight amount of the ammonium carbamate and carbonate,73,74 which are in equilibrium,75 electrostatically cross-links the polymer chains, causing gelation; however, the gel is disrupted by further capture of CA (Fig. 1). This reasoning agrees with the mechanism of reactions between CO2 and aqueous ammonia, which is based on substance stability as inferred from their reaction enthalpies.76,77 Ammonia (NH3) initially reacts with gaseous CO2 to produce ammonium carbamate, NH2COONH4 (eqn (1)). This compound then converts into ammonium carbonate, (NH4)2CO3, in the presence of water (eqn (2)).
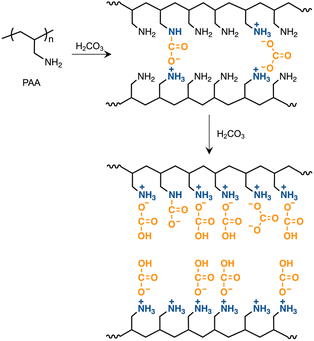 |
| | Fig. 1 Gelation of PAA by the carbamate/carbonate generation. | |
As CO2 reacts with water to generate carbonic acid (CA), NH3 captures the CA to produce ammonium carbonate (eqn (3)) and ammonium bicarbonate, NH4HCO3 (eqn (4)). The bicarbonate further converts into ammonium carbamate by reacting with remaining ammonia (eqn (5)). With the introduction of additional CO2, increasing the concentration of CA, the ammonium carbonate and carbamate eventually convert into ammonium bicarbonate (eqn (6) and (7)). All these reactions are in equilibrium; however, the forward reactions are preferred because the products are more stable than the starting substances, achieving reduced energy levels by releasing heat. The transition from ammonium carbamate to bicarbonate via carbonate agrees with the phase diagram of the CO2–NH3–H2O system.78
| | | 2NH3 + CO2 ⇄ NH2COONH4, ΔHrx = −72.32 kJ mol−1 | (1) |
| | | NH2COONH4 + H2O ⇄ (NH4)2CO3, ΔHrx = −28.90 kJ mol−1 | (2) |
| | | 2NH3 + CO2 + H2O ⇄ (NH4)2CO3, ΔHrx = −101.22 kJ mol−1 | (3) |
| | | NH3 + CO2 + H2O ⇄ NH4HCO3, ΔHrx = −64.26 kJ mol−1 | (4) |
| | | NH4HCO3 + NH3 ⇄ NH2COONH4, ΔHrx = −8.06 kJ mol−1 | (5) |
| | | (NH4)2CO3 + CO2 + H2O ⇄ 2NH4HCO3, ΔHrx = −26.88 kJ mol−1 | (6) |
| | | NH2COONH4 + CO2 + 2H2O ⇄ 2NH4HCO3, ΔHrx = −56.20 kJ mol−1 | (7) |
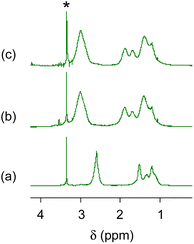
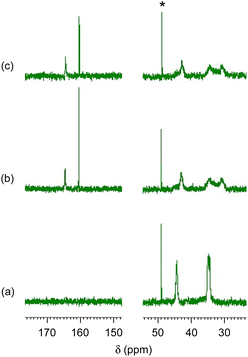
Fig. 2 and 3 show 1H and 13C NMR spectra, respectively, for the CA-captured PAA. The proton signal at 2.60 ppm (Fig. 2a) for the methylene attached to the amino group shifted to 2.96 ppm (Fig. 2b) due to the protonation of the amino group by CA. In 13C NMR, the bicarbonate (HCO3−) was confirmed at 160.4 ppm (Fig. 3b and S1†),54,79 coexisting with a small amount of the carbamate (NH2COO−) detected at 164.5 ppm. Isolating the CA-captured PAA by freeze-drying reduced the intensity of the bicarbonate signal, suggesting a partial release of the CA under reduced pressure during freeze-drying (Fig. 3c), transforming the bicarbonate into carbonate. However, the PAA remains in the ammonium form based on no change in 1H NMR (Fig. 2c), implying that the PAA retained the CA even in its solid state. FT-IR verified the presence of bicarbonate, carbonate and carbamate in the isolated PAA. As can be seen in Fig. 4, the PAA showed four characteristic absorptions at 1640, 1567, 1486 and 1439 cm−1, which are attributed to C–O/C![[double bond, length as m-dash]](https://www.rsc.org/images/entities/char_e001.gif) O stretching. Ammonium carbamate exhibited these absorptions at 1630, 1543, 1459 and 1406 cm−1. These absorptions overlapped with those of bicarbonate/carbonate C–O/C
O stretching. Ammonium carbamate exhibited these absorptions at 1630, 1543, 1459 and 1406 cm−1. These absorptions overlapped with those of bicarbonate/carbonate C–O/C![[double bond, length as m-dash]](https://www.rsc.org/images/entities/char_e001.gif) O stretching, since ammonium bicarbonate and ammonium carbonate had absorptions at 1604 and 1605 cm−1, respectively. However, the PAA exhibited absorption at 2575 cm−1, originating from the N–H stretching of the ammonium cation (–NH3+) with a bicarbonate or carbonate counter anion, while ammonium bicarbonate showed it at 2590 cm−1 and ammonium carbonate also at 2590 cm−1.
O stretching, since ammonium bicarbonate and ammonium carbonate had absorptions at 1604 and 1605 cm−1, respectively. However, the PAA exhibited absorption at 2575 cm−1, originating from the N–H stretching of the ammonium cation (–NH3+) with a bicarbonate or carbonate counter anion, while ammonium bicarbonate showed it at 2590 cm−1 and ammonium carbonate also at 2590 cm−1.
 |
| | Fig. 2
1H NMR spectra. (a) PAA with Mw = 15![[thin space (1/6-em)]](https://www.rsc.org/images/entities/char_2009.gif) 000, (b) the CA-captured PAA in solution after CO2 introduction for 1 h and (c) the CA-captured PAA isolated. Solvent: D2O. *CH3OH standard. 000, (b) the CA-captured PAA in solution after CO2 introduction for 1 h and (c) the CA-captured PAA isolated. Solvent: D2O. *CH3OH standard. | |
 |
| | Fig. 3
13C NMR spectra. (a) PAA with Mw = 15![[thin space (1/6-em)]](https://www.rsc.org/images/entities/char_2009.gif) 000, (b) the CA-captured PAA in solution after CO2 introduction for 1 h and (c) the CA-captured PAA isolated. Solvent: D2O. *CH3OH standard. 000, (b) the CA-captured PAA in solution after CO2 introduction for 1 h and (c) the CA-captured PAA isolated. Solvent: D2O. *CH3OH standard. | |
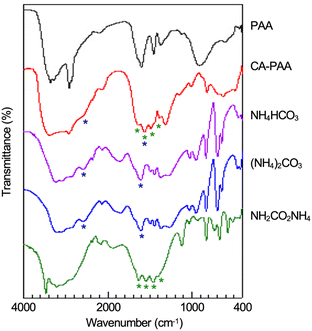 |
| | Fig. 4 FT-IR spectra of PAA (Mw = 15![[thin space (1/6-em)]](https://www.rsc.org/images/entities/char_2009.gif) 000), isolated CA-captured PAA (CA-PAA), ammonium bicarbonate, ammonium carbonate and ammonium carbamate. 000), isolated CA-captured PAA (CA-PAA), ammonium bicarbonate, ammonium carbonate and ammonium carbamate. | |
The capture of CA charges PAA, producing its polyelectrolyte. Fig. 5 shows variations in EC and pH upon introducing CO2 into solutions of PAAs with different molecular weights (Mw = 1600, 5000 and 15![[thin space (1/6-em)]](https://www.rsc.org/images/entities/char_2009.gif) 000). The introduction of CO2 initially caused a decrease in EC due to the temporary gelation; thereafter, the EC increased with the duration of CO2 exposure and reached steady states. During the CO2 introduction, the PAAs showed no difference in pH variability, suggesting no difference in their ability and efficiency to capture CA. However, the steady-state EC value linearly decreased with the logarithm of the molecular weight (log
000). The introduction of CO2 initially caused a decrease in EC due to the temporary gelation; thereafter, the EC increased with the duration of CO2 exposure and reached steady states. During the CO2 introduction, the PAAs showed no difference in pH variability, suggesting no difference in their ability and efficiency to capture CA. However, the steady-state EC value linearly decreased with the logarithm of the molecular weight (log![[thin space (1/6-em)]](https://www.rsc.org/images/entities/char_2009.gif) Mw) (Fig. 6a). The decrease in EC with the increased molecular weight was attributed to the increased viscosity of the electrolyte solution. The restriction of molecular movement by binding the amino groups to the high-molecular-weight polymer chain reduced the EC. This inverse correlation of EC with the molecular weight is characteristic of polyelectrolytes, as evidenced by PAH-Cl, which also exhibited a linear decrease in EC versus log
Mw) (Fig. 6a). The decrease in EC with the increased molecular weight was attributed to the increased viscosity of the electrolyte solution. The restriction of molecular movement by binding the amino groups to the high-molecular-weight polymer chain reduced the EC. This inverse correlation of EC with the molecular weight is characteristic of polyelectrolytes, as evidenced by PAH-Cl, which also exhibited a linear decrease in EC versus log![[thin space (1/6-em)]](https://www.rsc.org/images/entities/char_2009.gif) Mw (Fig. 6b). For the same molecular weight, the CA-captured PAA had a lower EC than PAH-Cl due to its lower ion conductivity: 44.5 × 10⁻⁴ m2 S mol−1 for HCO3−, 69.3 × 10⁻⁴ m2 S mol−1 for 1/2CO32− and 76.31 × 10⁻⁴ m2 S mol−1 for Cl−.80
Mw (Fig. 6b). For the same molecular weight, the CA-captured PAA had a lower EC than PAH-Cl due to its lower ion conductivity: 44.5 × 10⁻⁴ m2 S mol−1 for HCO3−, 69.3 × 10⁻⁴ m2 S mol−1 for 1/2CO32− and 76.31 × 10⁻⁴ m2 S mol−1 for Cl−.80
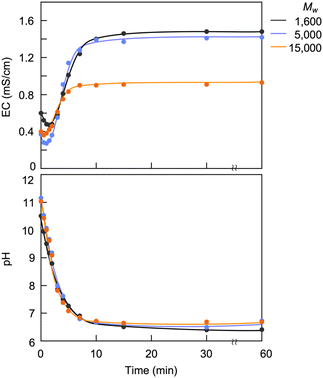 |
| | Fig. 5 Variations in EC and pH of PAA solutions on introducing CO2. [AA]0 = 0.932 mol L−1 for the pH measurement and 0.0621 mol L−1 for the EC. | |
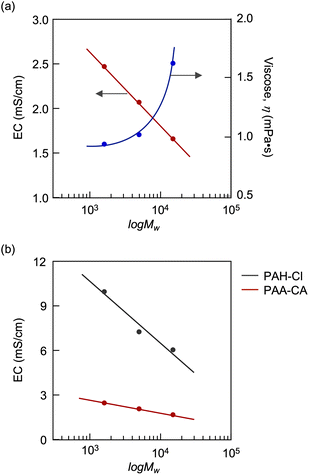 |
| | Fig. 6 (a) Plots of the steady-state EC value and viscosity versus the molecular weight of PAA. (b) Plots of EC versus the molecular weight for the CA-captured PAA (PAA-CA) and PAH-Cl. [AA] = [AH-Cl] = 0.116 mol L−1. | |
PAA is effective for capturing CA, compared to low-molecular-weight amino compounds. Fig. 7 shows variations in the pH of solutions using three different amines: TM-Hex, DA-Hex and PAA (Mw = 1600). The primary amines captured CA more efficiently than the tertiary amine due to their less steric hindrance and greater hydrophilicity. Furthermore, the polymeric amine grasped CA more effectually than DA-Hex because it produced a much lower pH, although it reduced EC due to the restriction of molecular movement. Binding the amines involves more amine molecules in interacting with a CA molecule, resulting in effective capture of CA (Fig. 8).
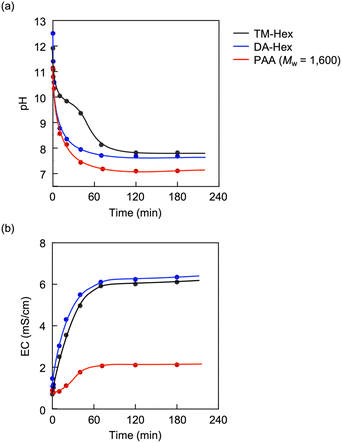 |
| | Fig. 7 Variations in (a) pH and (b) EC upon introducing CO2 into solutions of TM-Hex,54 DA-Hex and PAA. [NR2]0 = 2.63 mol L−1 for the pH measurement and 0.117 mol L−1 for the EC. R = CH3 for TM-Hex and H for DA-Hex and PAA. CO2 flow rate = 250 mL min−1. | |
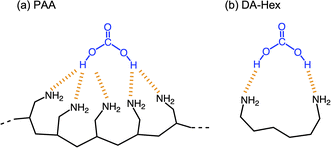 |
| | Fig. 8 Mechanism for the more efficient capture of CA by PAA compared to DA-Hex. | |
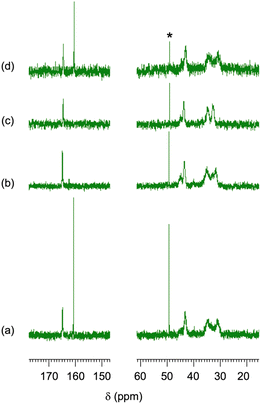
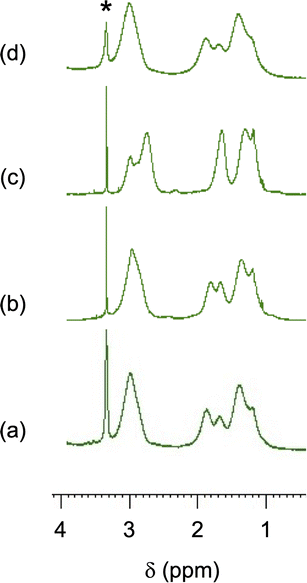
The CA-captured PAA exhibited differences in discharging CA between its solid and liquid states. DSC analysis revealed that the polymer began to release CO2 at 68.6 °C and completed this upon continued heating (Fig. 9). Whereas the CA-captured PAA in a solid state required heating to discharge the CA, the polymer in solution released it at room temperature upon introducing N2. After N2 introduction for 1 h, the solution showed only the signal at 164.5 ppm in 13C NMR (Fig. 10b), indicating that the bicarbonate converted into carbamate, thereby releasing CO2. This release produced no change in the chemical shift of the methylene protons in 1H NMR (Fig. 11b), suggesting the absence of CA-free allylamine units. Raising the temperature reduced the intensity of the carbamate carbon signal (Fig. 10c), while the methylene proton signal partially shifted to that of the original PAA (Fig. 11c), indicating that the CA-captured PAA partially discharged the CO2 from the carbamate to produce CA-free allylamine units. The polymer captured CA again upon a second CO2 introduction, producing bicarbonate and carbonate (Fig. 10d and 11d). Thus, the transitions between PAA and the ammonium carbamate, and between the carbamate and bicarbonate/carbonate, are reversible (Fig. 12).
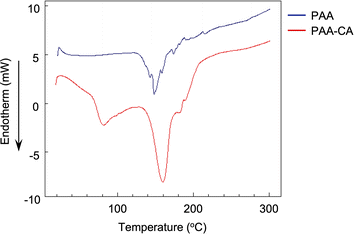 |
| | Fig. 9 DSC spectra of the CA-captured PAA (PAA-CA) and PAA. Mw = 15![[thin space (1/6-em)]](https://www.rsc.org/images/entities/char_2009.gif) 000. 000. | |
 |
| | Fig. 10
13C NMR spectra of the CA-captured PAA: (a) after introduction of CO2 for 1 h, (b) N2 for 1 h at 25 °C, (c) N2 for 1 h at 60 °C and (d) second CO2 for 1 h. Mw = 15![[thin space (1/6-em)]](https://www.rsc.org/images/entities/char_2009.gif) 000. Solvent: D2O. *CH3OH standard. 000. Solvent: D2O. *CH3OH standard. | |
 |
| | Fig. 11
1H NMR spectra of the CA-captured PAA: (a) after introduction of CO2 for 1 h, (b) N2 for 1 h at 25 °C, (c) N2 for 1 h at 60 °C and (d) second CO2 for 1 h. Mw = 15![[thin space (1/6-em)]](https://www.rsc.org/images/entities/char_2009.gif) 000. Solvent: D2O. *CH3OH standard. 000. Solvent: D2O. *CH3OH standard. | |
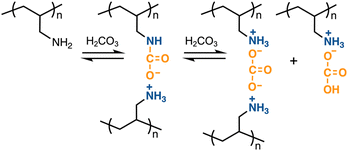 |
| | Fig. 12 Reversible transitions between PAA and the ammonium carbamate, and between the carbamate and bicarbonate/carbonate. | |
However, the carbamate-to-bicarbonate/carbonate transition is a much lower-energy process that proceeds at room temperature. Fig. 13 shows variations in EC and pH of the CA-captured PAA solution upon introducing N2, based on the conversion of the bicarbonate to carbamate. After introducing N2 for 1 h, the EC and pH reached their steady states. The decrease in EC was linked to the increase in pH, indicating that the CA was removed as gaseous CO2 from the solution.
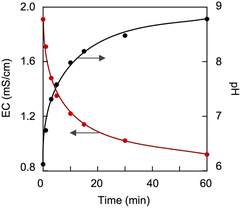 |
| | Fig. 13 Variations in EC and pH of the CA-captured PAA solution on introducing N2. [AA]0 = 0.116 mol L−1, Mw = 15![[thin space (1/6-em)]](https://www.rsc.org/images/entities/char_2009.gif) 000. 000. | |
This transition was completely reversible and repeatable by alternating CO2/N2 introductions, as evidenced by the excellent hysteresis in the EC changes upon repeated introductions (Fig. 14).
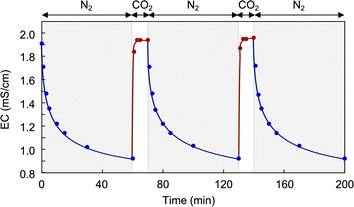 |
| | Fig. 14 Repetitive changes in EC and pH of the CA-captured PAA by alternating CO2/N2 introductions. [AA]0 = 0.116 mol L−1, Mw = 15![[thin space (1/6-em)]](https://www.rsc.org/images/entities/char_2009.gif) 000. 000. | |
Conversion of CA-captured PAA into polymer surfactant
Ammonium bicarbonate readily undergoes ion exchange due to its weak electrostatic interaction between the ammonium cation and bicarbonate anion. It has been reported that a polymer loading the ammonium bicarbonate derived from hindered secondary amine, ion-exchanged with poly(sodium 4-styrenesulfonate) to produce polymer complexes with ribbon-like or sheet-like morphologies.81 The present study investigated partial ion exchange with SDS to convert the CA-captured PAA into a polymer surfactant. By this conversion, the PAA randomly loads the dodecyl groups on its side chains, producing a random copolymer-like surfactant. Amphiphilic random copolymers, readily available by one-step polymerization, self-assemble into micellar nanospheres.82,83 SDS is an anionic low-molecular-weight surfactant and serves as a cation exchanger and a modifier of micelle surfaces.84,85 SDS has a low critical micelle concentration (CMC) of 8.3 × 10⁻³ mol L−1 at 25 °C.86–88 Below this CMC, this study explored the ion exchange of the CA-captured PAA with SDS at 25 °C. UV analysis revealed that the CA-captured PAA aggregated in the presence of SDS. The variations in transmittance of the polymer solutions are shown in Fig. 15, with the concentration of [AA]0 = 3.59 × 10⁻³ mol L−1versus the SDS/AA ratio. As a result of increasing the SDS/AA ratio, the transmittance at a 400 nm wavelength decreased. The ion exchange between the bicarbonate anion and dodecyl sulfate loaded the hydrophobic dodecyl groups onto the CA-captured PAA chain, causing its aggregation. At an SDS/AA ratio of 1.0, the transmittance suddenly increased due to the precipitation of the aggregates. The polymer released all the bicarbonate anions through the ion exchange with an equivalent amount of dodecyl sulfate, forming insoluble aggregates. It is evident that the dodecyl groups on the polymer induced aggregation, since SES produced no change in transmittance for the polymer solution. The ethyl chain is too short to induce polymer aggregation.
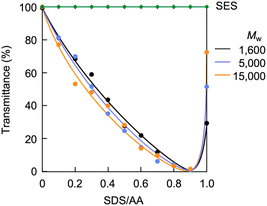 |
| | Fig. 15 Variation in transmittance of the polymer solution versus the SDS/AA ratio. [AA]0 = 3.59 × 10⁻³ mol L−1. SES for PAA (Mw = 15![[thin space (1/6-em)]](https://www.rsc.org/images/entities/char_2009.gif) 000). 000). | |
Light scattering studies demonstrated that the polymer loading with the dodecyl groups self-assembled into nanoparticles. Fig. 16 shows the variation in hydrodynamic diameter (Dh) of the CA-captured PAA upon adding SDS. The Dh immediately decreased with the addition of a small amount of SDS, then rapidly increased with more SDS. The hydrodynamic size decreased again with further SDS addition and finally increased due to continued addition of SDS. This up-and-down change in the Dh with increasing SDS reflects different association states of the polymer. A small number of dodecyl groups induce intramolecular association of the polymer, shrinking the polymer chain and causing a reduction in the hydrodynamic size (Fig. 17). The polymer chains aggregated with each other due to the increased number of dodecyl groups, resulting in an increase in the hydrodynamic size. A further increase in the number of dodecyl groups disrupts the intramolecular association, altering it to intermolecular aggregation, which causes the second decrease in Dh. This switch from the intramolecular association to the intermolecular aggregation involves reorganization of the self-assembly, leading to a gradual increase in the Dh with further addition of SDS. SDS shows no self-assembly in the absence of the CA-captured polymer, being below its CMC. The dodecyl groups significantly induced the self-assembly of the polymer by locating on the polymer side chains. Even with the SDS concentration at 3.60 × 10⁻⁴ mol L−1, which is 23 times lower than the CMC and corresponds to a 0.1 ratio to AA, all the polymer chains participated in the self-assembly, and there were no isolated polymer chains based on the number conversion distribution analysis in the light scattering (Fig. 18). The isolated polymer was 12.7 nm in diameter, aggregating to a size of 192.2 nm at the 0.1 ratio. Up to an SDS/AA ratio of 0.6, the scattering intensity of the polymer solution increased (Fig. 19); however, it decreased beyond this ratio due to the highly dodecyl-loaded polymers precipitating. The aggregates are stabilized below the medium SDS/AA ratio by the ammonium bicarbonate surrounding the hydrophobic dodecyl core. Fig. 20 displays a linear correlation between the Dh of the aggregates at SDS/AA = 0.5 and the log![[thin space (1/6-em)]](https://www.rsc.org/images/entities/char_2009.gif) Mw of the polymer. The size of the aggregates lay in a range of 150 to 180 nm, depending on the molecular weight of the polymer. The normalized time correlation function of the scattering field, G1(τ), revealed that the CA-captured PAA produced monodisperse spherical aggregates. For monodisperse spherical particles, G1(τ) displays a single exponential decay with time.89 As shown in Fig. 21, the polymer with Mw = 15
Mw of the polymer. The size of the aggregates lay in a range of 150 to 180 nm, depending on the molecular weight of the polymer. The normalized time correlation function of the scattering field, G1(τ), revealed that the CA-captured PAA produced monodisperse spherical aggregates. For monodisperse spherical particles, G1(τ) displays a single exponential decay with time.89 As shown in Fig. 21, the polymer with Mw = 15![[thin space (1/6-em)]](https://www.rsc.org/images/entities/char_2009.gif) 000 and SDS/AA = 0.5 exhibited a linear decay of ln(G1(τ)) with time, indicating the formation of monodisperse spherical aggregates due to the intramolecular self-assembly of the long polymer chain. As the molecular weight decreased, the ln(G1(τ)) decay deviated from a linear line (Fig. S2†). The low-molecular-weight polymer had the potential to form non-spherical or polydisperse nanoparticles due to their random intermolecular aggregation.
000 and SDS/AA = 0.5 exhibited a linear decay of ln(G1(τ)) with time, indicating the formation of monodisperse spherical aggregates due to the intramolecular self-assembly of the long polymer chain. As the molecular weight decreased, the ln(G1(τ)) decay deviated from a linear line (Fig. S2†). The low-molecular-weight polymer had the potential to form non-spherical or polydisperse nanoparticles due to their random intermolecular aggregation.
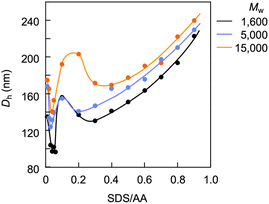 |
| | Fig. 16 Variation in hydrodynamic diameter of the CA-captured PAA versus the SDS/AA ratio. [AA]0 = 3.59 × 10⁻³ mol L−1. | |
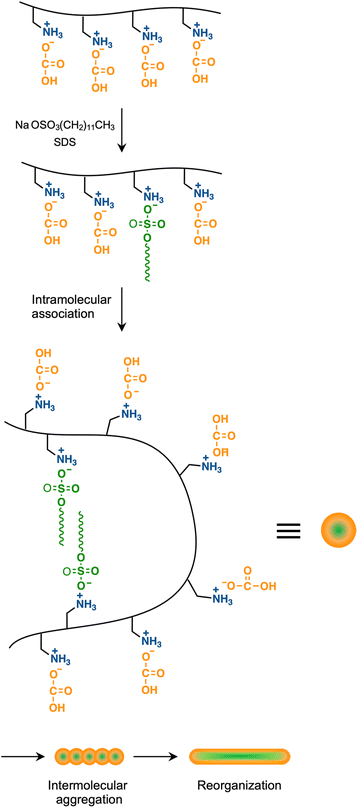 |
| | Fig. 17 Association states of the polymer for different amount of SDS. | |
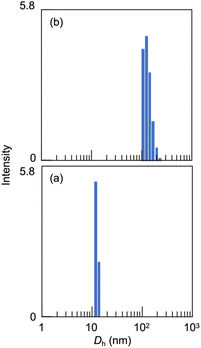 |
| | Fig. 18 The number conversion distributions in light scattering: (a) the isolated polymer at SDS/AA = 0.01 and (b) aggregates at SDS/AA = 0.1. Mw = 15![[thin space (1/6-em)]](https://www.rsc.org/images/entities/char_2009.gif) 000, [AA]0 = 3.59 × 10⁻³ mol L−1. 000, [AA]0 = 3.59 × 10⁻³ mol L−1. | |
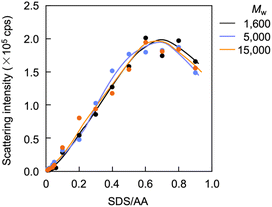 |
| | Fig. 19 Variation in scattering intensity of the polymer solution versus the SDS/AA ratio. [AA]0 = 3.59 × 10⁻³ mol L−1. | |
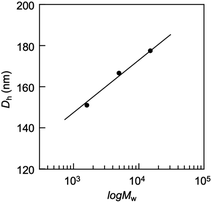 |
| | Fig. 20 Plots of the hydrodynamic diameter of the aggregates versus the molecular weight of PAA. SDS/AA = 0.5, [AA]0 = 3.59 × 10⁻³ mol L−1. | |
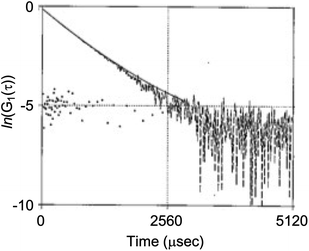 |
| | Fig. 21 Variation in G1(τ) with time for the polymer solution. Mw = 15![[thin space (1/6-em)]](https://www.rsc.org/images/entities/char_2009.gif) 000. SDS/AA = 0.5. [AA]0 = 3.59 × 10⁻³ mol L−1. 000. SDS/AA = 0.5. [AA]0 = 3.59 × 10⁻³ mol L−1. | |
FE-SEM observations demonstrated that the high-molecular-weight polymer aggregated into spherical monodisperse nanoparticles (Fig. 22a). The particles had a number-average diameter (Dn) of 106.7 nm, which is much smaller than the Dh observed in light scattering due to the observation of the aggregates shrunk by drying. The size distribution (Dw/Dn) was obtained by calculation using the weight-average diameter (Dw), calculated as Dw = ΣDi4/ΣDi3, according to a previous study.72 The Dw was calculated to be 112.9 nm for the spherical particles, leading to a size distribution of Dw/Dn = 1.06, indicative of monodisperse particles when it is considered that a size distribution of Dw/Dn = 1.00 is perfect for monodisperse particles. The particles transformed into a worm-like morphology with an increase in the polymer concentration (Fig. 22b). At a high concentration, the intramolecular aggregates connected with each other in line, causing the transformation into worm-like particles. Lower molecular weight polymers more readily self-assembled into worm-like particles even at low concentrations due to their intermolecular aggregation (Fig. 22c–f). Furthermore, the Mw 1600 polymer produced vesicle-like nanoparticles at a high concentration (Fig. 22g). The shorter chain polymer is more hydrophilic, increasing the hydrophilicity of the internal core, resulting in self-assembly into vesicles. Not only the vesicles but also the spherical and worm-like particles are nano-sized capsules with micellar structures, since they were produced by the self-assembling of the polymer surfactants. These nanoarchitectures are stabilized with the bicarbonate on the surface of their outer shells, which have the potential to serve as nanocarriers for drugs and genes in delivery systems, releasing them in response to bicarbonate concentrations in the blood. The polymer surfactant developed in this study also has the potential to perform highly in the polymer alternating gas (PAG) process used in enhanced oil recovery (EOR). In this process, the polymer facilitates oil movement toward production wells by alternating with CO2 to displace oil.90–92 The conversion of the CA-captured PAA into the polymer surfactant is accompanied by CO2 release, which can be controlled by adjusting the ratio of the ion exchanger. The ion exchange in water causes the surfactant to self-assemble into nanoobjects, which are expected to effectively displace oil when used in the PAG injection method. The simultaneous generation of nanoobjects and CO2 release in water could improve the water alternating gas injection method93 and simplify the PAG method, leading to more effective EOR.
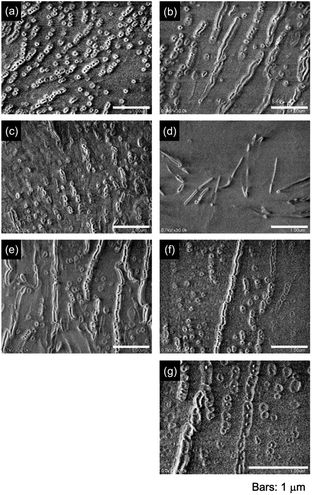 |
| | Fig. 22 FE-SEM images of the aggregate morphologies for the polymer surfactants with the molecular weight: (a and b) Mw = 15![[thin space (1/6-em)]](https://www.rsc.org/images/entities/char_2009.gif) 000, (c and d) 5000 and (e–g) 1600. (a, c and e) [AA]0 = 3.42 × 10⁻³ mol L−1 and (b, d, f and g) 1.03 × 10⁻² mol L−1. 000, (c and d) 5000 and (e–g) 1600. (a, c and e) [AA]0 = 3.42 × 10⁻³ mol L−1 and (b, d, f and g) 1.03 × 10⁻² mol L−1. | |
Conclusions
This study demonstrated the effective capture of CO2 as carbonic acid using PAA and utilization of the CO2-captured PAA for a polymer surfactant to produce nanoarchitectures. PAA captures carbonic acid more effectively than low-molecular-weight amines due to its polymeric amine structure, where more amino groups assist in capturing carbonic acid. The capture of carbonic acid produces electrolytes, the electroconductivity of which is inversely proportional to the molecular weight of the polymer, due to increased viscosity. PAA reversibly and repeatably releases carbonic acid in an aqueous medium at room temperature through alternating introductions of CO2 and N2, relying on the equilibrium between ammonium bicarbonate/carbonate and carbamate. The carbonic acid-captured PAA is converted into a polymer surfactant to produce spherical and worm-like nanoarchitectures by undergoing partial ion exchange between the bicarbonate anion and dodecyl sulfate. The bicarbonate anions released from the PAA by the ion exchange are a source of CO2, forming a closed loop of CO2 in the utilization of the CO2-captured absorbent. The conversion of the CO2-captured polymer can create versatile surfactants by selecting various ion exchangers. This material design, employing CO2-captured absorbents within a closed loop, facilitates industrial uses of these absorbents, promising to reduce CO2 emissions.
Conflicts of interest
There are no conflicts to declare.
Acknowledgements
This work was supported by the Japan Society for the Promotion of Science (JSPS) Grant-in-Aid for Scientific Research (Grant Number 23K04533).
References
- M. T. McCulloch, A. Winter, C. E. Sherman and J. A. Trotter, Nat. Clim. Change, 2024, 14, 171–177 CrossRef.
- A. Mani, T. Budd and E. Maine, RSC Sustainability, 2024, 2, 903–927 RSC.
- C. G. Bousfield, D. B. Lindenmayer and D. P. Edwards, Nat. Geosci., 2023, 16, 1145–1150 CrossRef CAS.
- D. K. Hutchinson, L. Menviel, K. J. Meissner and A. M. Hogg, Nat. Commun., 2024, 15, 1026 CrossRef CAS PubMed.
- H. Pang, W. Zhang, S. Wu, T. M. Jenk, M. Schwikowski and S. Hou, Sci. Bull., 2024, 69, 375–381 CrossRef PubMed.
- K. A. Hapsari, T. Jennerjahn, S. H. Nugroho, E. Yulianto and H. Behling, Global Change Biol., 2022, 28, 3459–3479 CrossRef CAS PubMed.
- P. Blanchon, A. Eisenhauer, J. Fietzke and V. Liebetrau, Nature, 2009, 458, 881–885 CrossRef CAS PubMed.
- A. Dada, R. Almar and P. Morand, Sci. Rep., 2024, 14, 890 CrossRef PubMed.
- S. A. Kulp and B. H. Strauss, Nat. Commun., 2019, 10, 4844 CrossRef CAS PubMed.
- S. Lee, R. Lumpkin, F. Gomez, S. Yeager, H. Lopez, F. Takglis, S. Dong, W. Aguiar, D. Kim and M. Baringer, Nat. Commun. Earth Environ., 2023, 4, 69 CrossRef.
- N. R. Bates and R. J. Johnson, Nat. Commun. Earth Environ., 2020, 1, 33 CrossRef.
- M. McLean, D. Mouillot, A. A. Maureaud, T. Hattab, M. A. MacNeil, E. Goberville, M. Lindegren, G. Engelhard, M. Pinsky and A. Auber, Curr. Biol., 2021, 31, 4817–4823 CrossRef CAS PubMed.
- S. E. Moffitt, T. M. Hill, P. D. Roopnarine and J. P. Kennett, Proc. Natl. Acad. Sci. U.S.A., 2015, 112, 4684–4689 CrossRef CAS PubMed.
- G. Gao, L. Song, Y. Zhang and H. Chu, Soil Biol. Biochem., 2024, 191, 109348 CrossRef CAS.
- W. W. L. Cheung, R. Watson and D. Pauly, Nature, 2013, 497, 365–369 CrossRef CAS PubMed.
- C. Arbués, T. Chatzivasileiadis, O. Ivanova, S. Storm, F. Bosello and T. Filatova, Sci. Rep., 2024, 14, 126 CrossRef PubMed.
- S. Yin, Y. Zhou, Z. Liu, H. Wang, X. Zhao, Z. Zhu, Y. Yan and P. Huo, Nat. Commun., 2024, 15, 437 CrossRef CAS PubMed.
- M. He, Z. Fang, P. Wang, Y. You and Z. Li, ACS Sustainable Chem. Eng., 2023, 11, 12194–12217 CrossRef CAS.
- K. Wang, Z. Hu, P. Yu, A. M. Balu, K. Li, L. Li, L. Zeng, C. Zhang, R. Luque, K. Yan and H. Luo, Nano-Micro Lett., 2024, 16, 1–17 CrossRef PubMed.
- Z. Xie, E. Huang, S. Garg, S. Hwang, P. Liu and J. G. Chen, Nat. Catal., 2024, 7, 98–109 CrossRef CAS.
- T. Kawawaki, T. Okada, D. Hirayama and Y. Negishi, Green Chem., 2024, 26, 122–163 RSC.
- Y. Hua, C. Zhu, L. Zhang and F. Dong, Materials, 2024, 17, 600 CrossRef CAS PubMed.
- B. Chang, H. Pang, F. Raziq, S. Wang, K. Huang, J. Ye and H. Zhang, Energy Environ. Sci., 2023, 16, 4714–4758 RSC.
- A. Molino, S. Mehariya, D. Karatza, S. Chianese, A. Iovine, P. Casella, T. Marino and D. Musmarra, Energies, 2019, 12, 2806 CrossRef CAS.
- Y. Li, S. Zheng, H. Liu, Q. Xiong, H. Yi, H. Yang, Z. Mei, Q. Zhao, Z. Yin, M. Huang, Y. Lin, W. Lai, S. Dou, F. Pan and S. Li, Nat. Commun., 2024, 15, 176 CrossRef CAS PubMed.
- C. Deacy, A. F. R. Kilpatrick, A. Regoutz and C. K. Williams, Nat. Chem., 2020, 12, 372–380 CrossRef PubMed.
- S. Klaus, M. W. Lehenmeier, C. E. Anderson and B. Rieger, Coord. Chem. Rev., 2011, 255, 1460–1479 CrossRef CAS.
- Y. Qin, X. Sheng, S. Liu, G. Ren, X. Wang and F. Wang, J. CO2 Util., 2015, 11, 3–9 CrossRef CAS.
- E. Woods, V. R. Berrio, Y. Qiu, P. Berlin, N. Clauser and W. J. Sagues, RSC Sustainability, 2024, 2, 621–625 RSC.
- S. Stegenta-Dabrowska, E. Sygula, M. Bednik and J. Rosik, Materials, 2024, 17, 563 CrossRef CAS PubMed.
- S. Chowdhury, Y. Kumar, S. Shrivastava, S. K. Patel and J. S. Sangwai, Energy Fuels, 2023, 37, 10733–10757 CrossRef CAS.
- X. Yu, C. O. Catanescu, R. E. Bird, S. Satagopan, Z. J. Baum, L. M. L. Diaz and Q. A. Zhou, ACS Omega, 2023, 8, 11643–11664 CrossRef CAS PubMed.
- A. A. Olajire, Energy, 2010, 35, 2610–2628 CrossRef CAS.
-
D. Kearns, H. Liu and C. Consoli, Technology Readiness and Costs of CCS, Global CCS Institute, 2021, pp. 1−50 Search PubMed.
- W. L. Theo, J. S. Lim, H. Hashim, A. A. Mustaffa and W. S. Ho, Appl. Energy, 2016, 183, 1633–1663 CrossRef CAS.
- Y. Mohammed, M. Samah, A. Mohamed and G. Sabina, Int. J. Eng. Res., 2014, 3, 742–744 CrossRef.
- N. Hedin, L. Andersson, L. Bergström and J. Yan, Appl. Energy, 2013, 104, 418–433 CrossRef CAS.
- T. N. Borhani and M. Wang, Renewable Sustainable Energy Rev., 2019, 114, 109299 CrossRef CAS.
- T. S. Nguyen, N. A. Dogan, H. Lim and C. T. Yavuz, Acc. Chem. Res., 2023, 56, 2642–2652 CrossRef CAS PubMed.
- C. Kim, Y. Ha and M. Choi, Acc. Chem. Res., 2023, 56, 2887–2897 CrossRef CAS PubMed.
- M. A. Alkhabbaz, R. Khunsupat and C. W. Jones, Fuel, 2014, 121, 79–85 CrossRef CAS.
- J. Wei, Y. Ma, Z. Qin, Z. Jin, Y. Jin, L. Yang, L. Yao, W. Jiang, Y. Deng, Y. Huang, H. Zhao, J. Dong, L. Deng and Z. Dai, Sep. Purif. Technol., 2023, 320, 124182 CrossRef CAS.
- Y. Pu, Z. Yang, V. Wee, Z. Wu, Z. Jiang and D. Zhao, J. Membr. Sci., 2020, 641, 119912 CrossRef.
- K. Kim, J. Lee and J. Lee, J. Membr. Sci., 2020, 598, 117796 CrossRef CAS.
- T. H. H. Shiue, S. M. Chang and G. Leggett, Int. J. Environ. Sci. Technol., 2022, 19, 4237–4250 CrossRef.
- J. Chen, L. Duan, Y. Ma, Y. Jiang, A. Huang, H. Zhu, H. Jiao, M. Li, Y. Hu, H. Zhou, Y. Xu, F. Donat, M. A. Naeem and O. Krocher, Fuel, 2023, 334, 126630 CrossRef CAS.
- F. M. Baena-Moreno, D. Mei, H. Leion and D. Pallares, Biomass Bioenergy, 2023, 176, 106918 CrossRef CAS.
- W. Chan, T. Morosuk, X. Li and H. Li, Energy Convers. Manage., 2023, 294, 117607 CrossRef.
- A. Gautam and M. K. Mondal, Fuel, 2023, 334, 126616 CrossRef CAS.
- M. Bernhardsen and H. K. Knuutila, Int. J. Greenhouse Gas Control, 2017, 61, 27–48 CrossRef.
- R. Guo, G. Li, Y. Liu and W. Pan, Energy Fuels, 2023, 37, 15429–15452 CrossRef CAS.
- R. Zhang, Y. Li, X. He, Y. Niu, C. Li, M. W. Amer and F. Barzagli, Sep. Purif. Technol., 2023, 316, 123810 CrossRef CAS.
- G. F. Versteeg and W. P. M. Van Swaaij, Chem. Eng. Sci., 1988, 43, 587–591 CrossRef CAS.
- E. Yoshida, SCIREA J. Chem., 2020, 5(2), 12–29 Search PubMed.
- B. Aghel, S. Sahraie and E. Heidaryan, Energy, 2020, 201, 117618 CrossRef CAS.
- G. F. Versteeg and W. P. M. Van Swaaij, Chem. Eng. Sci., 1988, 43, 573–585 CrossRef CAS.
- G. F. Versteeg, L. A. J. Van Dijck and W. P. M. Van Swaaij, Chem. Eng. Commun., 1996, 144, 113–158 CrossRef CAS.
- J. Kothandaraman, A. Goeppert, M. Czaun, G. A. Olah and G. K. S. Prakash, Green Chem., 2016, 18, 5831–5838 RSC.
- J. Zhang, Y. Qiao, W. Wang, R. Misch, K. Hussain and D. W. Agar, Energy Procedia, 2013, 37, 1254–1261 CrossRef CAS.
- Y. Shen, C. Jiang, S. Zhang, J. Chen, L. Wang and J. Chen, Appl. Energy, 2018, 230, 726–733 CrossRef CAS.
- M. Varghese and G. N. Karanikolos, Int. J. Greenhouse Gas Control, 2020, 96, 103005 CrossRef.
- D. Wang, X. Wang and C. Song, ChemPhysChem, 2017, 18, 3163–3173 CrossRef CAS PubMed.
- S. Bali, T. T. Chen, W. Chaikittisilp and C. W. Jones, Energy Fuels, 2013, 27, 1547–1554 CrossRef CAS.
- W. Chaikittisilp, R. Khunsupat, T. T. Chen and C. W. Jones, Ind. Eng. Chem.
Res., 2011, 50, 14203–14210 CrossRef CAS.
- W. Chaikittisilp, R. Khunsupat, T. T. Chen and C. W. Jones, Ind. Eng. Chem. Res., 2011, 50, 14203–14210 CrossRef CAS.
- A. Koutsianos, L. B. Hamdy, C. Yoo, J. J. Lee, M. Taddei, J. M. Urban-Klaehn, J. Dryzek, C. W. Jones, A. R. Barron and E. Andreoli, J. Mater. Chem. A, 2021, 9, 10827–10837 RSC.
- D. Saravanakumar, J. Song, N. Jung, H. Jirimali and W. Shin, ChemSusChem, 2012, 5, 634–636 CrossRef CAS PubMed.
- M. A. Alkhabbaz, R. Khunsupat and C. W. Jones, Fuel, 2014, 121, 79–85 CrossRef CAS.
- E. Yoshida, Colloid Polym. Sci., 2010, 288, 1321–1325 CrossRef CAS.
- E. Apuzzo, M. Agazzi, S. E. Herrera, A. Picco, G. Rizzo, C. Chavero, D. Bianchi, P. Smaldini, M. L. Cortez, W. A. Marmisolle, G. Padula, A. Seoane, M. L. Alomar, M. P. Denofrio, G. Docena and O. Azzaroni, ACS Appl. Bio Mater., 2023, 6, 4714–4727 CrossRef CAS PubMed.
- D. W. Marquadt, J. Soc. Ind. Appl. Math., 1963, 11, 431–441 CrossRef.
- S. Kobayashi, H. Uyama, I. Yamamoto and Y. Matsumoto, Polym. J., 1990, 22, 759–761 CrossRef CAS.
- C. K. Ahn, H. W. Lee, Y. S. Chang, K. Han, J. Y. Kim, C. H. Rhee, H. D. Chun, M. W. Lee and J. M. Park, Int. J. Greenhouse Gas Control, 2011, 5, 1606–1613 CrossRef CAS.
- E. Carretti, L. Dei, P. Baglioni and R. G. Weiss, J. Am. Chem. Soc., 2003, 125, 5121–5129 CrossRef CAS PubMed.
- N. Wen and M. H. Brooker, J. Phys. Chem., 1995, 99, 359–368 CrossRef CAS.
- F. Qin, S. Wang, I. Kim, H. F. Svendsen and C. Chen, Int. J. Greenhouse Gas Control, 2011, 5, 405–412 CrossRef CAS.
- J. T. YehT, K. P. Resnik, K. Rygle and H. W. Pennline, Fuel Process. Technol., 2005, 86, 1533–1546 CrossRef.
- V. Darde, K. Thomsen, W. J. M. van Well and E. H. Stenby, Energy Procedia, 2009, 1, 1035–1042 CrossRef CAS.
- F. Mani, M. Peruzzini and P. Stoppioni, Green Chem., 2006, 8, 995–1000 RSC.
-
D. R. Lide, CRC Handbook of Chemistry and Physics, CRC Press, Boca Raton, 76th edn, 1995, pp. 5-90–5-92 Search PubMed.
- E. Yoshida, Carbon Capture Sci. Technol., 2022, 2, 100038 CrossRef CAS.
- I. Sadeghi, J. Kronenberg and A. Asatekin, ACS Nano, 2018, 12, 95–108 CrossRef CAS.
- S. Imai, Y. Hirai, C. Nagao, M. Sawamoto and T. Terashima, Macromolecules, 2018, 51, 398–409 CrossRef CAS.
- R. Klein, M. Kellermeier, D. Touraud, E. Müller and W. Kunz, J. Colloid Interface Sci., 2013, 392, 274–280 CrossRef CAS PubMed.
- J. B. S. Bonilha, R. M. Z. Georgetto, E. Abuin, E. Lissi and F. Quina, J. Colloid Interface Sci., 1990, 135, 238–245 CrossRef CAS.
- G. Tyagi, D. Seddon, S. Khodaparast, W. N. Sharratt, E. S. J. Robles and J. T. Cabral, Colloids Surf., A, 2021, 618, 126414 CrossRef CAS.
- J. P. Marcolongo and M. Mirenda, J. Chem. Educ., 2011, 88, 629–633 CrossRef CAS.
- P. H. Elworthy and K. J. Mysels, J. Colloid Interface Sci., 1966, 21, 331–347 CrossRef CAS.
-
W. Brown, Light Scattering Principles and Development. Clarendon Press, Oxford, 1996, pp. 439–442 Search PubMed.
- S. Prakash, D. Joshi, K. Ojha and A. Mandal, Energy Fuels, 2024, 38(7), 5676–5689 CrossRef CAS.
- N. Kumar, M. A. Sampaio, K. Ojha, H. Hoteit and A. Mandal, Fuel, 2022, 330, 125633 CrossRef CAS.
- Y. Yang, W. Li, T. Zhou and Z. Dong, IOP Conf. Series: Earth Environ. Sci., 2018, 113, 012182 Search PubMed.
- S. Kumar and A. Mandal, J. Pet. Sci. Eng., 2017, 157, 696–715 CrossRef CAS.
|
| This journal is © The Royal Society of Chemistry 2024 |
Click here to see how this site uses Cookies. View our privacy policy here.  Open Access Article
![[thin space (1/6-em)]](https://www.rsc.org/images/entities/char_2009.gif) 000 were supplied by Nittobo Co., Ltd as their aqueous solutions; 15 wt% solutions for PAAs with Mw = 1600 and 15
000 were supplied by Nittobo Co., Ltd as their aqueous solutions; 15 wt% solutions for PAAs with Mw = 1600 and 15![[thin space (1/6-em)]](https://www.rsc.org/images/entities/char_2009.gif) 000, and a 20 wt% solution for that with Mw = 5000. Poly(allylamine hydrochloride) (PAH-Cl), with Mw = 1600, 5000 and 15
000, and a 20 wt% solution for that with Mw = 5000. Poly(allylamine hydrochloride) (PAH-Cl), with Mw = 1600, 5000 and 15![[thin space (1/6-em)]](https://www.rsc.org/images/entities/char_2009.gif) 000, was also supplied by Nittobo Co., Ltd as aqueous solutions; a 34 wt% solution for Mw = 1600, 40 wt% solution for Mw = 5000 and 50 wt% solution for Mw = 15
000, was also supplied by Nittobo Co., Ltd as aqueous solutions; a 34 wt% solution for Mw = 1600, 40 wt% solution for Mw = 5000 and 50 wt% solution for Mw = 15![[thin space (1/6-em)]](https://www.rsc.org/images/entities/char_2009.gif) 000. 1,6-Diaminohexane (DA-Hex), purchased from Tokyo Chemical Industry, was purified by distillation over calcium hydride under reduced pressure. Ammonium bicarbonate, ammonium carbonate and ammonium carbamate were purchased from Sigma-Aldrich and used as received. Sodium dodecyl sulfate (SDS), purchased from Kishida Chemical, and sodium ethyl sulfate (SES), obtained from Tokyo Chemical Industry, were used as received. Ultrapure water was obtained using a Merck Milli-Q® Integral MT-5 water purification system. CO2 with over 99.995% vol purity and N2 with over 99.9995% vol purity were purchased from Taiyo Nippon Sanso Corporation.
000. 1,6-Diaminohexane (DA-Hex), purchased from Tokyo Chemical Industry, was purified by distillation over calcium hydride under reduced pressure. Ammonium bicarbonate, ammonium carbonate and ammonium carbamate were purchased from Sigma-Aldrich and used as received. Sodium dodecyl sulfate (SDS), purchased from Kishida Chemical, and sodium ethyl sulfate (SES), obtained from Tokyo Chemical Industry, were used as received. Ultrapure water was obtained using a Merck Milli-Q® Integral MT-5 water purification system. CO2 with over 99.995% vol purity and N2 with over 99.9995% vol purity were purchased from Taiyo Nippon Sanso Corporation.
![[thin space (1/6-em)]](https://www.rsc.org/images/entities/char_2009.gif) 000 (10.161 g as a 15 wt% solution containing 1.524 g (26.7 mmol) of the allylamine unit, AA, and 8.637 g of water), resulting in an initial AA concentration of [AA]0 = 0.932 mol L−1. CO2 was introduced by bubbling at a flow rate of 300 mL min−1, using a flow meter, into the solution contained in a 50 mL round-bottom flask situated in a water bath maintained at 25 °C, with stirring. The pH of the solution was measured at designated times. At these times, a portion of the solution (1 mL) was extracted using a syringe and diluted with water (14 mL) to facilitate an EC measurement, owing to the upper limitation of the EC meter.
000 (10.161 g as a 15 wt% solution containing 1.524 g (26.7 mmol) of the allylamine unit, AA, and 8.637 g of water), resulting in an initial AA concentration of [AA]0 = 0.932 mol L−1. CO2 was introduced by bubbling at a flow rate of 300 mL min−1, using a flow meter, into the solution contained in a 50 mL round-bottom flask situated in a water bath maintained at 25 °C, with stirring. The pH of the solution was measured at designated times. At these times, a portion of the solution (1 mL) was extracted using a syringe and diluted with water (14 mL) to facilitate an EC measurement, owing to the upper limitation of the EC meter.
![[thin space (1/6-em)]](https://www.rsc.org/images/entities/char_2009.gif) 000, obtained by the procedure mentioned above using 3.010 g of PAA (as a 15 wt% solution containing 7.91 mmol of AA) and 5.9 mL of water with CO2 introduced for 30 min, was freeze-dried for 1 h at room temperature, followed by 3.5 h at 25 °C in a water bath, resulting in a white powder (0.910 g) with a 97% yield based on the bicarbonate. Following the same procedure, PAA with Mw = 5000 (2.253 g as a 20 wt% solution containing 7.89 mmol of AA) and 6.6 mL of water produced a powder (0.818 g) with an 87% yield. Similarly, PAA with Mw = 1600 (3.004 g as a 15 wt% solution containing 7.89 mmol of AA) and 5.9 mL of water resulted in a powder (0.888 g) with a 94% yield.
000, obtained by the procedure mentioned above using 3.010 g of PAA (as a 15 wt% solution containing 7.91 mmol of AA) and 5.9 mL of water with CO2 introduced for 30 min, was freeze-dried for 1 h at room temperature, followed by 3.5 h at 25 °C in a water bath, resulting in a white powder (0.910 g) with a 97% yield based on the bicarbonate. Following the same procedure, PAA with Mw = 5000 (2.253 g as a 20 wt% solution containing 7.89 mmol of AA) and 6.6 mL of water produced a powder (0.818 g) with an 87% yield. Similarly, PAA with Mw = 1600 (3.004 g as a 15 wt% solution containing 7.89 mmol of AA) and 5.9 mL of water resulted in a powder (0.888 g) with a 94% yield.
![[thin space (1/6-em)]](https://www.rsc.org/images/entities/char_2009.gif) 000 (as a 15 wt% solution containing 13.3 mmol of AA) and 10 mL of water, by introducing CO2 for 1 h. N2 was then introduced into the solution with stirring at a flow rate of 300 mL min−1 for 1 h, after which the solution was subjected to NMR measurements.
000 (as a 15 wt% solution containing 13.3 mmol of AA) and 10 mL of water, by introducing CO2 for 1 h. N2 was then introduced into the solution with stirring at a flow rate of 300 mL min−1 for 1 h, after which the solution was subjected to NMR measurements.
![[thin space (1/6-em)]](https://www.rsc.org/images/entities/char_2009.gif) 000 (283.0 mg as a 15 wt% solution containing 0.744 mmol of AA) and 207 mL of water, with CO2 introduced for 30 min. The solution was then divided into 20 mL sample bottles in 10 mL portions while under the CO2 flow. SDS (103.7 mg, 0.360 mmol) was dissolved in 10 mL of water to prepare a solution with a concentration of 3.60 × 10⁻² mol L−1. Next, the SDS solution (0.1 mL, 3.60 × 10⁻³ mmol) was added to the CA-captured PAA solution (10 mL, 3.59 × 10⁻² mmol) with stirring on a water bath at 25 °C. The resulting mixture, with a molar ratio of SDS/AA = 0.1, was subjected to UV and light scattering measurements at 25 °C. Following the same procedure, mixtures with other ratios were prepared using the designated amounts of the SDS solution. Light scattering measurements were performed at an angle θ = 90°. The hydrodynamic diameter (Dh) of the polymer was determined using cumulant analysis, while the number conversion distribution of the Dh was obtained using Marquadt analysis.71
000 (283.0 mg as a 15 wt% solution containing 0.744 mmol of AA) and 207 mL of water, with CO2 introduced for 30 min. The solution was then divided into 20 mL sample bottles in 10 mL portions while under the CO2 flow. SDS (103.7 mg, 0.360 mmol) was dissolved in 10 mL of water to prepare a solution with a concentration of 3.60 × 10⁻² mol L−1. Next, the SDS solution (0.1 mL, 3.60 × 10⁻³ mmol) was added to the CA-captured PAA solution (10 mL, 3.59 × 10⁻² mmol) with stirring on a water bath at 25 °C. The resulting mixture, with a molar ratio of SDS/AA = 0.1, was subjected to UV and light scattering measurements at 25 °C. Following the same procedure, mixtures with other ratios were prepared using the designated amounts of the SDS solution. Light scattering measurements were performed at an angle θ = 90°. The hydrodynamic diameter (Dh) of the polymer was determined using cumulant analysis, while the number conversion distribution of the Dh was obtained using Marquadt analysis.71
![[thin space (1/6-em)]](https://www.rsc.org/images/entities/char_2009.gif) 000), the solution immediately turned opaque within a few seconds, then gradually became clear and completely homogeneous in 5 min. During the very early stage, a slight amount of the ammonium carbamate and carbonate,73,74 which are in equilibrium,75 electrostatically cross-links the polymer chains, causing gelation; however, the gel is disrupted by further capture of CA (Fig. 1). This reasoning agrees with the mechanism of reactions between CO2 and aqueous ammonia, which is based on substance stability as inferred from their reaction enthalpies.76,77 Ammonia (NH3) initially reacts with gaseous CO2 to produce ammonium carbamate, NH2COONH4 (eqn (1)). This compound then converts into ammonium carbonate, (NH4)2CO3, in the presence of water (eqn (2)).
000), the solution immediately turned opaque within a few seconds, then gradually became clear and completely homogeneous in 5 min. During the very early stage, a slight amount of the ammonium carbamate and carbonate,73,74 which are in equilibrium,75 electrostatically cross-links the polymer chains, causing gelation; however, the gel is disrupted by further capture of CA (Fig. 1). This reasoning agrees with the mechanism of reactions between CO2 and aqueous ammonia, which is based on substance stability as inferred from their reaction enthalpies.76,77 Ammonia (NH3) initially reacts with gaseous CO2 to produce ammonium carbamate, NH2COONH4 (eqn (1)). This compound then converts into ammonium carbonate, (NH4)2CO3, in the presence of water (eqn (2)).
![[double bond, length as m-dash]](https://www.rsc.org/images/entities/char_e001.gif) O stretching. Ammonium carbamate exhibited these absorptions at 1630, 1543, 1459 and 1406 cm−1. These absorptions overlapped with those of bicarbonate/carbonate C–O/C
O stretching. Ammonium carbamate exhibited these absorptions at 1630, 1543, 1459 and 1406 cm−1. These absorptions overlapped with those of bicarbonate/carbonate C–O/C![[double bond, length as m-dash]](https://www.rsc.org/images/entities/char_e001.gif) O stretching, since ammonium bicarbonate and ammonium carbonate had absorptions at 1604 and 1605 cm−1, respectively. However, the PAA exhibited absorption at 2575 cm−1, originating from the N–H stretching of the ammonium cation (–NH3+) with a bicarbonate or carbonate counter anion, while ammonium bicarbonate showed it at 2590 cm−1 and ammonium carbonate also at 2590 cm−1.
O stretching, since ammonium bicarbonate and ammonium carbonate had absorptions at 1604 and 1605 cm−1, respectively. However, the PAA exhibited absorption at 2575 cm−1, originating from the N–H stretching of the ammonium cation (–NH3+) with a bicarbonate or carbonate counter anion, while ammonium bicarbonate showed it at 2590 cm−1 and ammonium carbonate also at 2590 cm−1.
![[thin space (1/6-em)]](https://www.rsc.org/images/entities/char_2009.gif) 000, (b) the CA-captured PAA in solution after CO2 introduction for 1 h and (c) the CA-captured PAA isolated. Solvent: D2O. *CH3OH standard.
000, (b) the CA-captured PAA in solution after CO2 introduction for 1 h and (c) the CA-captured PAA isolated. Solvent: D2O. *CH3OH standard.
![[thin space (1/6-em)]](https://www.rsc.org/images/entities/char_2009.gif) 000), isolated CA-captured PAA (CA-PAA), ammonium bicarbonate, ammonium carbonate and ammonium carbamate.
000), isolated CA-captured PAA (CA-PAA), ammonium bicarbonate, ammonium carbonate and ammonium carbamate.![[thin space (1/6-em)]](https://www.rsc.org/images/entities/char_2009.gif) 000). The introduction of CO2 initially caused a decrease in EC due to the temporary gelation; thereafter, the EC increased with the duration of CO2 exposure and reached steady states. During the CO2 introduction, the PAAs showed no difference in pH variability, suggesting no difference in their ability and efficiency to capture CA. However, the steady-state EC value linearly decreased with the logarithm of the molecular weight (log
000). The introduction of CO2 initially caused a decrease in EC due to the temporary gelation; thereafter, the EC increased with the duration of CO2 exposure and reached steady states. During the CO2 introduction, the PAAs showed no difference in pH variability, suggesting no difference in their ability and efficiency to capture CA. However, the steady-state EC value linearly decreased with the logarithm of the molecular weight (log![[thin space (1/6-em)]](https://www.rsc.org/images/entities/char_2009.gif) Mw) (Fig. 6a). The decrease in EC with the increased molecular weight was attributed to the increased viscosity of the electrolyte solution. The restriction of molecular movement by binding the amino groups to the high-molecular-weight polymer chain reduced the EC. This inverse correlation of EC with the molecular weight is characteristic of polyelectrolytes, as evidenced by PAH-Cl, which also exhibited a linear decrease in EC versus log
Mw) (Fig. 6a). The decrease in EC with the increased molecular weight was attributed to the increased viscosity of the electrolyte solution. The restriction of molecular movement by binding the amino groups to the high-molecular-weight polymer chain reduced the EC. This inverse correlation of EC with the molecular weight is characteristic of polyelectrolytes, as evidenced by PAH-Cl, which also exhibited a linear decrease in EC versus log![[thin space (1/6-em)]](https://www.rsc.org/images/entities/char_2009.gif) Mw (Fig. 6b). For the same molecular weight, the CA-captured PAA had a lower EC than PAH-Cl due to its lower ion conductivity: 44.5 × 10⁻⁴ m2 S mol−1 for HCO3−, 69.3 × 10⁻⁴ m2 S mol−1 for 1/2CO32− and 76.31 × 10⁻⁴ m2 S mol−1 for Cl−.80
Mw (Fig. 6b). For the same molecular weight, the CA-captured PAA had a lower EC than PAH-Cl due to its lower ion conductivity: 44.5 × 10⁻⁴ m2 S mol−1 for HCO3−, 69.3 × 10⁻⁴ m2 S mol−1 for 1/2CO32− and 76.31 × 10⁻⁴ m2 S mol−1 for Cl−.80


![[thin space (1/6-em)]](https://www.rsc.org/images/entities/char_2009.gif) 000.
000.
![[thin space (1/6-em)]](https://www.rsc.org/images/entities/char_2009.gif) 000.
000.
![[thin space (1/6-em)]](https://www.rsc.org/images/entities/char_2009.gif) 000).
000).![[thin space (1/6-em)]](https://www.rsc.org/images/entities/char_2009.gif) Mw of the polymer. The size of the aggregates lay in a range of 150 to 180 nm, depending on the molecular weight of the polymer. The normalized time correlation function of the scattering field, G1(τ), revealed that the CA-captured PAA produced monodisperse spherical aggregates. For monodisperse spherical particles, G1(τ) displays a single exponential decay with time.89 As shown in Fig. 21, the polymer with Mw = 15
Mw of the polymer. The size of the aggregates lay in a range of 150 to 180 nm, depending on the molecular weight of the polymer. The normalized time correlation function of the scattering field, G1(τ), revealed that the CA-captured PAA produced monodisperse spherical aggregates. For monodisperse spherical particles, G1(τ) displays a single exponential decay with time.89 As shown in Fig. 21, the polymer with Mw = 15![[thin space (1/6-em)]](https://www.rsc.org/images/entities/char_2009.gif) 000 and SDS/AA = 0.5 exhibited a linear decay of ln(G1(τ)) with time, indicating the formation of monodisperse spherical aggregates due to the intramolecular self-assembly of the long polymer chain. As the molecular weight decreased, the ln(G1(τ)) decay deviated from a linear line (Fig. S2†). The low-molecular-weight polymer had the potential to form non-spherical or polydisperse nanoparticles due to their random intermolecular aggregation.
000 and SDS/AA = 0.5 exhibited a linear decay of ln(G1(τ)) with time, indicating the formation of monodisperse spherical aggregates due to the intramolecular self-assembly of the long polymer chain. As the molecular weight decreased, the ln(G1(τ)) decay deviated from a linear line (Fig. S2†). The low-molecular-weight polymer had the potential to form non-spherical or polydisperse nanoparticles due to their random intermolecular aggregation.

![[thin space (1/6-em)]](https://www.rsc.org/images/entities/char_2009.gif) 000, [AA]0 = 3.59 × 10⁻³ mol L−1.
000, [AA]0 = 3.59 × 10⁻³ mol L−1.


![[thin space (1/6-em)]](https://www.rsc.org/images/entities/char_2009.gif) 000. SDS/AA = 0.5. [AA]0 = 3.59 × 10⁻³ mol L−1.
000. SDS/AA = 0.5. [AA]0 = 3.59 × 10⁻³ mol L−1.


